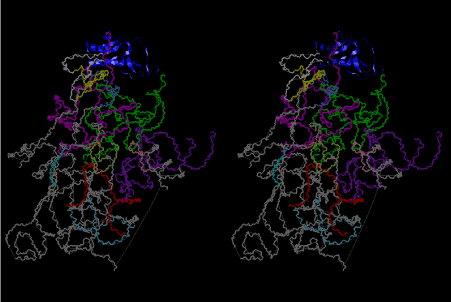
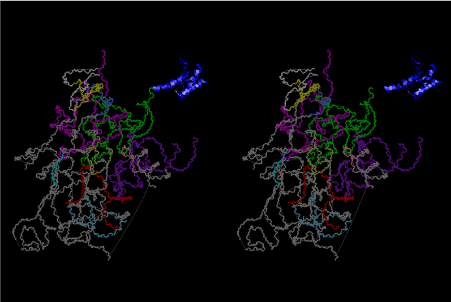
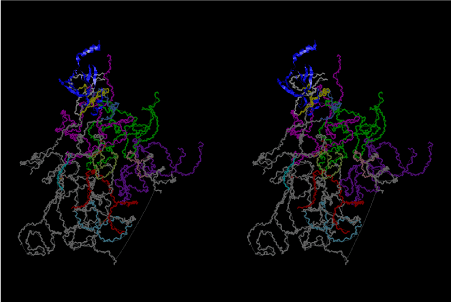
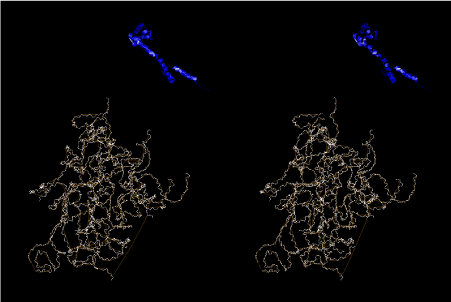
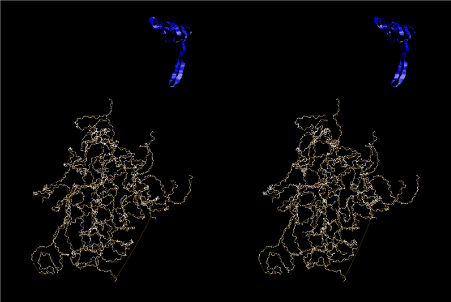
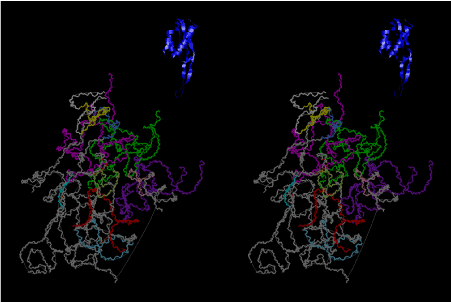
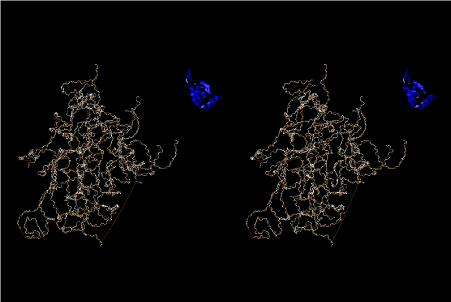
Abstract
Origin of life on earth must be started from a story explaining how ribonucleic acids (RNAs) had been accumulated in azoic era. Since the world of nonazoic era could have been full of water, a single molecule of RNA should have been in danger of hydrolysis rather than in a tendency of progressive synthesis. It necessarily requires coevolution of proteins that had been playing a role of protecting RNA from hydrolysis. The present article describes a possibility of a large-scale of confined organic phosphates and methane hydrates under high pressure and temperature deeply hidden into the mantle of the earth. In such conditions, a polymeric form of D-ribose can be made as a left-handed helix connected by base pairs with neighboring strands. In the lattice of left-handed helices of RNA, a lot of spaces or gaps allowed accumulation of various amino acids, from the smallest one such as glycine to not very large as tryptophan. At the 3’ end of a polymeric RNA strand, aminoacylation could also occur. The other essential substances to the origin of life, such as adenine-triphosphates, could have been accumulated together.
Introduction
Fossils have shown that biochemically advanced microbial life had existed on earth over 3 billion years ago. Since the age of earth is believed to be about 4.6 billion years, it would be natural to think that prebiotic molecules of nucleic acids and proteins had been accumulated either shortly after or at the same time of the birth of the earth, the surface of which at that time was magmatic ocean covered by a thick layer of vaporized water molecules and various gaseous molecules, rather rich in hydrogen molecules. Glycine, α-amino-isobutyric acid, alanine, glutamic acid, β-alanine, isovaline, aspartic acid, and leucine were observed in the Murchison meteorite [1]. Although they reported the relative abundance of L-enantiomer, it might not be the cause of the origin of the prevailance of L-enantiomer on the present-day earth [2,3]. In the Yamato-91198 meteorite, serine, threonine, proline, valine, isoleucine, sarcosine, α-aminobutyric acid, β-aminobutyric acid, γ-aminobutyric acid, α-aminoisobutyric acid, α-aminoadiopic acid, various aliphatic carbonic acid, and aliphatic as well as aromatic hydrocarbons were observed. However, no sign of nucleic acids has been observed in meteorites except some purines and pyrimidines. Some of them might have been synthesized by a shock of thunder, while some of them, such as nucleic acids in particular, might have been destroyed on a boiled magmatic ocean. Accordingly, it remains an etigma how nucleic acid had been formed using D-riboses as its main component among many other pentose candidates. The present article tries to present a hypothesis that solves the problem of multiple difficulties to reach the origin of life from the origin of earth.
Evolution of earth
The origin of earth has been supposed to be a gathering center of meteorites and comets. A core of comet is usually composed of ice water and dry ice (carbon dioxide) as well as methane, ammonia, silicates, and phosphates. On the other hand, the components of meteorites are mainly reduced metals and metal oxides. Surface temperature of primordial earth would have been pretty high by thermal energy produced by collisions of comets and meteorites, but would have been cooled down when its core became occupied by components of meteorites and its surface was covered by those from comets. The above process in evolution of earth should be referred to as the first stage. The second stage in the history of earth started from temperature elevation in its core by accumulation of thermal energy originated from disintegration of uranium atoms. At this stage, the surface temperature would have been as cool as that of comets. As temperature in the core of the earth was elevated, water vapour would have been concentrated in the atmosphere of the ancient earth, while its surface would have been rather a magmatic ocean composed of exposed hot mantle, on which hot rain would have been falling to make a lot of boiling lakes. The boiling lakes might have grown up to form a boiling ocean. It should be referred to as the third stage. The fourth stage in the history of earth would be in the cooling process. When the first signs of the ancient life existed over 3 billion years ago, the evolution of RNA had already reached a ripening period. The basic hypothesis adopted in the present article is that the evolution of RNA started from the end of the first stage and continued until the end of the third stage.
Accumulation of organic phosphates and aromatic amines
A mineralogical form of the mixture of water and methane at a very low temperature under a high pressure would have been that of methane hydrate that is known to be very inflammable in contact with oxygen gas. This phenomenon would mean that methyl radical is easily formed by reacting with an oxygen atom. Since the primeval atmosphere is supposed to be rich in hydrogen molecules, the most of the reactive oxygen atoms would have been reserved in a form of ferrous oxide brought about by meteorites. Accordingly, one of the conceivable starting events of abiogenic biological substance synthesis would have been a contact of the methane hydrate and ferrous oxide in the deep center of the gaseous earth under a high pressure and a low temperature. Disintegration of uranium atoms might have played a role in producing oxygen radical, which might also be an origin of the formation of hot mantle and core of the earth by concentration of melted reduced iron in the center of the earth. The possible various chain reactions from the methyl radical would have produced various aliphatic and aromatic chains and fatty acids. Specific gravities of such organic compounds synthesized abiogenically on the primeval earth are supposed to be heavier than that of methane hydrate that carries much higher content of hydrogen atoms. Most of organic compounds brought about by meteorites would have been mixed with the newly synthesized ones. Those were precipitated deeply in order of specific gravity at the bottom layer on the mantle of the earth. Since the mantle were not well separated enough from the core, those organic compounds of approximately uniform composition had an intimate contact with the rocks of metallic meteorites containing ferrous oxide and uranium as well as silicates, sulfates, and phosphates. The first organic compound synthesized in this way would have been methanol, which could have occupied the lattice position of water molecule in the crystalline form of methane hydrate. Condensation reaction between two methanol molecules with an oxygen radical would have produced a molecule of diose that is a simplest form of sugar containing two carbon atoms. A similar condensation between one molecule of diose and methanol would have produced a triose without isomers. This is called glycerol. Phosphorylation of glycerol produce glycerophosphoric acid, which has three isomers. Triose molecules were synthesized just below the interface with the methane hydrate layer, but deposited deeply in the bottom of the mantle. Further evolution of organic compounds from triose could be independent of the presence of the methane hydrate. It is, however, important to assume that the main chemical reactions were promoted by oxygen radicals. A similar condensation reaction between two trioses could have produced hexoses, and a simultaneous condensation of three trioses with two oxygen radicals would have produced glycerols. Such a mixture of hexoses and glycerols could have made a contact with an energy-rich polyphosphoric acids in the rocks. Polyphosphates could also be formed inside a rock probably by intervention of oxygen radicals. It would have been a considerable period before accumulation of phosphohexoses and phosphoglycerols were completed. Such reactions could have proceeded at a low temperature. As the temperature of the mantle started elevating, dehydration reactions between phosphohexoses and between phosphoglycerols and fatty acids gradually started syntheses of polyphosphohexoses and phospholipids, both of which were separated from each other in accordance with their physicochemical characters.
Accumulation of phospho-D-ribose polymer as left-handed single-stranded helices
One of the points in the present hypothesis is that the primeval earth would have been covered by aliphatic and aromatic compounds including their derivatives such as fatty acids, because the densities of nitrogen-, sulfur-, and phosphorus-containing organic compounds are supposed to be larger than those containing only hydrogen, carbon and oxygen atoms. Accordingly, various amino acids without phosphorus atom would have been accumulated under the first layer of petroleum oil and fatty acids. The hydrogen-bonding network of methane hydrate would have been in the second layer mixed with ammonia, sulfate (or mercaptan), phosphin, amino acids, alkylamines, etc., and made a direct contact with ferrous oxide and silicates. Methanol radical as a reaction product of methyl radical and water would have been trapped inside the hydrogen-bonding network and would have resulted in formation of glyceride and phosphoglyceride. Glyceride would have been a starting material for various sugar synthesis including various pentoses. The reaction between phosphoglyceride and fatty acids would have formed a phospholipid as a single layer between the first petroleum oil layer and the second or third layers rich in hydrogen-bonding capacities. Accumulation of polyphosphate might have been important at this stage, because the leading role of organic reactions in evolution of both earth and life would be shifting gradually from the radical reaction described above to polymerization by dehydration of amino acids and phosphosugars through reaction intermediates such as sugar triphosphates.
It is natural to suppose that the high concentration of water vapor kept the surface temperature not too high from that of boiling water. If the temperature was not too high, there could be enough amount of organic compounds covering the surface of the magmatic ocean, where polymerization of small organic compounds by dehydration reaction would have been prevailing, phosphorylation of polymerized organic compounds could have been processed in the melted solution of phosphate and silicate on the magma. The reason why sulfur atoms were not involved in the process of the polymerization reaction could be due to the boiling and destructive temperature for sulfurylated compounds compared to that of phosphorylated compounds as well as to the delicately adjusted surface temperature of the earth. It is, however, important to note that a primitive sulfur-oxidizing bacteria was found at submarine thermal springs on the Galapagos rift [4]. It utilizes chemosynthesis to derive entire energy supply from reactions between the sea water and the rocks at high temperatures, rather than photosynthesis. At the era of Origins of Life, sulfur oxidizing bacteria could have played a big role, but Corliss, et al. (1979) did not describe anything about how the ancestral bacteria obtained energy-rich phosphate compounds and amino acids from the hot spring water. There could be a possibility of sulfur-containing RNA instead of normal phosphor-containing RNA. As described in the preceding section, accumulation of phosphoglyceride must have occurred under the petroleum oil and phospholipids layers before evolution of RNA. The reaction between phosphoglyceride and methyl radical in the methane hydrate network by oxygen atoms supplied from ferrous oxides would have produced various phosphorylated pentoses and hexoses. Water molecules in the hydrogen-bonding network would be replaced by those phosphorylated sugars as well as various amino acids and alkylamines. On the other hand, Martin, Baross, Kelley and Russell [5] found that the chemistry of the H2-CO2 redox couple in hydrothermal vents showed a striking parallelism with that of the core energy metabolic reactions of some modern prokaryotic autotrophs. Thus, there could be another question about what mechanism initiated the chemistry of life in such an environment as the hydrothermal vent areas. The basic hypothesis of the present article tries to throw a light on that point.
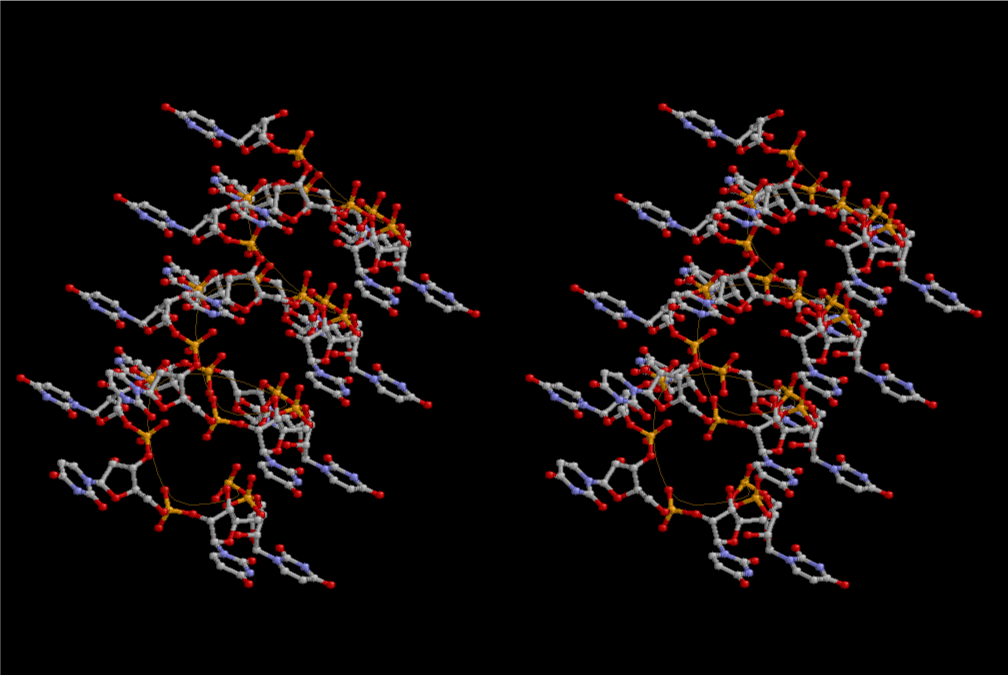
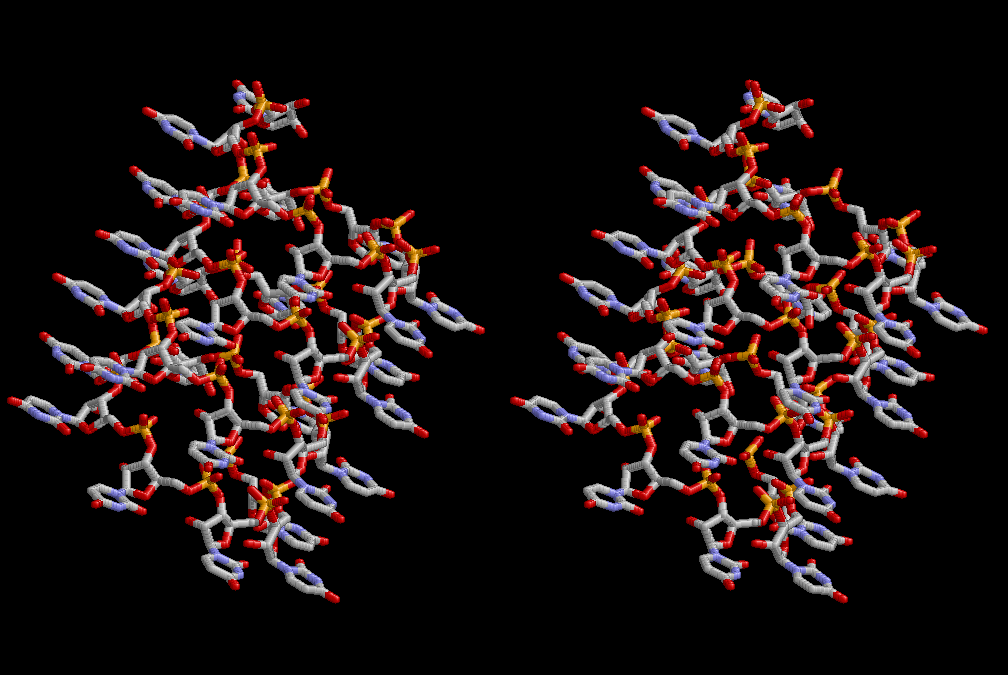
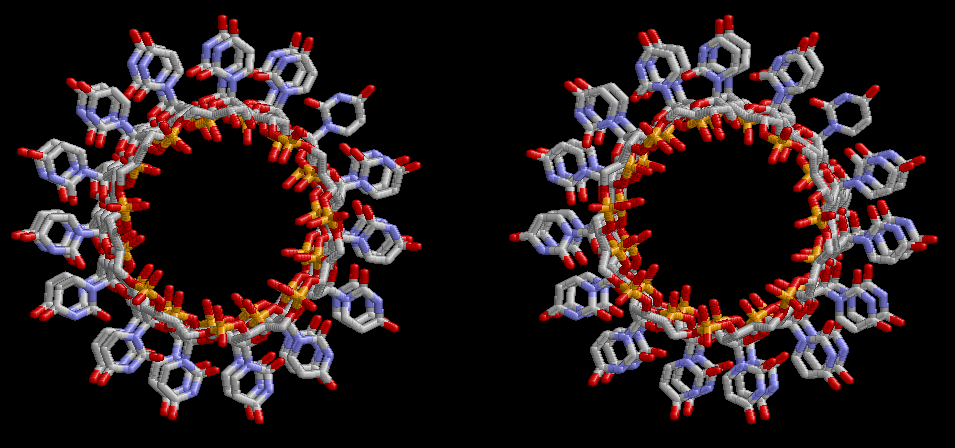
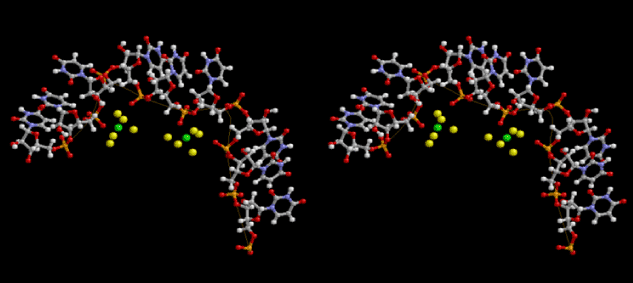
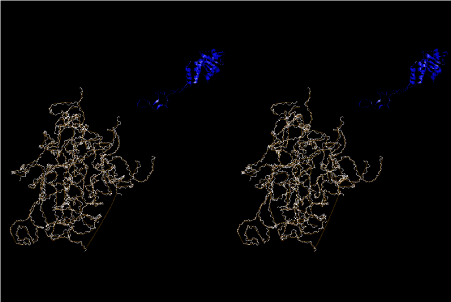
Condensation of glycerophosphoric acid with diose leads to various isomers of ribose, among which phosphor-D-ribose is the most prospective. On the other hand, condensation reactions with carbon radicals and ammonia could have accumulated aromatic ring compounds such as uracil, thymidyl, cytocyl, adenyl, guanosyl radicals etc, among which some hydroxyl ring compounds such as dihydrouracyl would have been included. Joyce (1989) has shown various courses of producing adenine, diaminopurine, hypoxanthine, guanine, and xanthine, starting from hydrogen cyanide (HCN), and passing through diaminomaleonitrile (DAMN) [6]. He has also shown that condensation of glycoaldehyde (HC=OCH2OH) with hydrogen carbon monoxide (H2CO) produces aldotetrose (tetrose), ribulose, xylulose, ribose, arabinose, xylose, lyxose (these are pentoses), and psicose, fructose, sorbose, tagalose, allose, altrose, glucose, mannose, gulose, idose, galactose, talose (these are hexoses). The possible reactions of the phospho-D-ribose with uracil radical, which is the most predominant species among the aromatic compounds mentioned above, could have reached the goal of uridine. One of the biggest merit of 5’-phospho-D-ribose to the other conceivable sugars and sugar phosphates is that it can geometrically be extended infinitely as a left-handed single-stranded helix. The uracil bases planted at C1’ position allows a considerable stability for hydrogen-bonding capability with the neighboring left-handed single-stranded helices. Even if ideal Watson-Crick base pairs of adenine-uracil (A-U) and guanine-cytosine (G-C) or a wobble pair of guanine-uracil (G-U) are not available, uracil-uracil (U-U) base pair guarantees a relative stability. Since some tRNA molecules of animaria mithocondria contains a considerable amount of U-U base pairs in their double stranded helical regions [7]. The reason why the present author emphasizes very much about uridine 5’-phosphate is that it could have a possibility of infinitely large lattice formation with hydrogen-bonded U-U base pairs and left-handed single-stranded helices shown in Figure 1. The distance between two uracil bases is 7.2 Å.
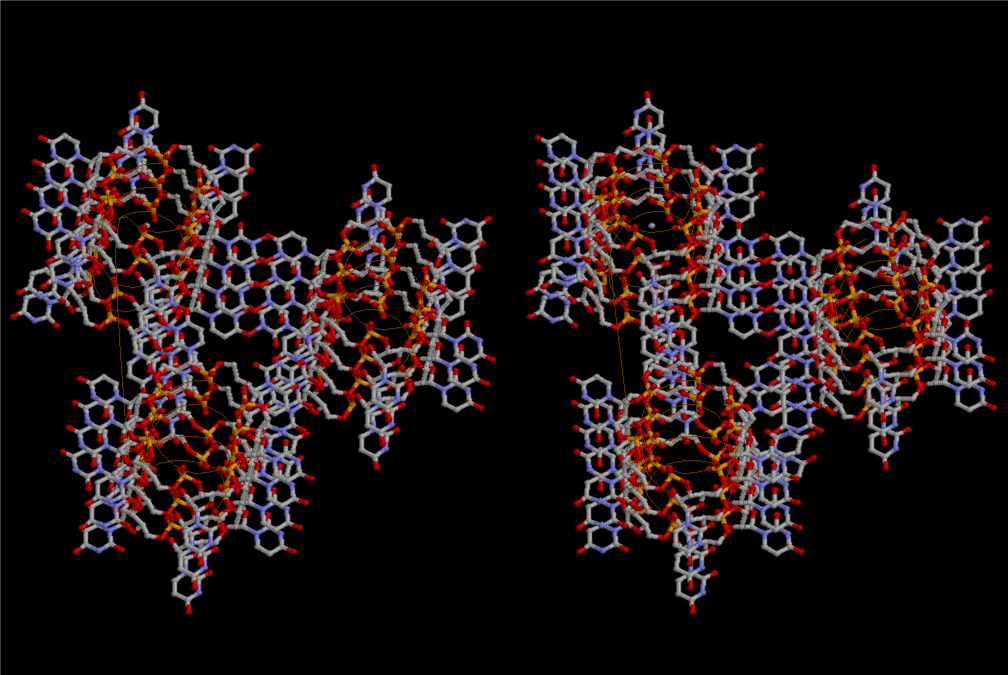
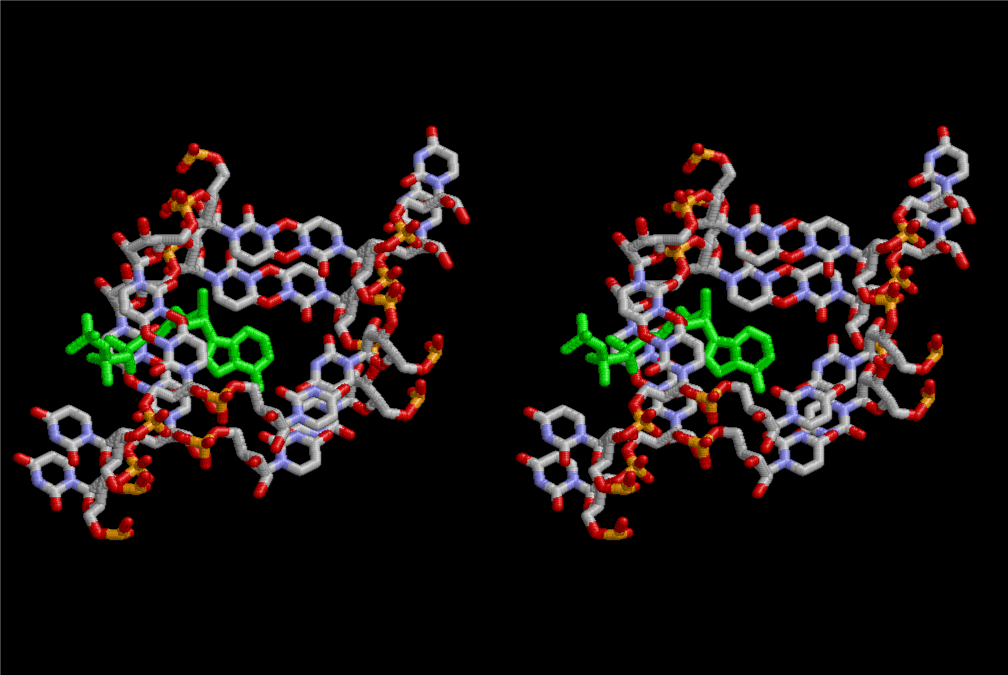
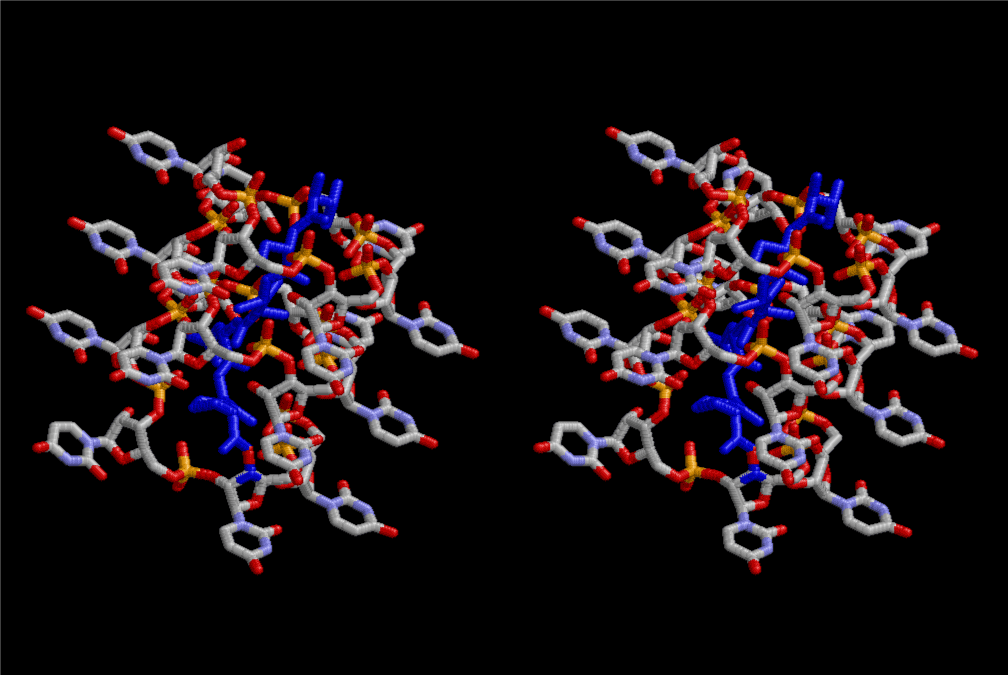
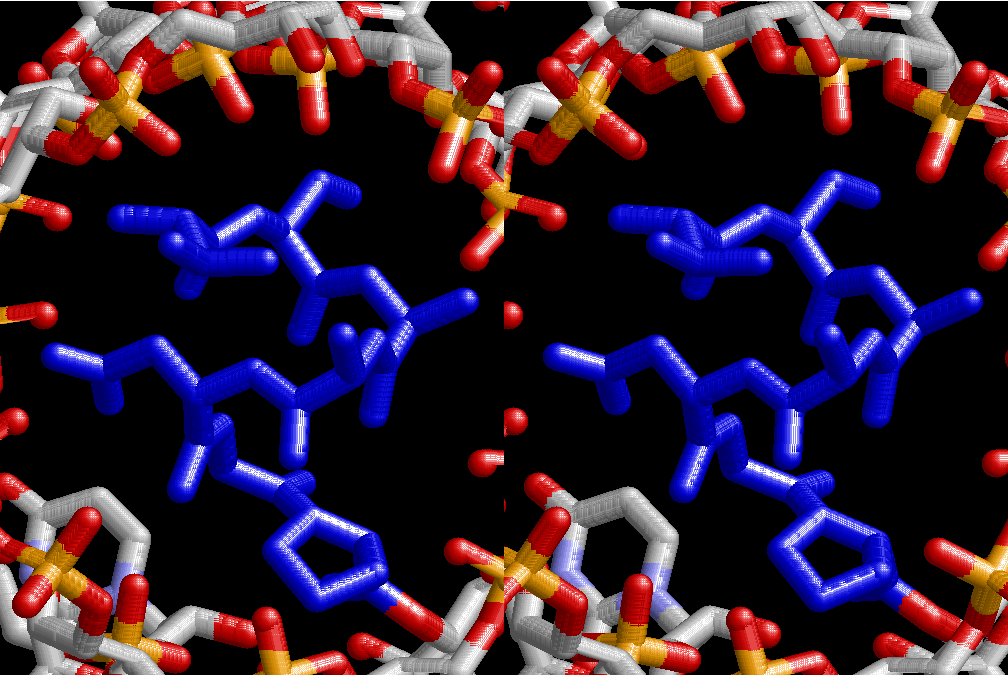
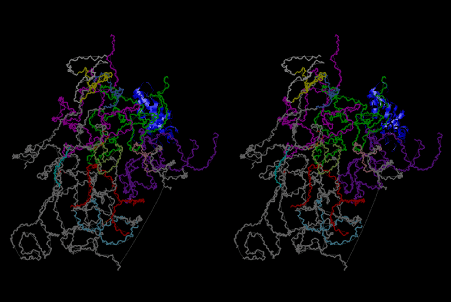
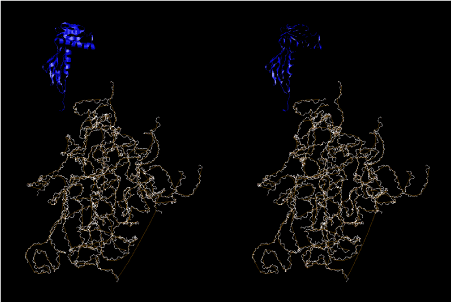
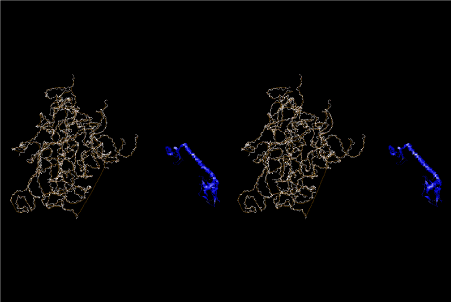
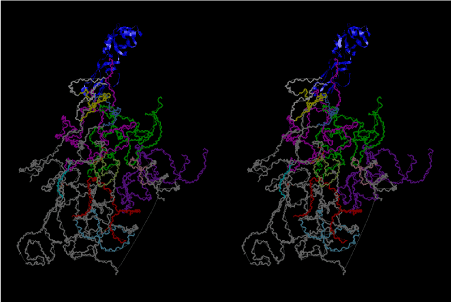
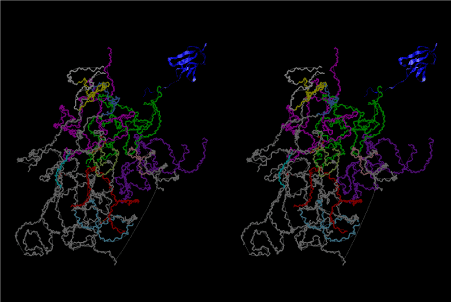
If this is 3.6Å, which is usually the best distance for base stacking, the ring of D-ribose has a fatal near-contact with the neighboring D-ribose ring at 士6th position on the left-handed single-stranded helix. In that sense, the distance of 7.2 Å between the two uracil bases would mean that there is a possibility of intercalate another aromatic bases such as adenine, guanine, etc, between the layer of uracil-uracil hydrogen-bonding network. Figure 2 shows a part of such an infinite helix surrounded by three similar infinite helices stabilized by making U-U base pairs. Such a network of polyuridine chain protects itself from being hydrolyzed by hot water. Figure 3 shows that adenine triphosphate (ATP) can be stacked between the layer of uracil bases. Similar stacking of guanine triphosphate (GTP), and the other nucleotide polyphosphates could occur in the cavity to save the material, even though simple polymerization of such materials are not favorable in order to grow up the polyuridine layer. Joyce (1989) listed up the coenzymes in the present-day living organisms that resemble nucleotides, such as UDP-glucose, CDP-diacylglycerol, S-adenosylmethionine, flavin mononucleotide, thiamine pyrophosphate, nicotinamide, , etc. Those are all capable of being saved in the cavity [6]. The components of cell membranes such as phospholipids are also the competent candidates to be saved in similar way. Even amino acids are capable of being important bulking materials if their side chains are not too big. Polymerization of such small amino acids could have occurred by simple dehydration reaction. Figure 4 shows a case of L-amino acids polymerization growing up in the hole of cavity, even if it is not a right-handed α–helix.
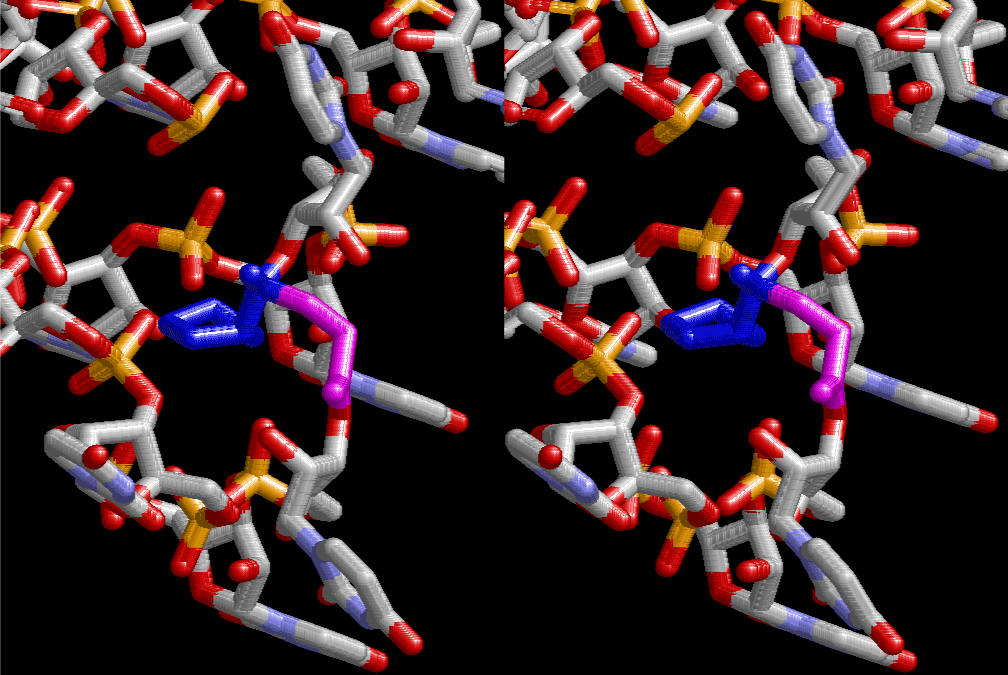
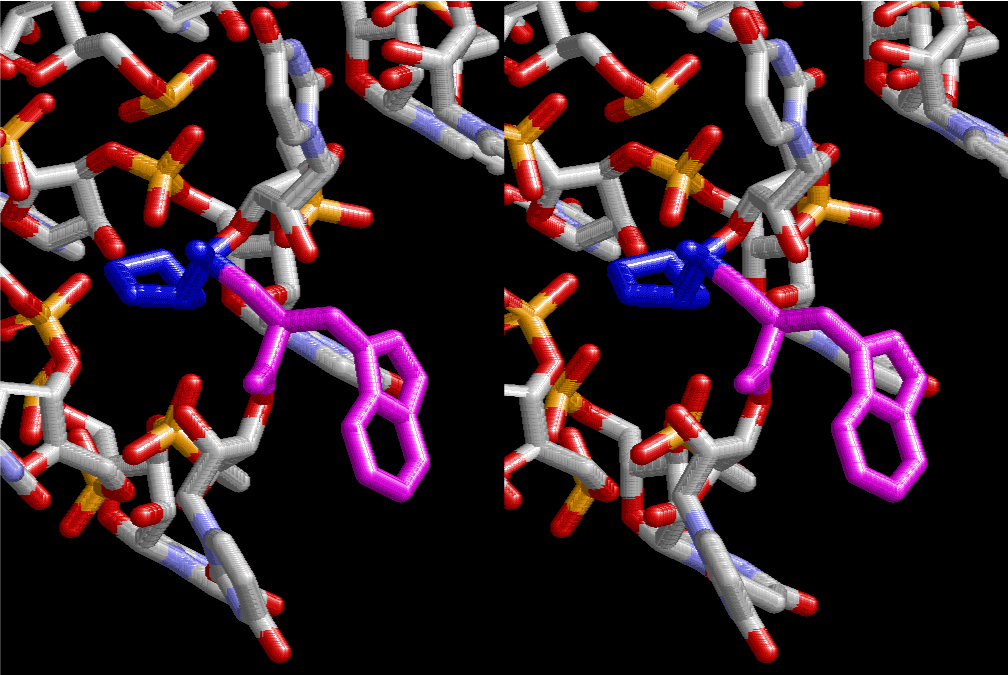
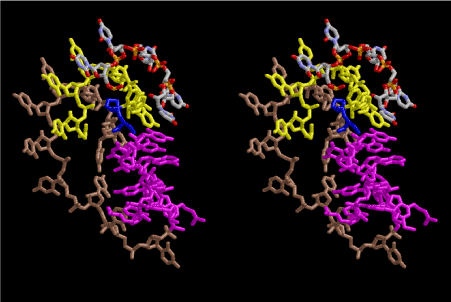
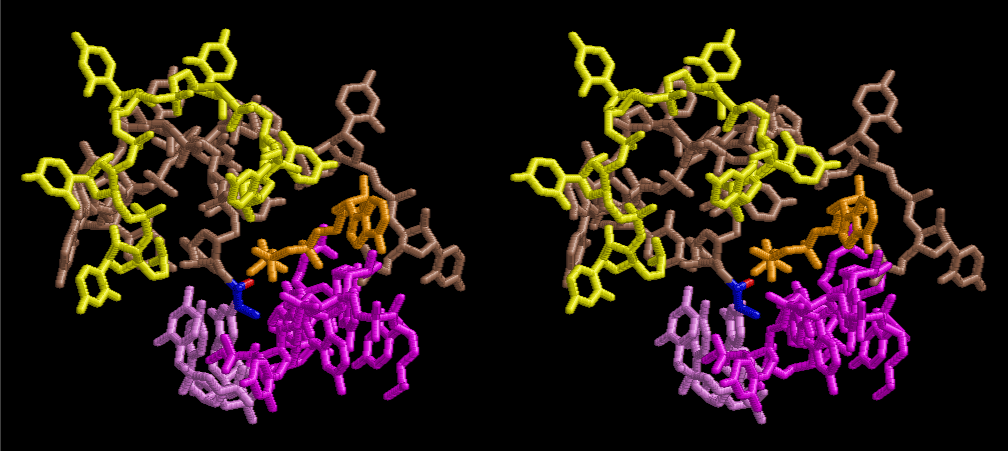
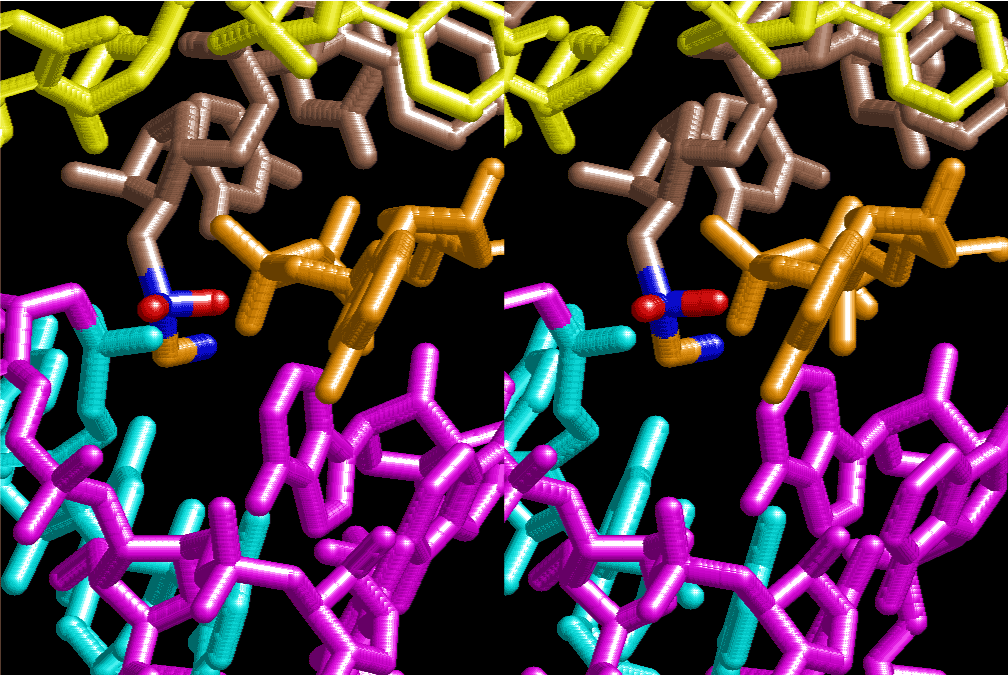
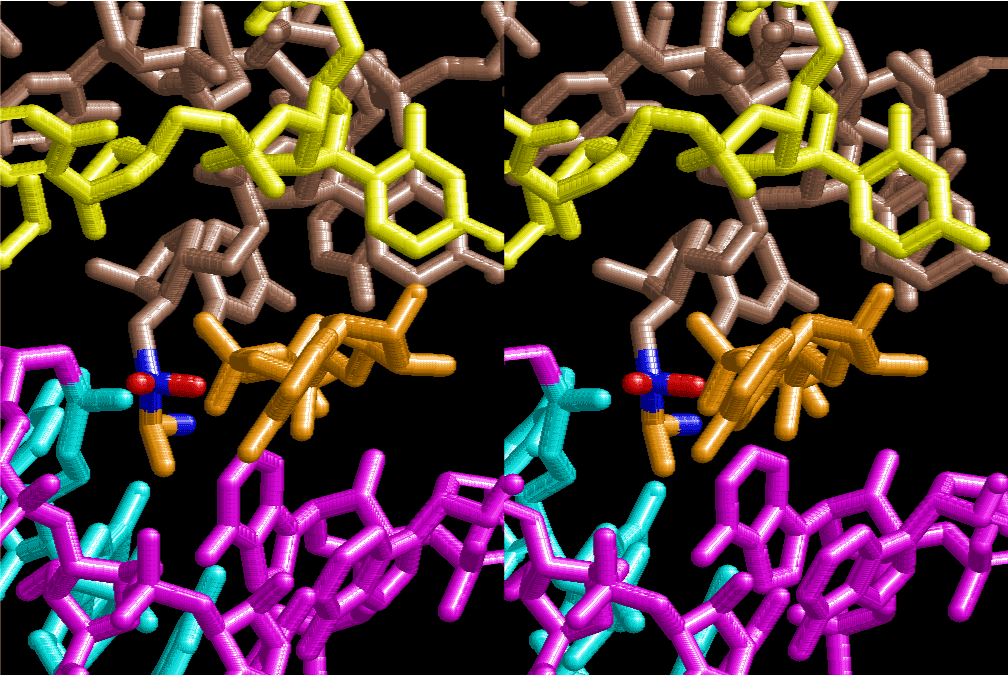
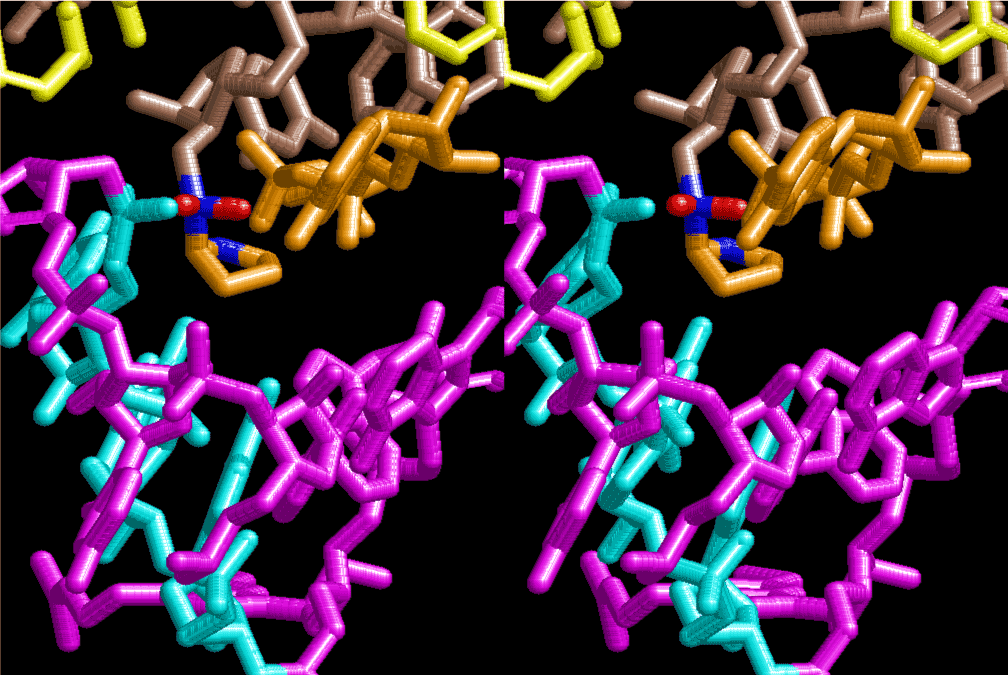
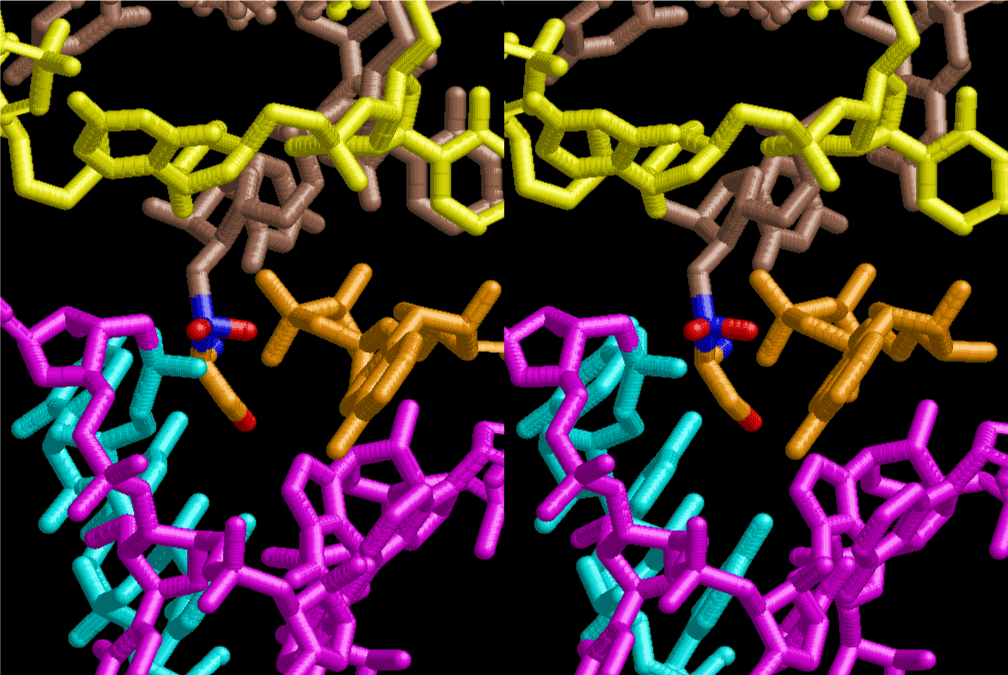
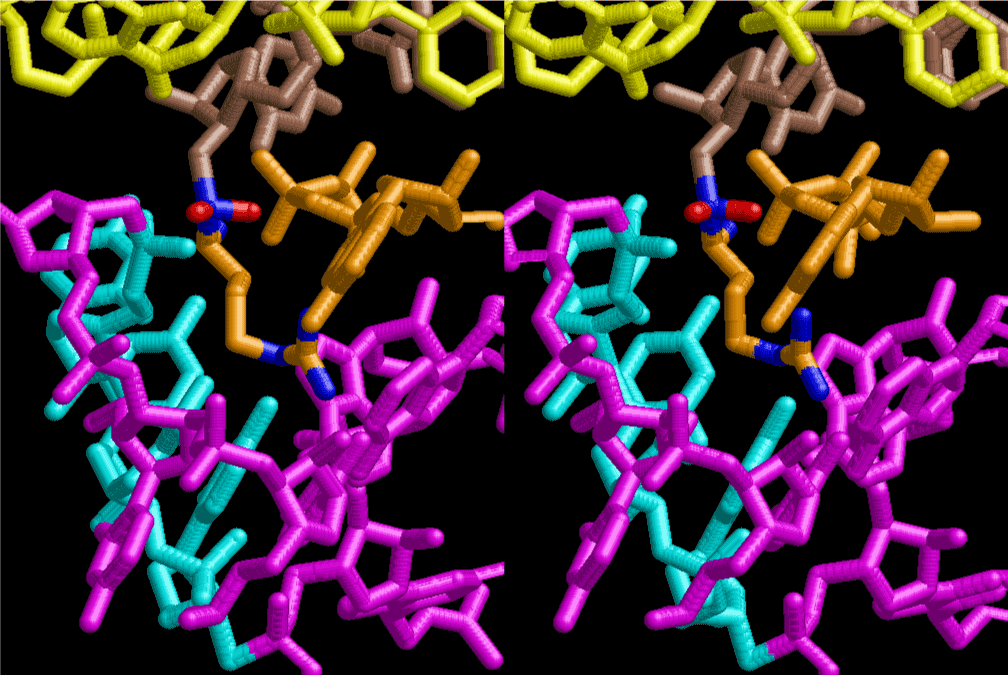
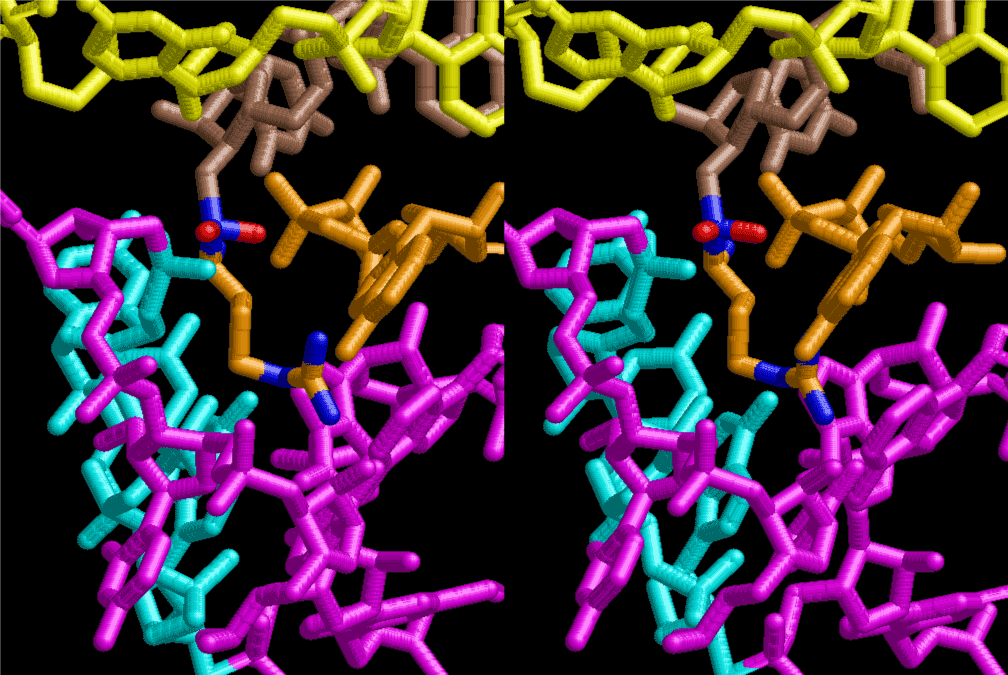
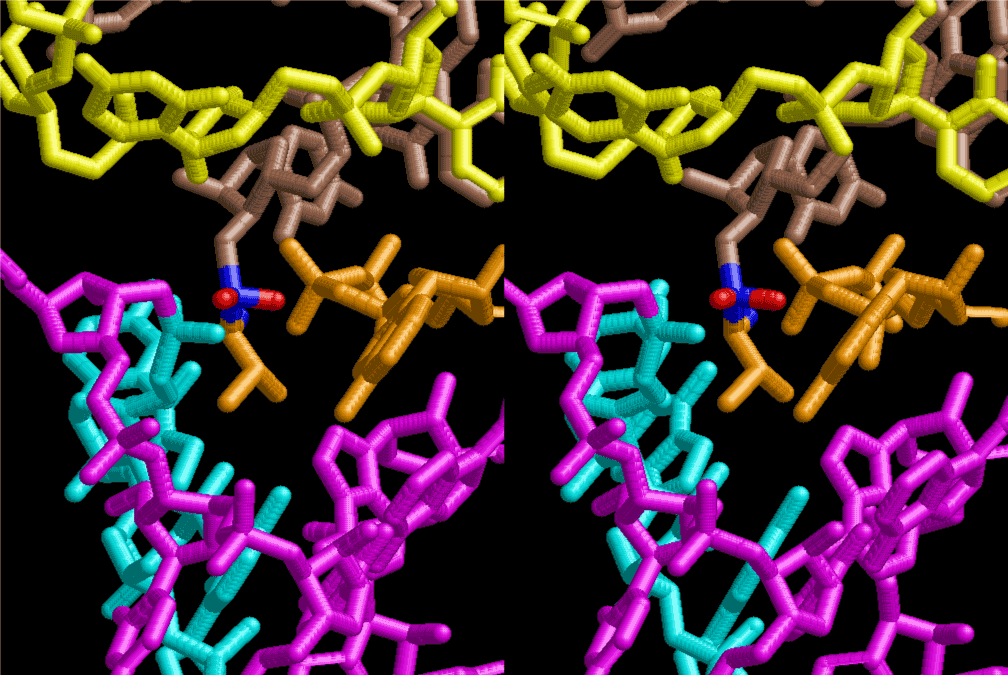
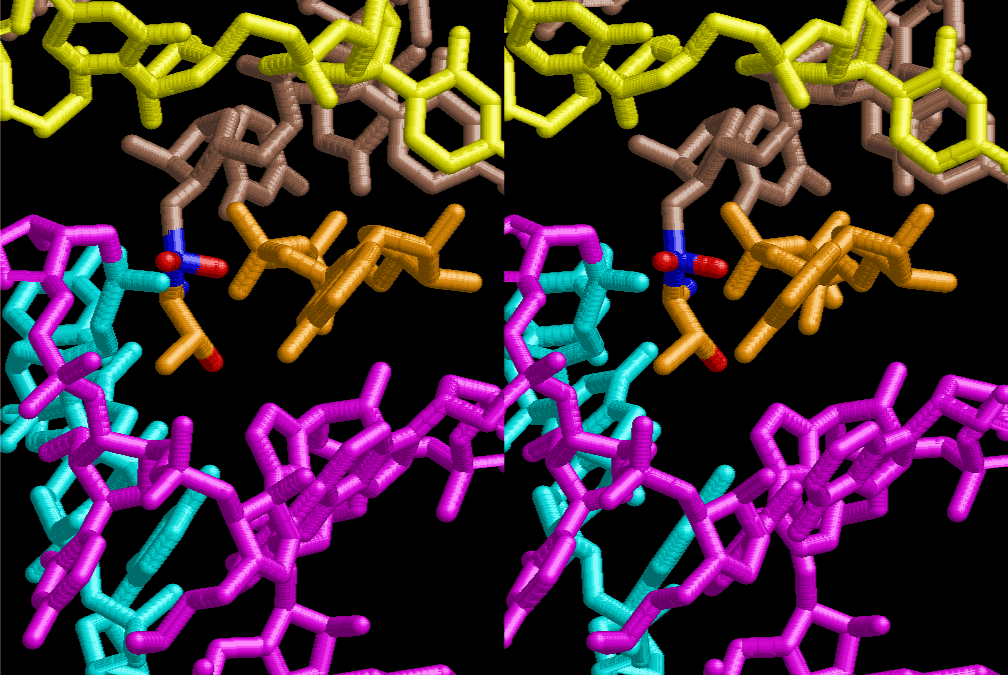
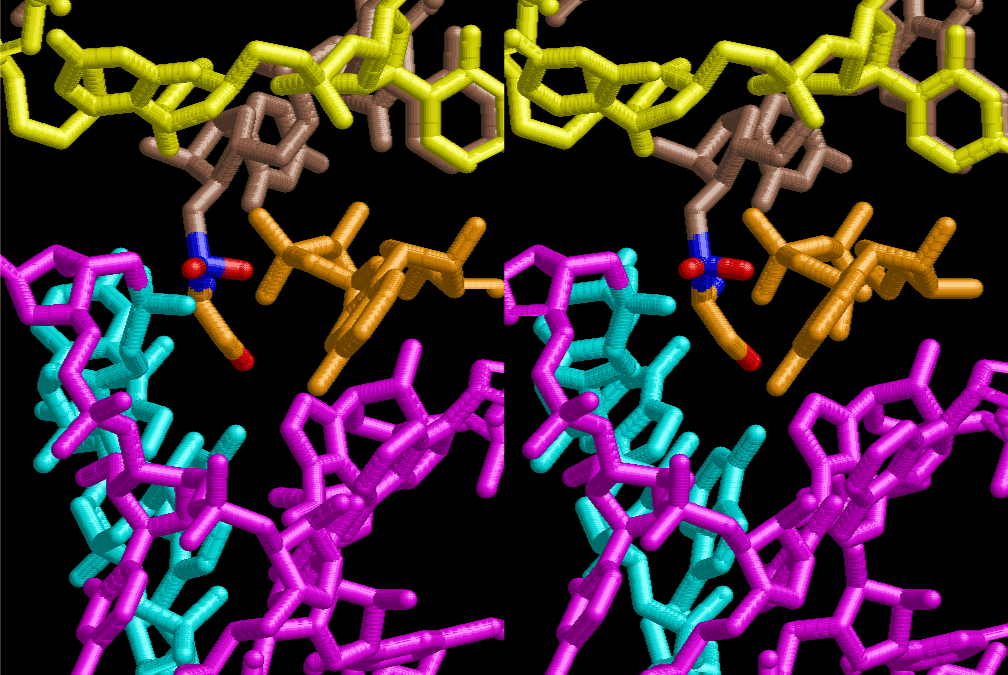
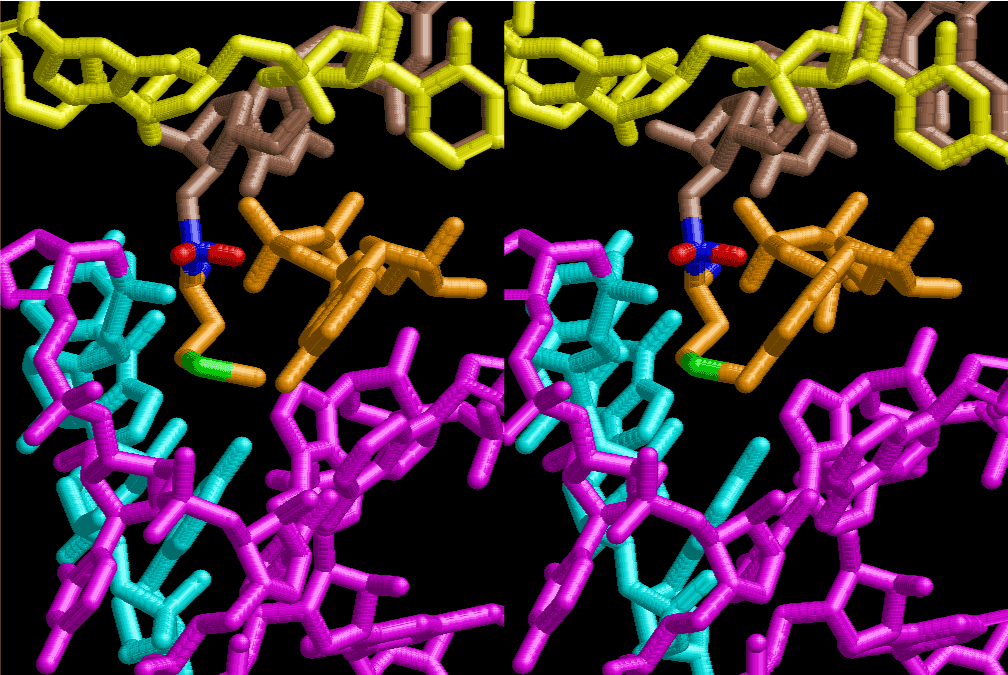
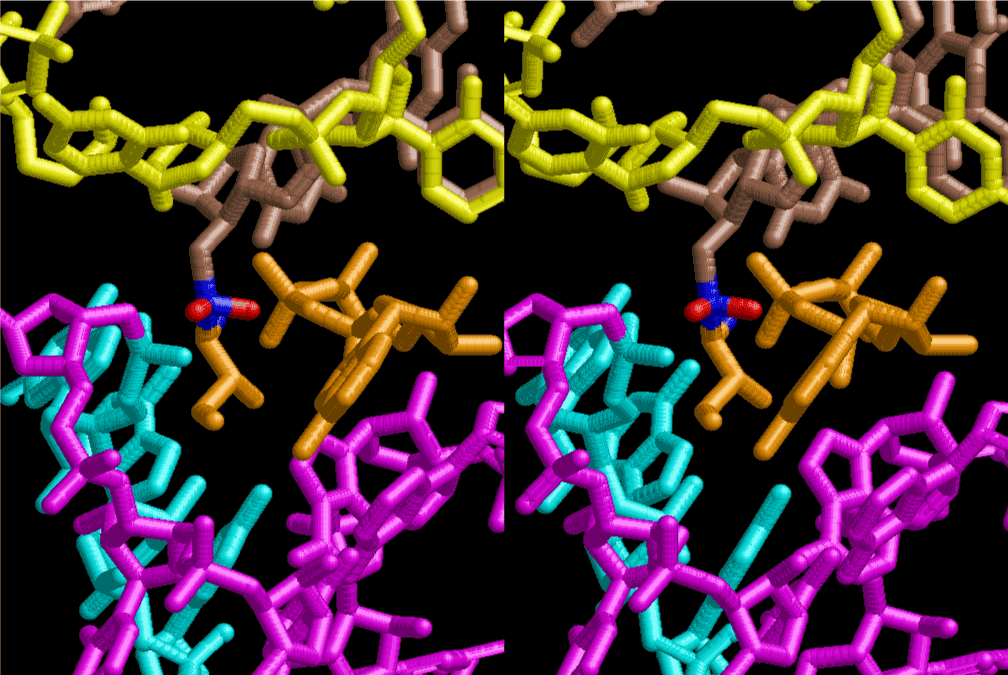
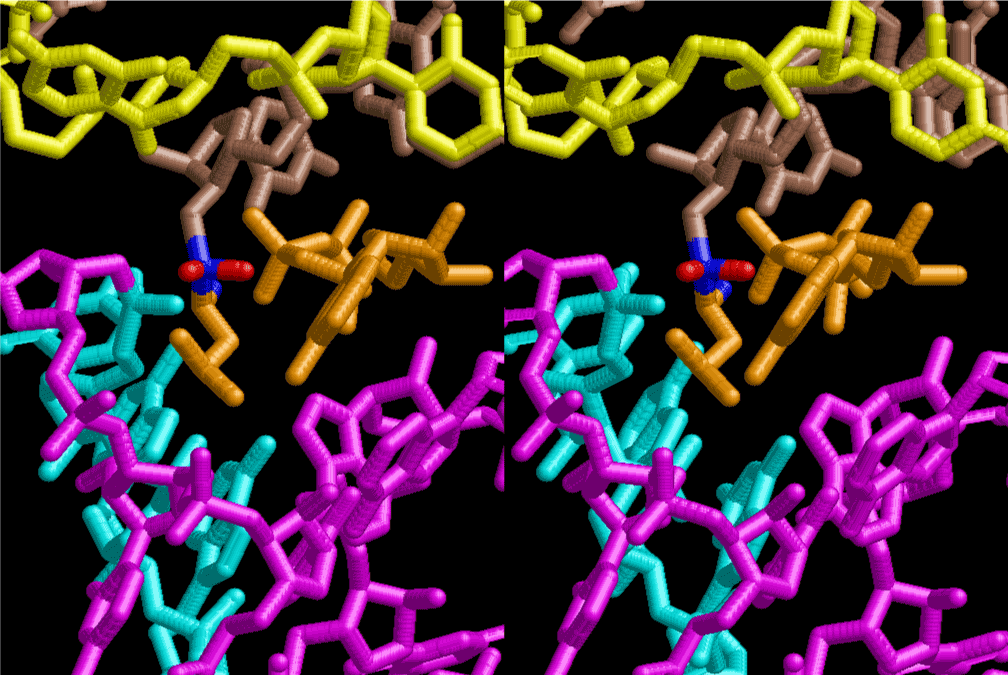
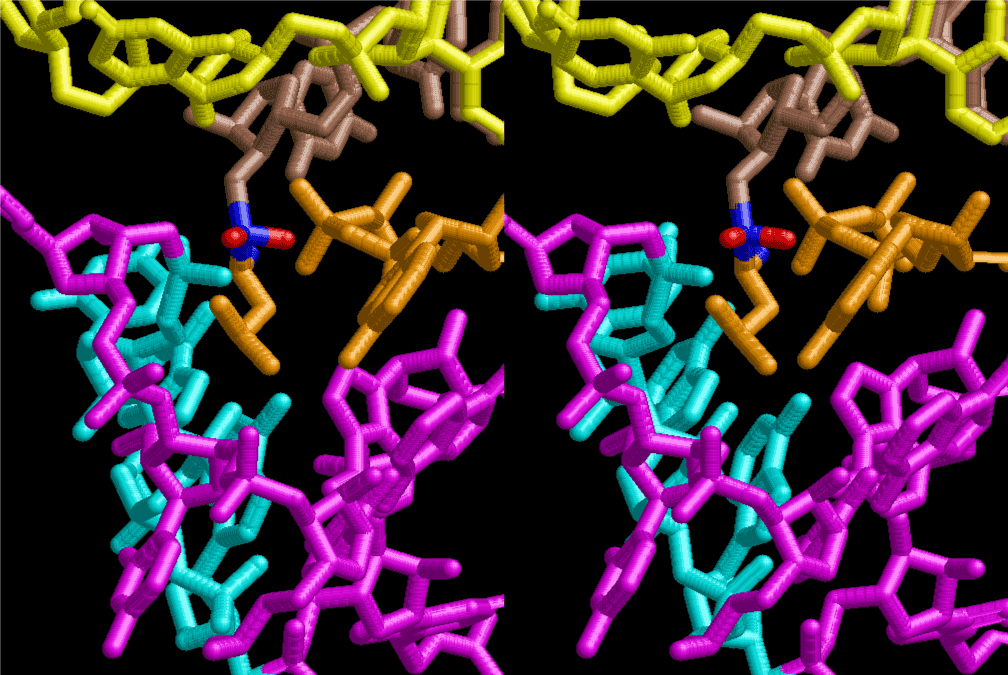
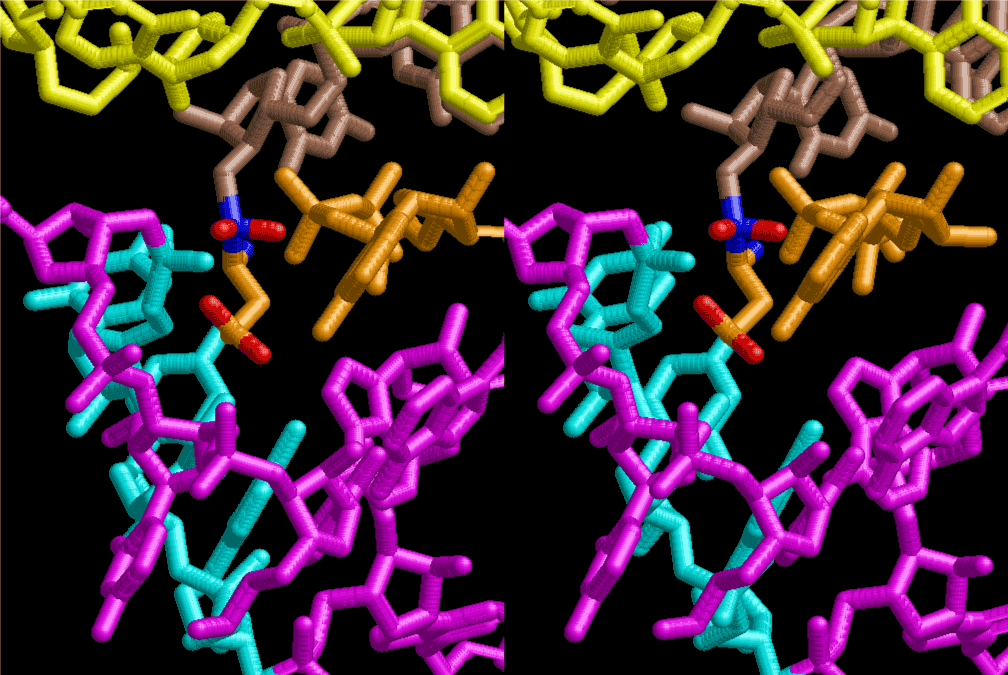
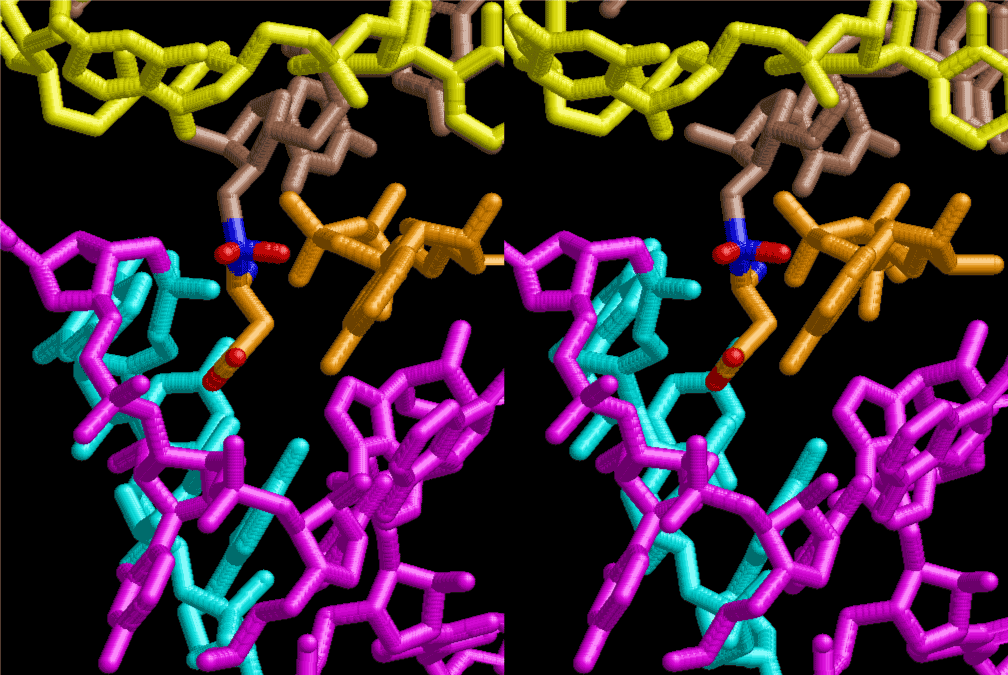
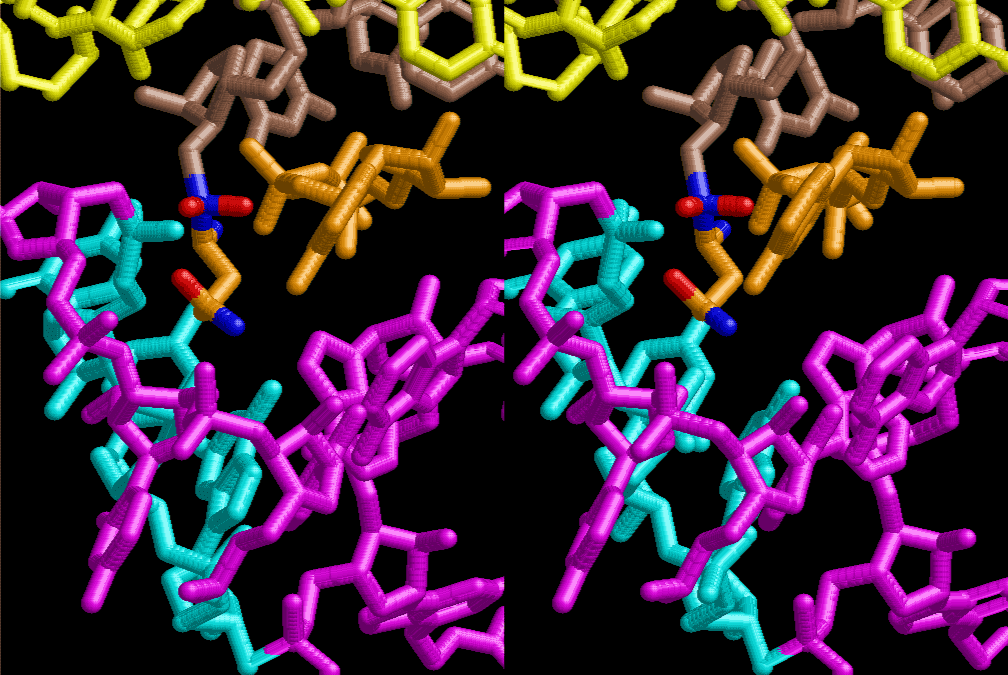
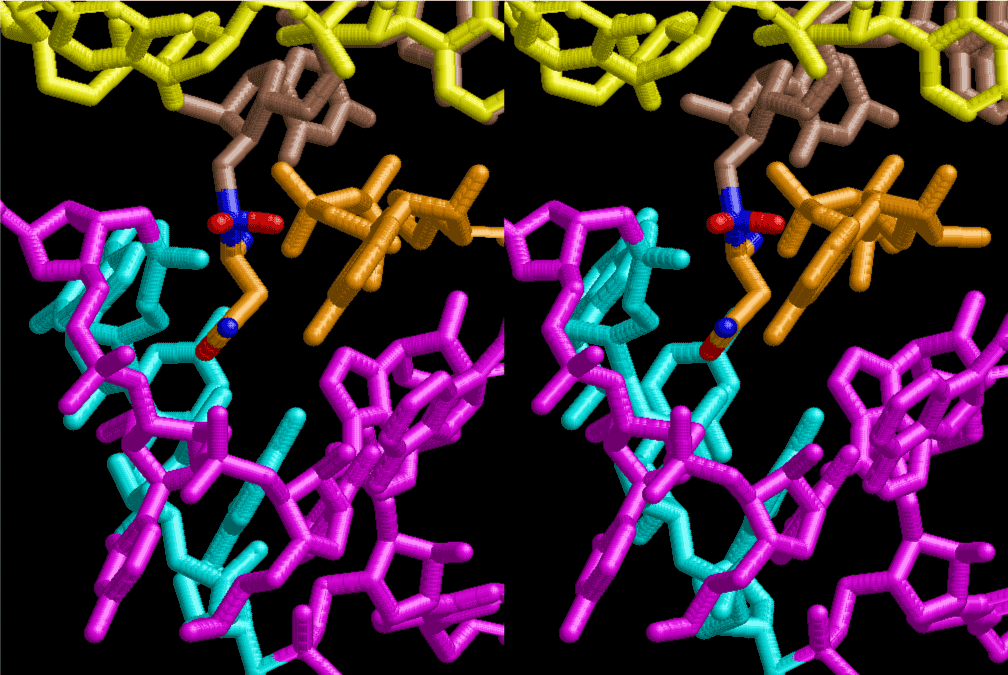
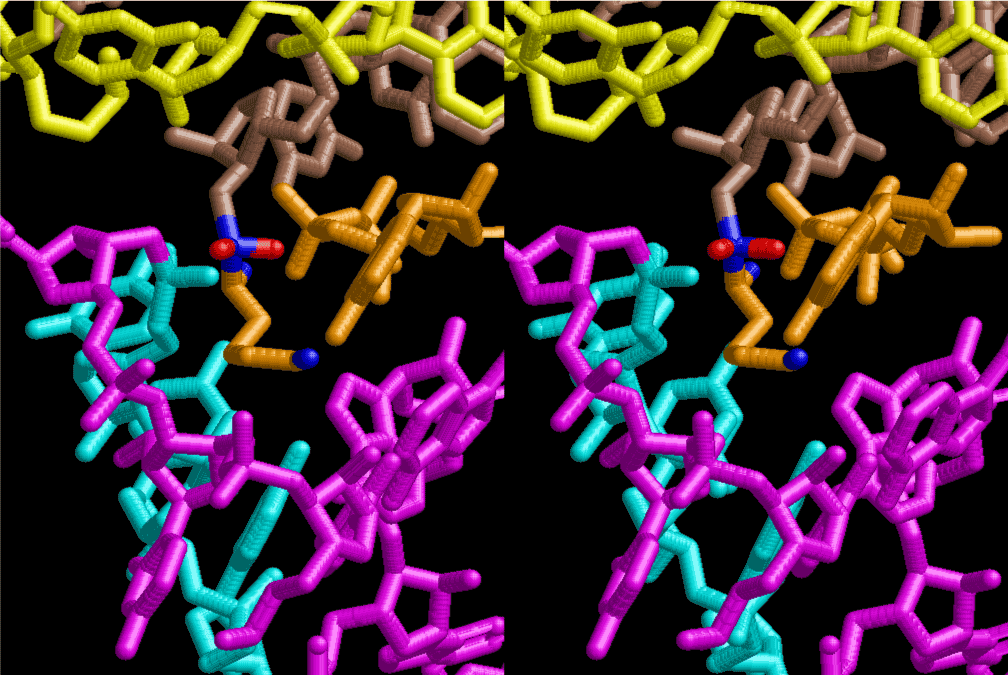
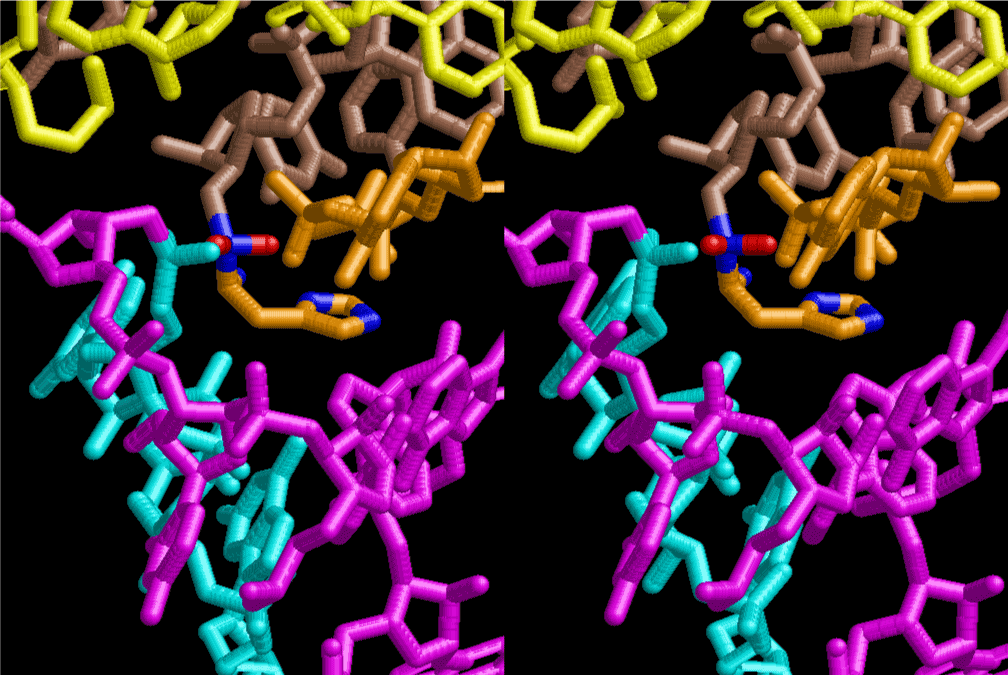
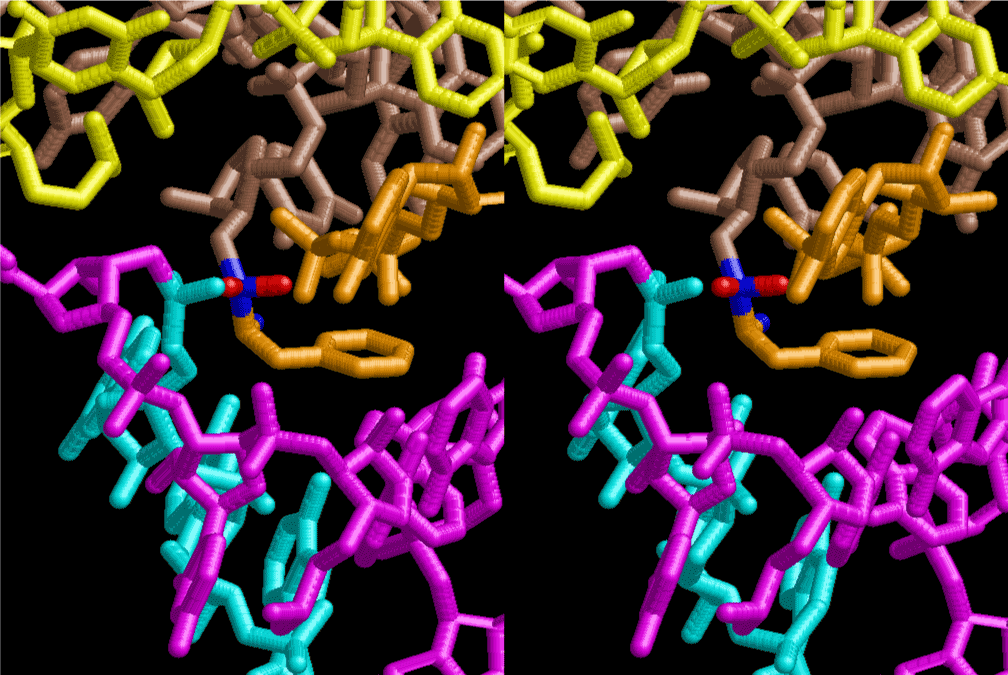
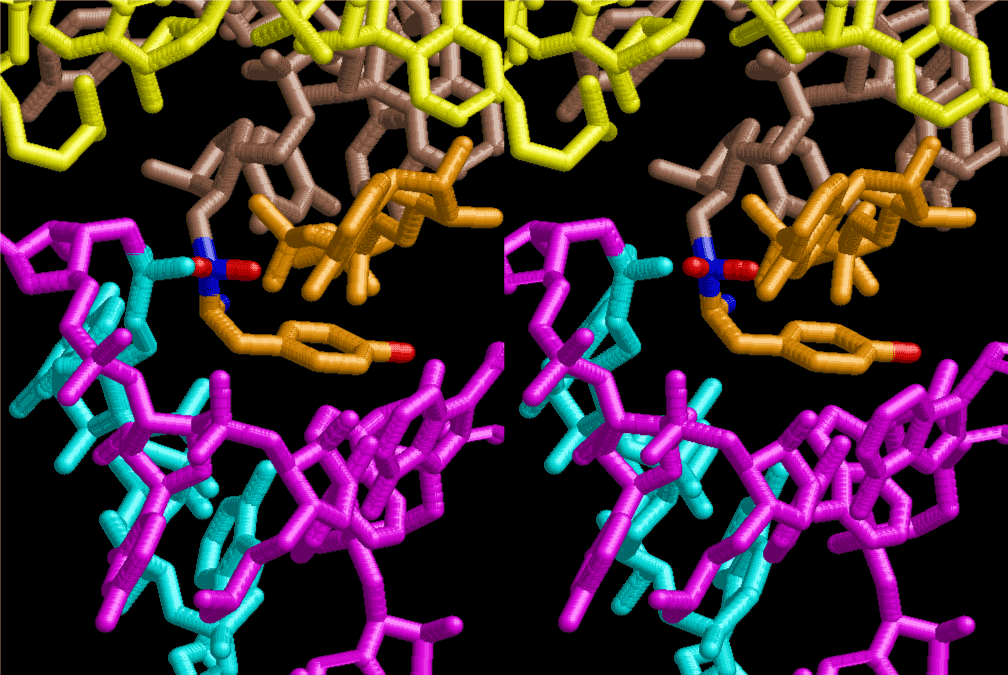
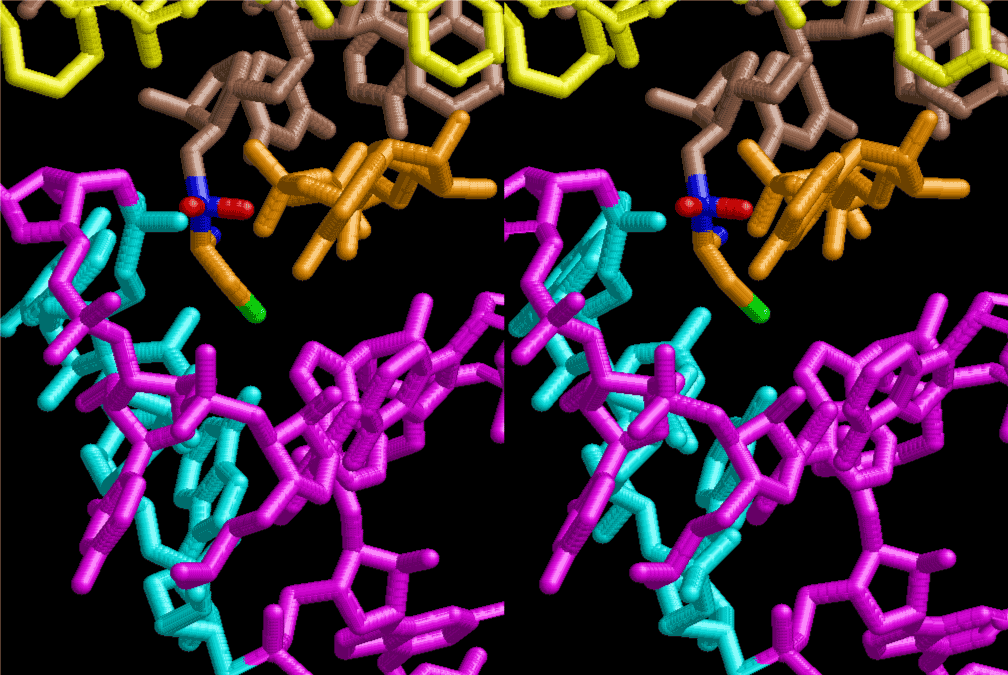
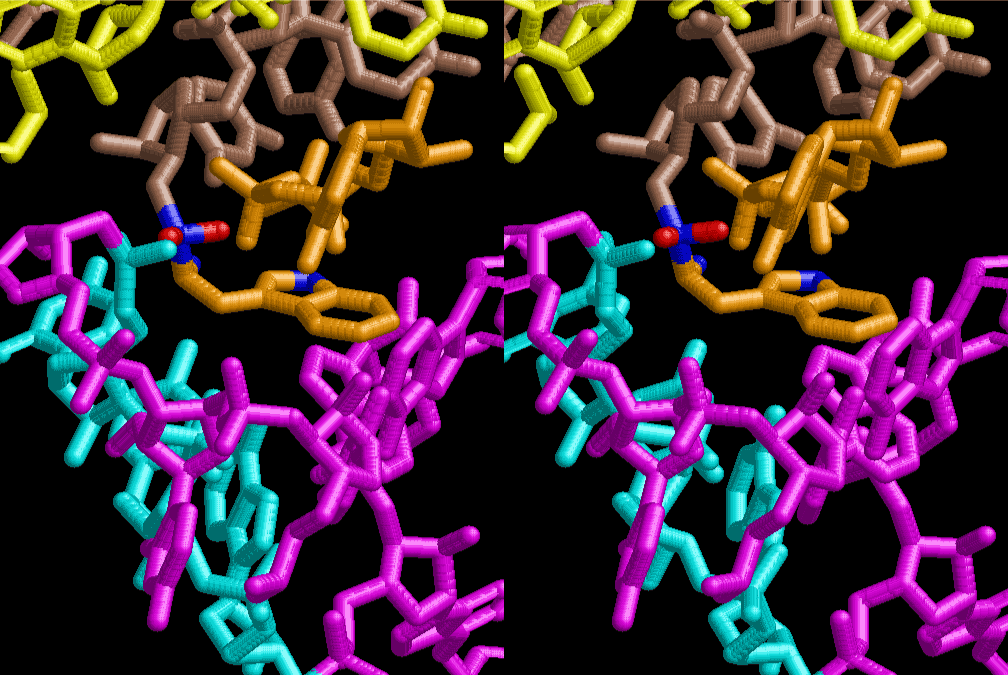
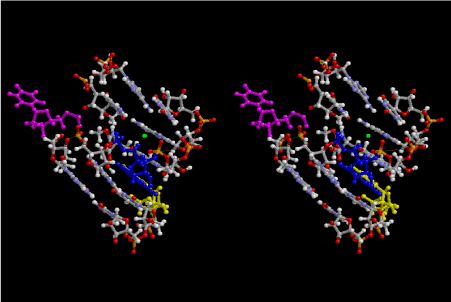
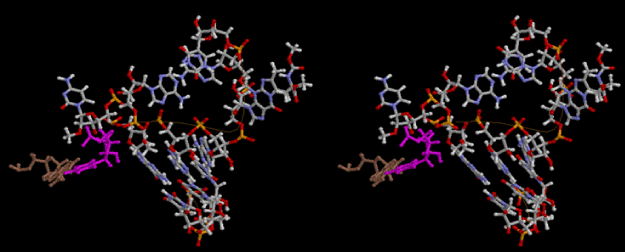
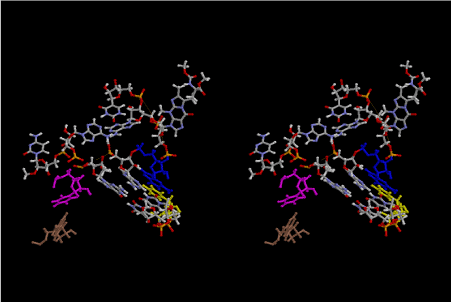
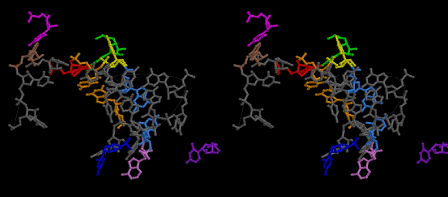
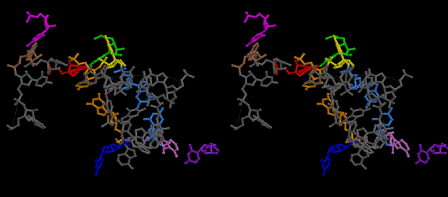
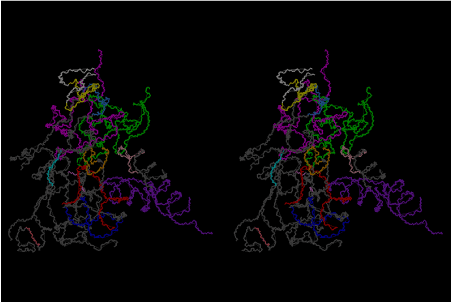
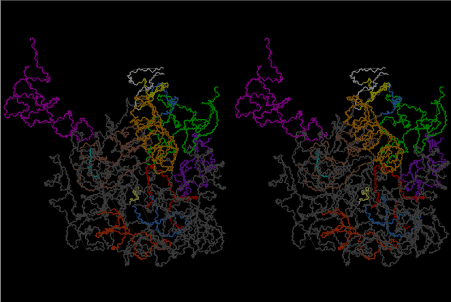
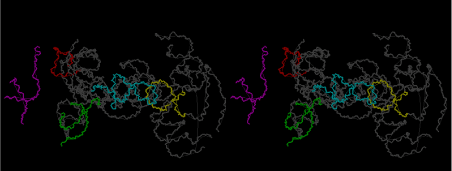
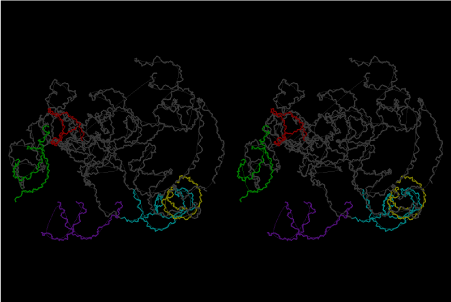
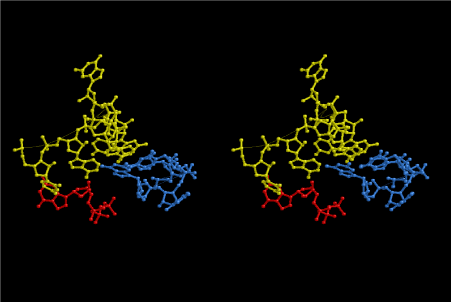
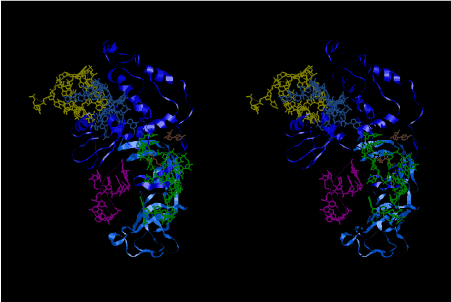
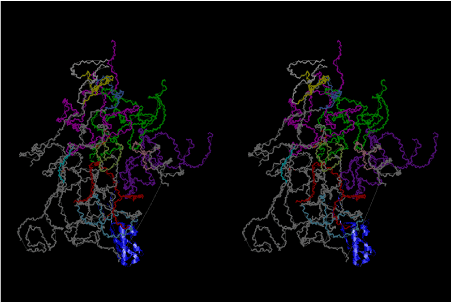
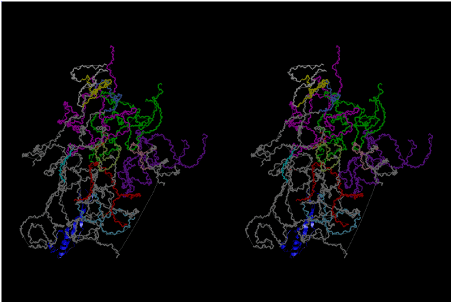
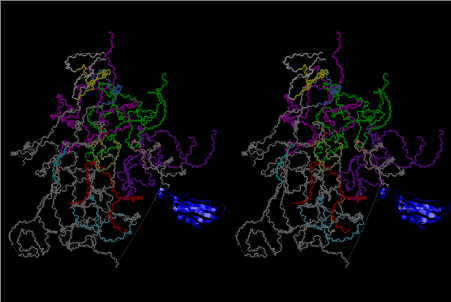
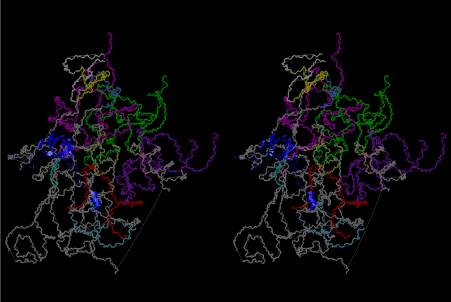
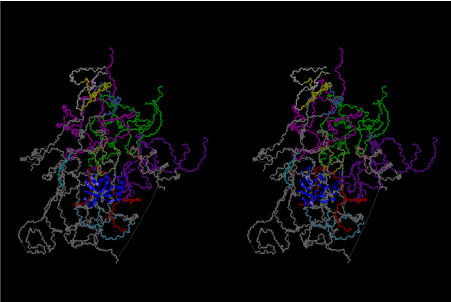
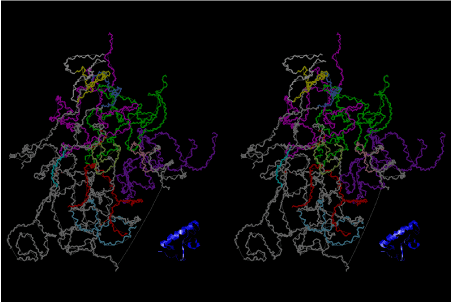
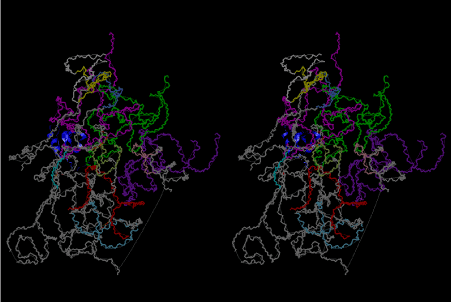
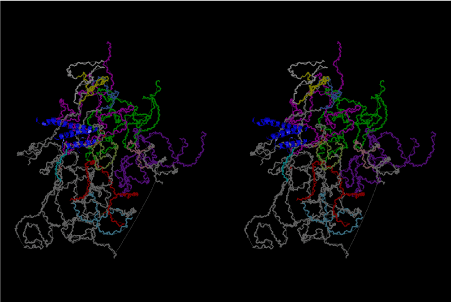
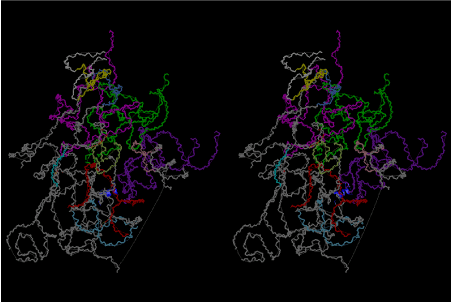
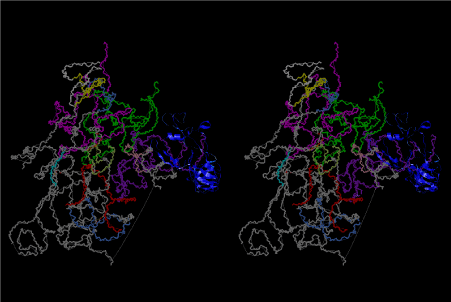
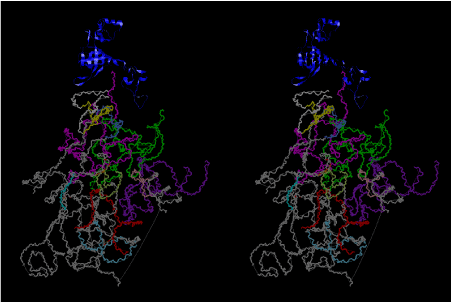
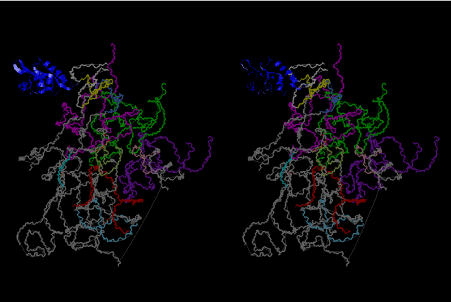
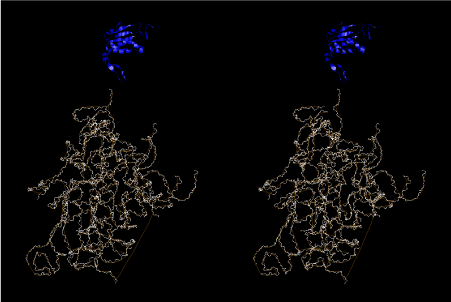
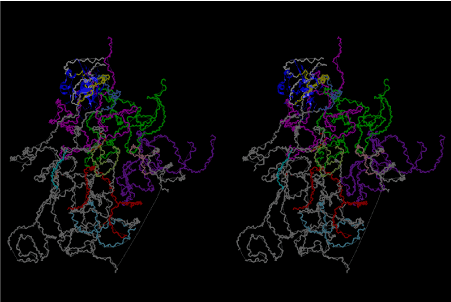
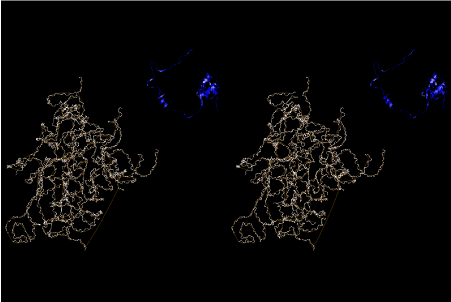
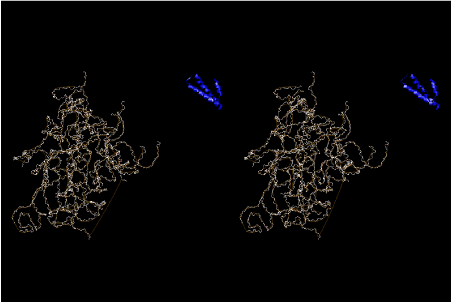
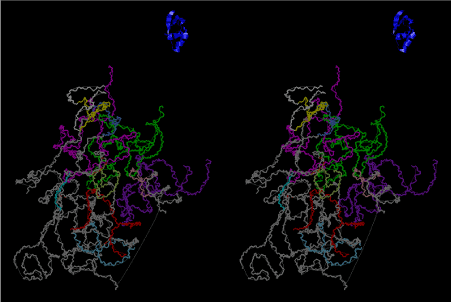
The layers of the 6-fold symmetrical left-handed helices of polyuridines cannot be estimated about their thickness. Their outside surface would have been in contact with hot water vapor. Accordingly, it would have been covered by a thick skin of layers rich in phospholipids just like a big cell membrane, below which another thick layer of methane hydrates, ammonia, D-, and L-amino acids, and the other components in a state of chaotic mixture. The movement of the outside skin area would be supposed to be so violent that any regular sophisticated structure such as anticodon loop could not have a chance to evolve. In contrast, another contact surface with mantle, which contain crystalline structures of silicate, metal oxides and also variety of concave and convex structure, would have fitted to grow a special structure of polyuridines. Figure 5 shows that an amino acid glycine, which is drawn in pink, bonded with its carboxyl end to 3’-end of polyuridine at its bottom region of the left-handed single-stranded helix. This is an ancestral form of transfer RNA (tRNA) and is going to polymerize with proline for further polymerization of L-amino acids. N-terminal end of glycine in pink is bonded to carboxyl end of proline in blue. This kind of stereo-specific chemical reaction could never have evolved on the outside surface in contact with hot water but was possible on the surface of silicates. Figure 6 also shows that the largest side chain of tryptophan among the essential 20 kinds of L-amino acids could be accommodated in this environment. As the temperature and the pressure gradually lowered at the bottom of the polyuridine layers in contact with the mantle rocks, the aminoacylation between 3’-end of uridine and the carboxyl end of amino acids became harder without a supply of energy transfer from the reaction of ATP to ADP + H3PO4. Figure 7 shows a similar state to that of Figure 8 but ATP not yet inserted, while Figure 8 such a change by inserting the structure of ATP between the transition state of dipeptide Gly-Pro bound at 3’-O of polyuridine terminus on the long helix in brown which is separated from the other part of long helix (just one turn) in yellow. The nucleotides in magenta is a part of anticodon loop of ordinary t-RNA from U31 to A39 (U-OMC-U-C-C-A-MIA-A-A), the anticodon of which is for Gly. It is, however, important to notice that polymerization of L-amino acids seems far more favorable than that of D-amino acids. Only one D-amino acid in a consecutive L-amino acid peptide could be involved, but does not seem favorable. Such a predilection for L-amino acids becomes much clearer in the ancestral form of amino acylation as shown in the following stereo pictures showing from glycine (Gly) in Figure 9 to tryptophan (Trp) in Figure 31. In these pictures O4 atom of U33 is not hydrogen-bonded to the phosphate oxygen of 35th position that is always the case for all crystallographic results of tRNAs [8]. It is known that U33 is highly conserved for all tRNAs. The anticodon loop holds in its crystal structure a magnesium ion in the pocket, but under a low magnesium concentration of 1 mMol, that is about the same as that of outside the cell, the loop behaves much more flexible than that of crystalline form [9]. This is one of the most important point in the evolution of life for capability of selection for all L-amino acids and glycine in its pocket. At this stage of evolution of life. The nucleotide at the 33th position might not have to be uridine, but U33 seems more favorable for performing a multifunctional role in translation [9].
At the periphery of the polyuridine layers condensation of amino acids with its carboxyl end to 3’-end of a terminal uridine promotes polymerization of small amino acids like glycine, alanine, serine, valine, threonine, and proline. The anticodon loop structure seems to have evolved spontaneously so that it could catch only L-amino acids. It can be seen that D-amino acids were very hard to be accommodated in the cavity of the anticodon loop. However, how the respective nucleotide sequence of the anticodons were favorable for the nominated amino acid by the chemical structure of the codons, such as, N6 of A, O6 and N2 of G, N4 of C, and O4 of U. Accordingly, there could be a lot of mistakes in selecting amino acid by the nucleotide combination of anticodon. In order to enhance the accuracy of amino acid selection by the combination of anticodon, we must wait a long time before evolution of aminoacyl tRNA synthethase as well as tRNA itself. As is well known, the length of tRNA has become evolved to about 76 nucleotides of clover-leaf shape. The total three-dimensional structure of tRNAs are referred to as the L-shaped form, the waist region of which is particularly important for amino acid type recognition. On the other hand, the evolution of aminoacyl tRNA synthethase seemed to have started to make a dimer of a couple of synthetase and tRNA. Because of the elongation of the distance between the 3’-end and the anticodon loop of a tRNA during the course of evolution, the 1 to 1 recognition of anticodon with its 3’-end of tRNA became more and more difficult, so that a pair-wise recognition of anticodon loop with its 3’ end of the partner tRNA might have been more easier to recognize. The evolution of aminoacyl-tRNA synthetase (aaRS) has led to two classes, Class I and Class II, [10,11] based on structural sequence features of the catalytic core. Each aaRS recognizes a single amino acid and attaches it to the 3’-end of a tRNA whose anticodon matches a codon for that amino acid. According to Ibba and Sӧll [12], however, there exists many exceptions to these rules, and many aaRS additionally rely on various proofreading or editing mechanisms to ensure the translation to the genetic code. In order to charge a tRNA, the amino acid must be first activated with ATP by the aaRS to form an aminoacyl-adenylate intermediate and then transferred onto the terminal adenosine of the tRNA [12].
After aminoacylation, two tRNAs are able to be arranged by a short sequence of nucleotides so that a dipeptide of Pro-Gly may be preferable for supporting the total structure of the system such as a part of aminoacyl tRNA synthetase. Figure 32 shows the simplest case of protein synthesis showing an ancestral form of mRNA and synthesized protein Pro-Gly. Accuracy of protein synthesis in accordance with the prescription of mRNA could be best for Gly and Pro at the first stage of evolution of life. As accuracy of aminoacylation is enhanced, a variety of peptide becomes ready for preparation by use of a special set of mRNA prepared for a necessity of growth of nucleotide layer. Since the number of L-amino acids was increasing, the cavity of the 6-fold symmetrical layer became a little too narrow, so that the next stage of more compact and a little wider in cavity might have been useful. Figures 33 and 34 show two stereo views of 6.5 fold symmetrical left-handed single-stranded polyuridine. In this case, there is no need of worrying about the short contact between the nucleotides of two nearest neighbors, and the stacking base distance is also all right. However, a lot of pyrophosphonucleotides and phospholipids are excluded. Figure 35 shows that a peptide composed of L-amino acids having rather small side chains such as Ala, Ser, Val, Pro and Gly can be accommodated inside the cavity of the left-handed helical cylinder, but those having large side chains could have a tendency to break the regularity. Arg residues in particular tends to disrupt the regular shape, particularly because the helical cylinder has a consecutive line of phosphate groups inside, resulting in a familiar shape of right-handed double-stranded polyuridine helices. Since such a role of Arg residues were so important, Arg occupies a comparably large part in the Table of the genetic code in comparison with that of Ser, if we are allowed to think that Gly, Ala, and Pro were comparatively important to the other amino acids in the earlier stage of evolution of L-amino acid proteins. Similarly, Leu and Val residues seem to have been more important in playing a role of making hydrophobic side of α–helices and β–sheets. The roles of Glu, Asp, His and Lys could have been evolving as players of catalytic activities. It is well known that some particular form of RNAs could have a catalytic activity [13-15]. However, there seems to be a handicap of flexibility in the 3D-structure of RNA, so that the evolution of proteins having Glu, Asp, His and Lys residues became more and more important during the course of the origin of life. Also, important to consider the double-stranded right-handed RNA helices, it is immediately related with the importance of the canonical G-C and A-U base pairs and G-U wobble base pair. The growing of double-stranded regions of RNA made it possible of the evolutions of tRNA, mRNA and ribosomes of both large and small subunits.
Evolution of ribosome
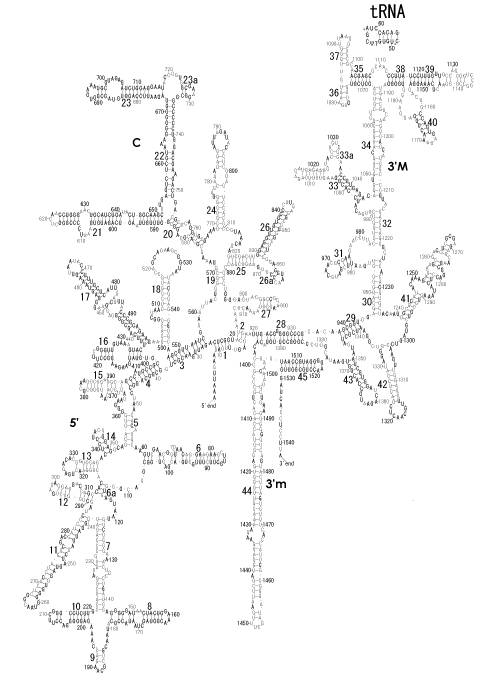
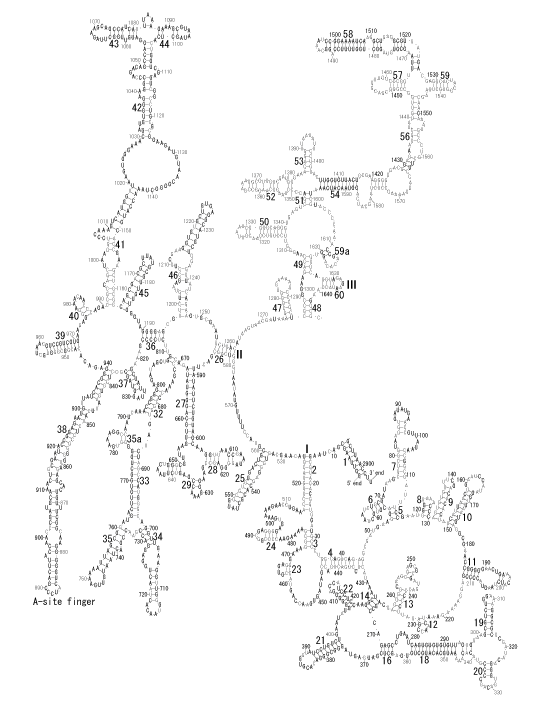
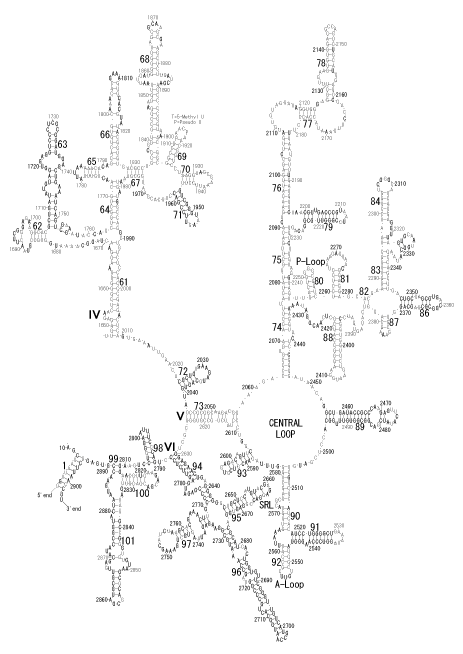
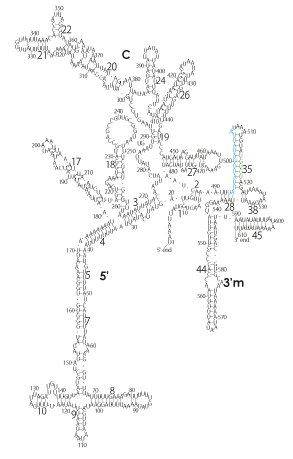
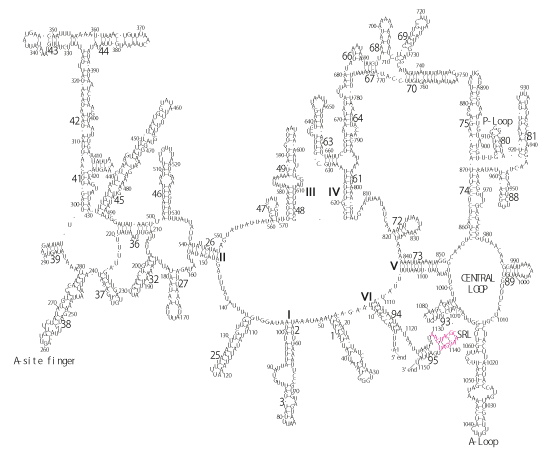
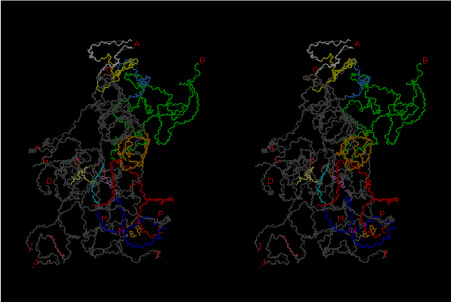
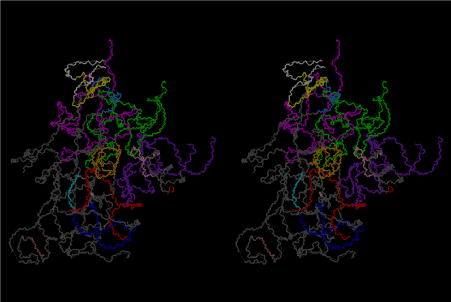
The significance of the ribosome in the origins of life consists in the movement of mRNA between two subunits of the large and small RNA fragments. At the beginning of the origin of life, when no protein factors such as elongation factors Tu and G as well as rRNA binding proteins existed, there was no energetical barriers between A and P sites, and also between P and E sites. Brownian motions of the conformational changes performed the translocation of the ancestral forms of tRNAs accompanying splitting and uniting of RNA fragments. On the other hand, the structures of the present-day ribosome are too big. Figure 36 shows the secondary structure of Esherichia coli 16S rRNA, which consists of 1542 nucleotides and 21 binding proteins, and Figures 37 and 38 show 5’-half and 3’-half of the secondary structures of E. coli 23S rRNA, which consist 2904 nucleotides and 30 binding proteins. There are 5 different families in the living organisms in the present world. Those are (a) Eubacteria, (b) Archaea, (c) Chloroplast, (d) Eukarya, and (e) Mitochondria. The secondary structures of 52 organisms in (a), 25 organisms in (b), 27 organisms in (c), and 44 organisms in (d), and 52 organisms in (e) were analyzed, and the references of those sequences were listed in Nagano and Nagano [7]. The analyses have shown that the simplest secondary structures of the ribosome are mitochondrial rRNAs of Trypanosoma brucei, 9S small subunit rRNA of which is shown in Figure 39, and 12S large subunit rRNA of which is shown in Figure 40 [7]. It is said that the smallest rRNA of mitochondrial protista Trypanosoma brucei is stabilized by binding comparatively more proteins. However, at the period of the ancestral ribosome, evolution of binding proteins is supposed to be immature, and so, the ribosome was supposed to stick to the silicate rocks at the bottom of the volcanic hot spring, where the concentration of alkaline metals including Mg2+ ions are relatively low [4], and temperature and pressure were very high. The Brownian motion of the ancestral ribosome were suppressed by the high pressure instead of binding proteins.
It has been known that the first step of codon-anticodon recognition only expels the ternary complex of noncognate aa-tRNAs with accuracy of about 200/10,000 [16]. The mechanism of kinetic proofreading at the step of GTP hydrolysis was proposed to expel the ternary complex of near-cognate aa-tRNA to enhance the accuracy up to 5/10,000 [17]. Here, the ternary complex denotes a complex of aa-tRNA, elongation factor Tu (EF Tu), and GTP. It was found, however, the accuracy is reduced by the used of high Mg2+ concentration [18]. Thompson, et al. [19] has observed that incorporation of near-cognate aa-tRNA into A site sharply increases from 6 mMol of Mg2+ concentration and reaches a plateau at 12 mMol Mg2+. The present author tries to explain how such a phenomenon could be realized on the 3D structure of the ribosome.
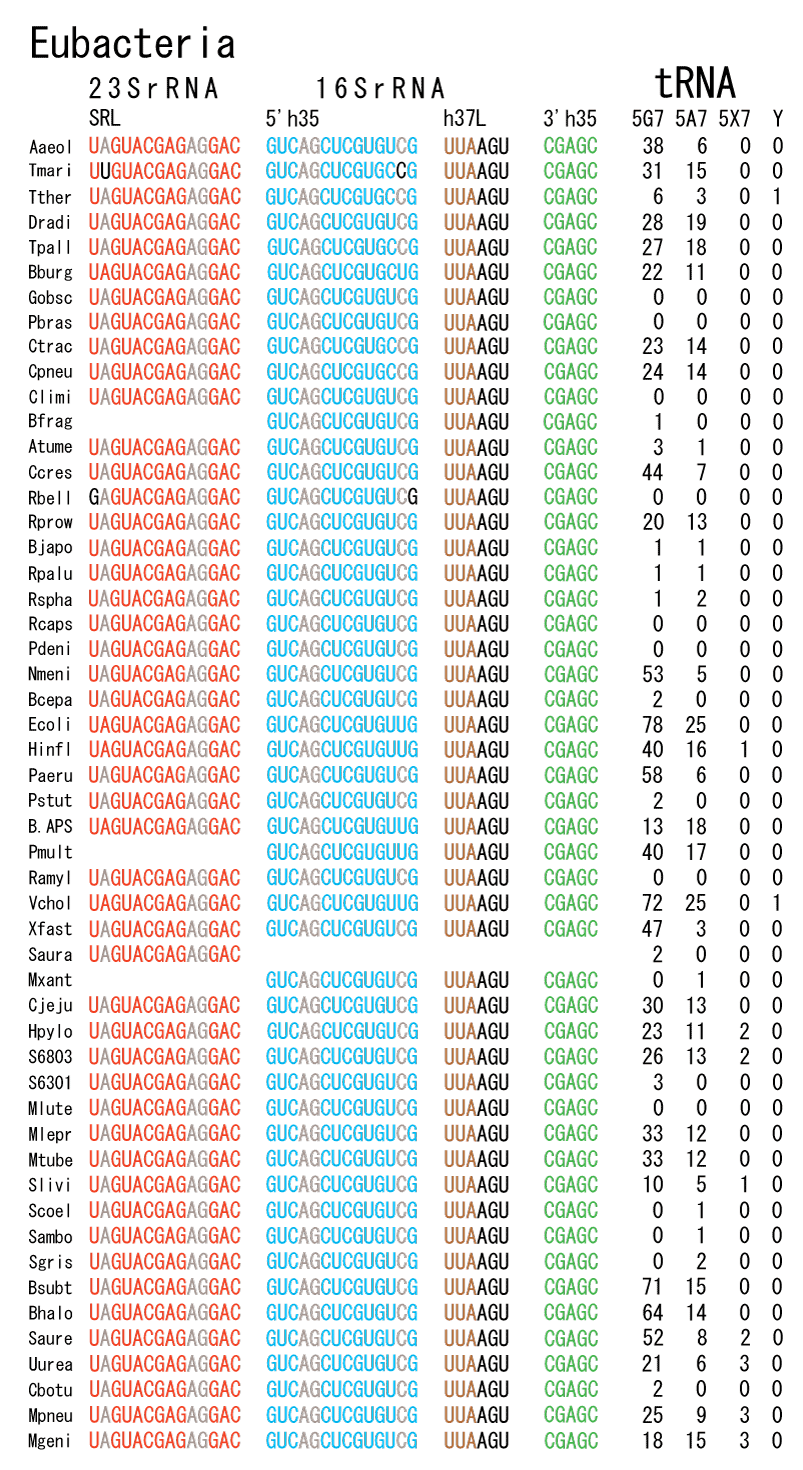
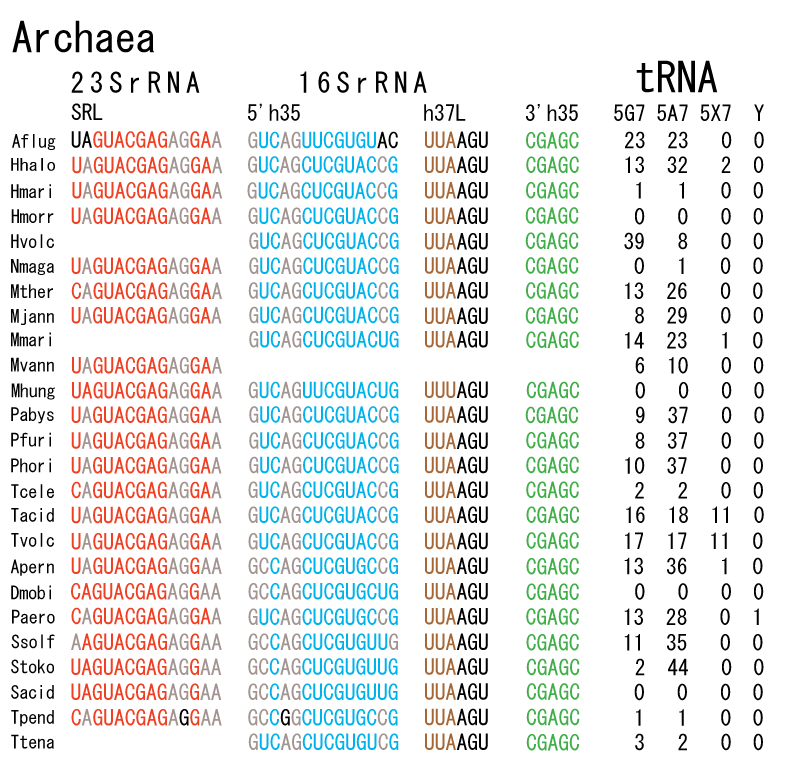
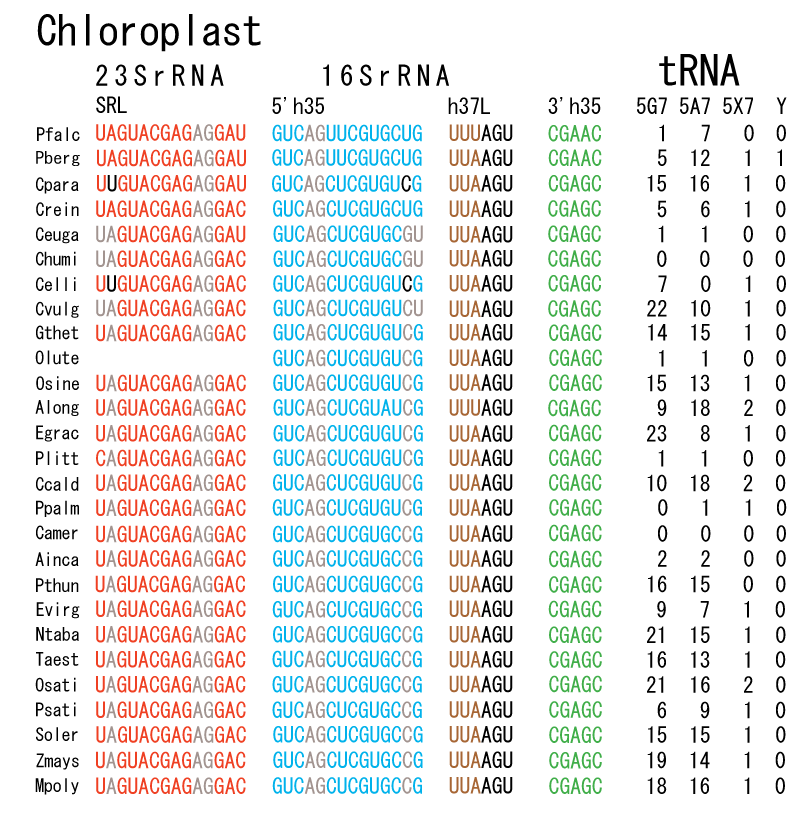
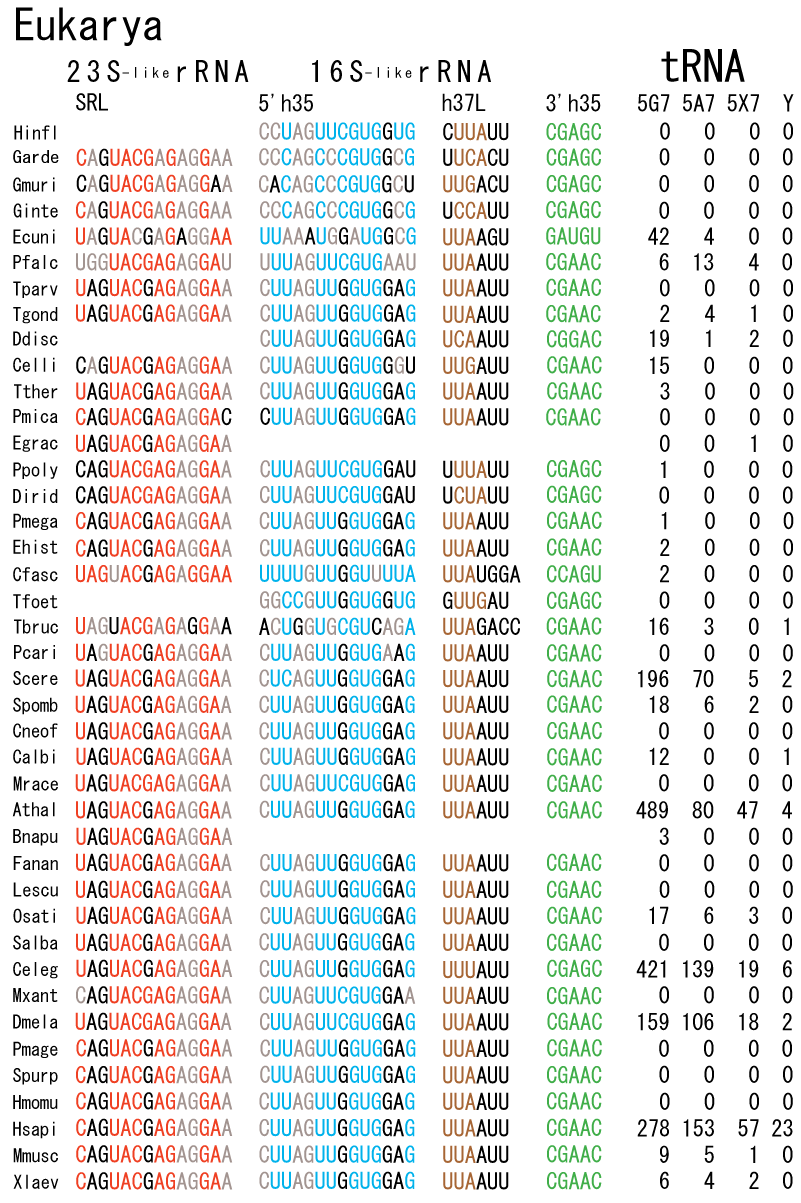
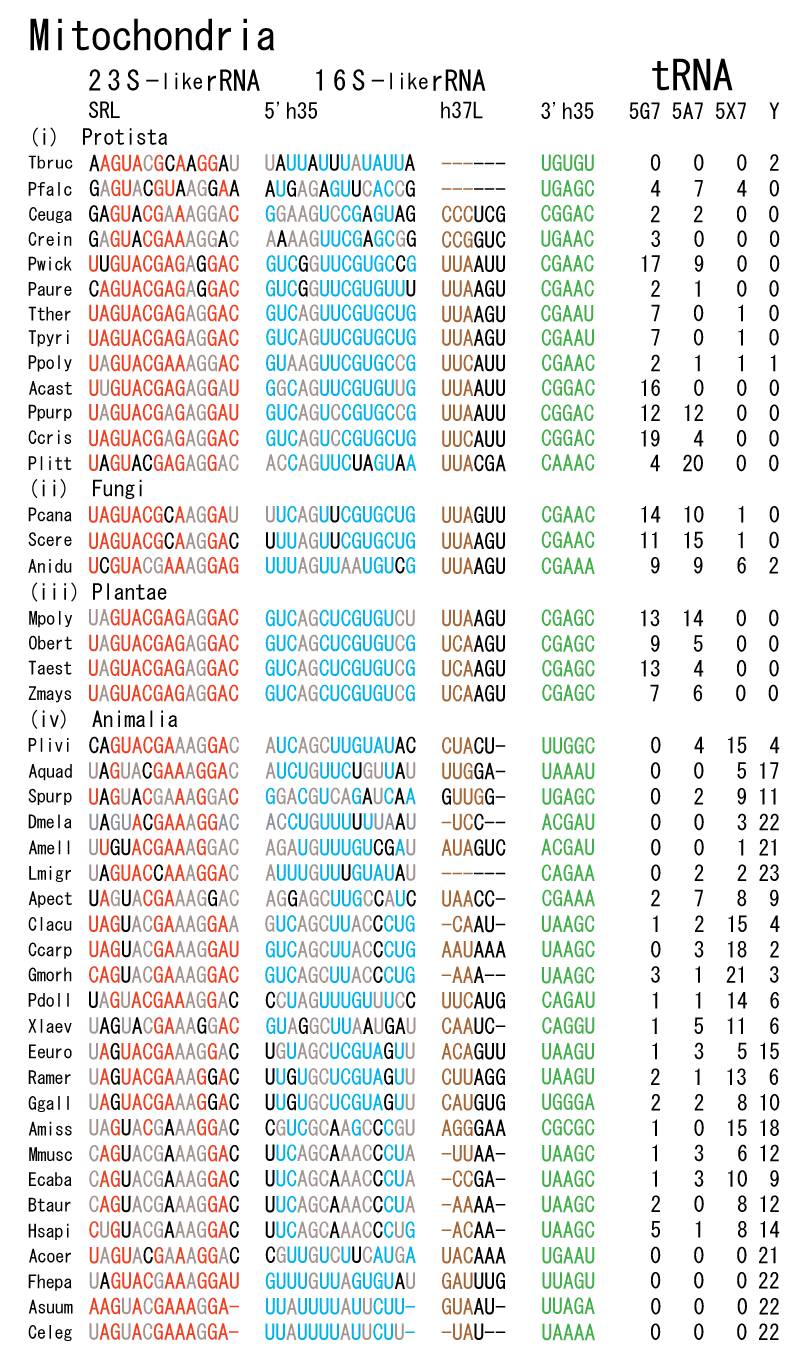
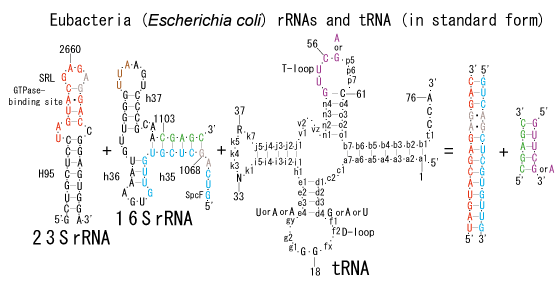
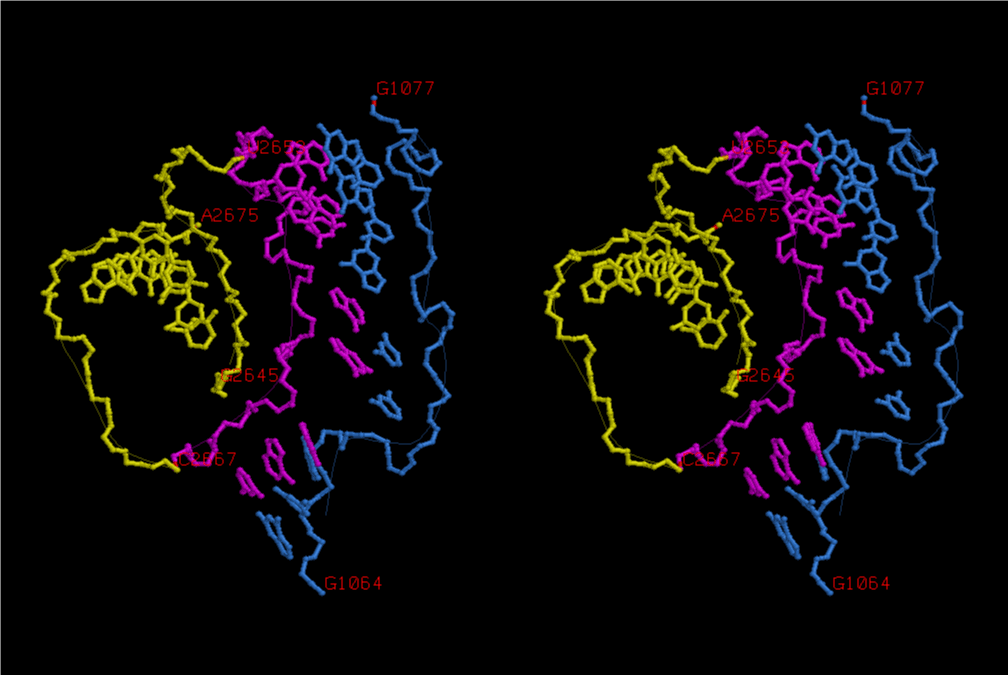
The 12 nucleotide sequence of 23S rRNA, AGUACGAGAGGA, is the longest universally conserved among all known rRNAs [20]. The present author has found that the region of nucleotides 1064-1077 of 16S rRNA in E. coli sequence is complementary with the region of nucleotides 2653-2666 of 23S rRNA, that is called sarcin-ricin loop (SRL) [7]. This relationship holds for all nucleotide sequences listed in the Figure 41 for Eubacteria, Figure 42 for Archaea, Figure 43 for Chloroplast, Figure 44 for Eukarya, and Figure 45 for Mitochondria. Since the region 2653-2666 of 23S rRNA is called GTPase binding site, and the nucleotides at the positions 1068-1073 of 16S rRNA constitute the 5’-side of secondary structure, helix 35 of 16S rRNA (h35), and those of 2653-2658 and 2663-2666 of 23S rRNA are the head region of helix 95 (H95), the relationship can be summarized as shown in Figure 46, in which SpcF denotes spectinomycin footprint site [21]. The residue number 2660 indicates the sequence of α–sarcin cleavage site [22]. The left-most structure in Figure 46 plays an important role in GTP hydrolysis, while another structure on the second from the rightmost side seemed to be that of transition state, but finally turned out to be the binding site of GTPase at the moment of GTP hydrolysis. Although such a long helix has been observed by neither X-ray analysis nor cryo-EM, a model building technique can show how it looks like, as shown in Figure47. The reason why some bases are unpaired in this model is that the corresponding nucleotides in Eukarya, as shown in Figure 44, are G-G unfavorable pairs.
U33-extended and U33-folded forms of the anticodon loop of tRNA
Uridine 33 at the 5’-side of the anticodon loop of tRNA is universally conserved except for cytidine 33 in some initiator formylmethionyl-tRNAs. The uridine base of U33 is folded inside the anticodon loop of tRNAs observed so far by X-ray crystallography, and hydrogen-bonded to a phosphate oxygen atom of 36th nucleotide of the anticodon [8]. This structure is referred to as U33-folded form in this article. This conformation of the codon-anticodon heix of U33-folded form does not seem stable enough. The U33 base can be expected to stick out or to be exposed if the conformation of the codon-anticodon helix assumes that of an ideal A-form RNA. Such a structure could be a little bit unstable because of the exposed U33 base compared to the hydrogen-bonded U33 base of the U33-folded form. And yet, the stability of the U33-extended form heavily depends on the stability of the codon-anticodon helix, and seems to play an important role in enhancing the accuracy of translation. The relative stability between the U33-folded and extended forms must also depend on the concentration of Mg2+ of the buffer solution used in the experiments. It is said that the Mg2+ concentration inside muscle cells is about 1 mMol that is about the same as that outside the cells. On the other hand, a Mg2+ concentration used for crystallization of whole ribosome is 10 mMol or much higher in some cases. The conformation of the anticodon loop of tRNAs in the living cell must be more dynamic. The difference in the positively charged ions between the living ribosomes and the ribosome crystals are mainly compensated by K+, if the environment of ribosomes are about the same as the muscle cells. A recent result of X-ray structure of the decoding site has shown that the G-U base pairs of near-cognate codon-anticodon interactions at the first position (between mRNA/Phe and tRNA2Leu) and at the second position (between mRNA/Cys and tRNATyr) cannot be discriminated from the cognate G-C and A-U base pairs, respectively [23]. The sharp increase of the near-cognate GTPase reaction between poly(U)-programmed ribosomes and Leu2 ternary complexes from 6 mMol to 12 mMol (Figure 1 [19]) strongly suggests that deprotonation of N3 and protonation of O4 of uridine base of G-U pair cannot be distinguished from G-C pair [23], and that the conformational change of the anticodon loops from the U33-extended to U33-folded form of the ribosomes do not discriminate the near-cognate Leu2-tRNA from the cognate Phe-tRNA. Figure 48 shows a different 3D structure for the near-cognate G-U pair at the first position of the codon-anticodon helix on the basis of the model building technique of the present work, in which the U33 base, which is drawn in magenta, sticks out from the anticodon loop, although a Mg2+ hexahydrate still binds between OP2 atom of YG37 and O2 atom of O2’ methylated OMC32. The U33-extended form of the anticodon loop would destabilize the loop structure. Besides, deprotonation from N1-H of guanine base and N3-H of uridine base resulting in the movement of the proton to the O4 atom of the uridine base might be preferable under the Mg2+ excess conditions. Figure 1 of Demeshkina, et al. [23] also shows that P/A-kink of the mRNA is widely open as the kinks obtained by the other X-ray structures of the ribosomes [24,25] and supported by binding two clusters of Mg2+ hexahydrate. On the other hand, Nagano (2015) demonstrated a different type of P/A- and E/P-kinks, as shown in Figure 49, each of which is supported by one cluster of Mg2+ hexahydrate. The difference of the kink structures of Nagano [9] from those in the X-ray structures can be rationalized on the basis of the low Mg2+ concentration described above. In contrast to Figure 48, Figures 50 and 51 show the structural difference in the A-site codon-anticodon helix between the cognate case in Figure 50 and the near-cognate case in Figure 51. In these two structures, the bases of both U33 and OMC32 as well as YG37 are exposed in order to represent a delicate difference between the cognate and near-cognate codon-anticodon helices. As a result of the difference, a Mg2+ hexahydrate between OP2 atom of YG37 and O2 atom of OMC32 is expelled, giving rise to a slight difference in the interactions between the bases of U33 and A1396. The interactions of A1492 and A1493 to the minor groove of the codon-anticodon helix can be achieved almost the same as those in the X-ray structures [23], but the interaction of G530 is rather difficult without a conformational change in the 530 loop due to the big conformational change in the anticodon stem-loop (ASL) structure as well as the big shift in the location of h45, which will be described later. The near-cognate G-U base pair at the first bases of the A-site codon in Figure 51 is quite the same as that of Figure 48, but resulting in a delicate but recognizable difference from the cognate case in Figure 50, while the structure shown in Figure 48 cannot be achieved because of its big structural difference from the corresponding one in Demeshkina, et al. [23].
The exposed base of U33 in the U33-extended form is supposed to be supported by base-pairing with a certain universally conserved adenine base at the decoding site of 16S rRNA, the secondary structure of which is shown in Figure 36. Such base pairs are long-range interactions in contrast to the hydrogen-bonded U33 base inside the anticodon loop so far observed in X-ray structures. Accordingly, a transition between U33-folded and U33-extended forms would be more frequent in the physiological condition of the Mg2+ concentration. Although the G-C pair between C1399 and G1504 has been predicted [14,15] because of its high conservation, it was not confirmed in the crystal structure of 2HGR (accession number in PDB database [26]). On the other hand, G1401-C1501 pair as well as the base stacking of C1400 to the first base of the anticodon of P-site tRNA [27] was confirmed. It has been known that both adenines and cytidines in the decoding site are universally conserved. Accordingly, it was quite natural to think that U33 base of the U33-extended form of P-site tRNA could be base-paired with A1398. It necessarily leads to the assignment of A1396 to the base-pairing partner of the U33-extended form of aa-tRNA at the recognition mode of A site (T site). It seemed possible for either A1502 or A1503 with U33 of the U33-extended form of deacylated tRNA at the E site. The result of the model building of Nagano (2015) has shown that A1502 is most favorable, while A1503 seems a little too far from the U33 of E-site tRNA.
A-P and P-E tRNA docking pairs in the pre- and post-translocational states
The universal rule of nucleotide sequence complementarities (Figure 46) was first noticed by a finding that oligonucleotide fragments such as TѰCG or UUCG inhibited the binding of aa-tRNA at the A site [28]. It was found that such a highly conserved sequence exists on the 3’-side of h35 of 16S rRNA, and that the other side of h35 is complementary to the conserved loophead sequence of SRL in 23S rRNA [29]. In addition to the above finding, it was also found that various tRNA fragments containing D-loop inhibited aa-tRNA binding at the A site [28]. This strongly suggested that the T-loop of aa-tRNA making base-pairs with the 3’-side of h35 and the D-loop of aa-tRNA making base-pairs with the T-loop of P-site tRNA are an essential necessary requirement for the aa-tRNA entering the A site. It is also important to note that there exists a pair of highly conserved guanines at the almost all tRNAs (although their relative locations are slightly different from one another), while that the highly-conserved cytidine residues in T-loop of tRNAs are C56 and C61. (However, there exists an exceptional case in human mitochondrial Ser-tRNA missing totally its D-loop. How we can interpret its translational movement? That is an important question.) In contrast to the X-ray structure of the elbow region of the isolated L-form tRNA, in which G19 is paired with C56 as a Watson-Crick type, but G18 is hydrogen-bonded to Ѱ55 in an irregular fashion [8], the universally conserved guanines, G18 and G19, of aa-tRNA at the T site are base-paired with the other universally conserved cytidines, C56 and C61, of P-site tRNA, respectively, and also G18 and G19 of P-site tRNA with C56 and C61 of E-site tRNA, respectively. Such a big difference in the shape of tRNA between the isolated L-form of X-ray structure [8,21,26] and the docking model of Nagano et al. [29] as well as Nagano [9] comes from a big difference in the Mg2+ concentration, as mentioned above.
The results of X-ray structures of the whole ribosome have shown that two conserved regions of 16S rRNA, the ridge containing G1338 and A1339 near h29 and the head of 790 loop, constitute barriers that block a translocational movement of P-site bound tRNA toward E site, if we assume that such a movement is just a simple-minded translation from the crystallographic P site to the crystallographic E site. Transition from the X-ray structure to the predicted one of Nagano [9] would start from the U33-extended form of aa-tRNA by interaction between U33 (aa-tRNA) and A1396, which is exposed on the X-ray structure, as well as the base-pairing of GTѰCG (or GTѰCA) of aa-tRNA with CGAGC1107. The effector region in the body of elongation factors, both EF-Tu and EG-G, would collide with the long helix composed of h30, h32, and h34 [14,15], resulting in accomplishment of the long-range interactions between the SRL-region of 23S rRNA and the 5’-side of h35 of 16S rRNA. Under the condition of fixing the location of A76 of both P- and E-site tRNAs, the U33-extended forms make the distance between G18 (P-tRNA) and C56 (E-tRNA) shorter and C56 (P-tRNA) closer to G18 (aa-tRNA), and, the twisting makes splitting ofD-loop from T-loop for both P- and E-site tRNAs at their respective elbow regions. Such a conformational change for both P- and E-site tRNAs allows base-pairing between G18 (aa-tRNA) and C56 (P-tRNA) and between G18 (P-tRNA) and C56 (E-tRNA), and successively, G-C pairs between G19 (aa-tRNA) and C61 (P-tRNA) and between G19 (P-tRNA) and C61 (E-tRNA), respectively. Thus, the A-P-E tRNA docking triplet form can be completed, and finally accomplishes the codon-anticodon helix at the E site. This is a series of conformational changes after unfolding of h35 by the collision with the body of elongation factors, EF-Tu and EF-G, ending up with formation of the codon-anticodon helix at the E site.
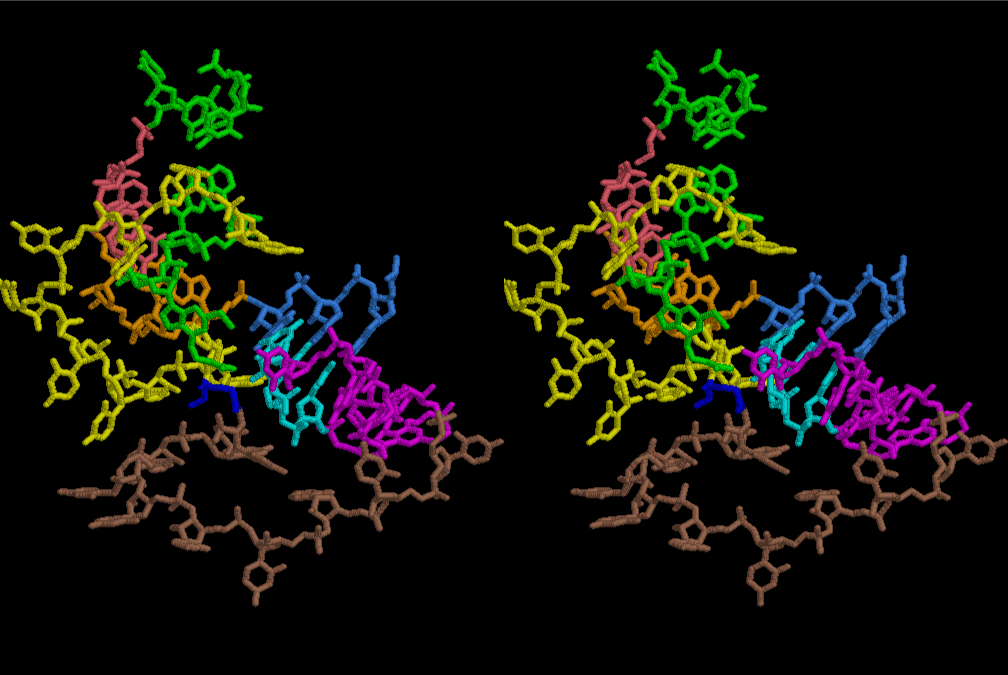
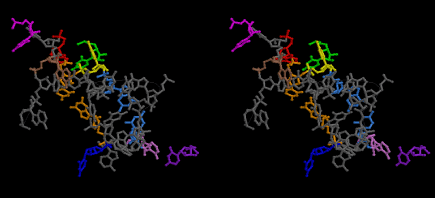
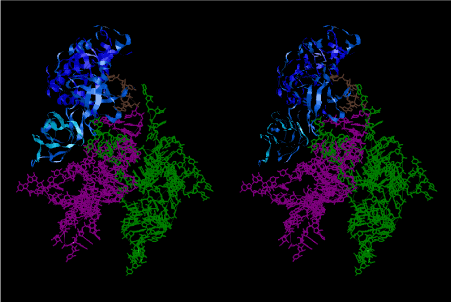
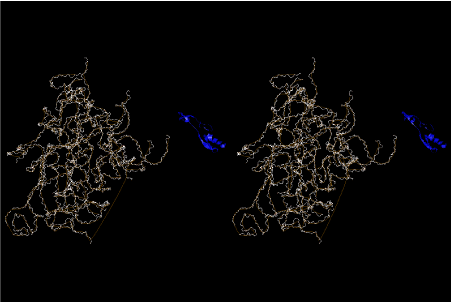
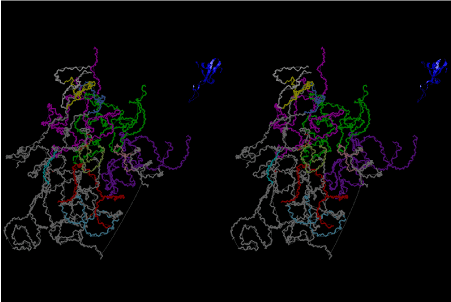
Figure 52 shows that U33 at the P site (green) is base-paired with A1398 (red), U33 at the E site (purple) is base-paired with A1502 (pink), but U33 at the A site (magenta) is not base-paired with A1396 (brown). C1399-G1504 pair is formed and shown in gold. Figure 53 shows that U33 at the P site (green) is base-paired with A1398 (red), U33 at the A site (magenta) base-paired with A1396 (brown), but U33 at the E site (purple) is not base-paired with A1502 (pink). C1399-G1504 pair (gold) is formed. On the other hand, Figure 54 shows that all three U33 at the A, P and E sites, (magenta, green, and purple, respectively), are base-paired with A1396 (brown), A1398 (red), and A1502 (pink), respectively, at the expense of separation of the bases of C1399 and G1504 (gold). Since both tRNAs at the P and E sites are cognate, in contrast to the case of X-ray structure, aa-tRNA at the T site would take a transition-state conformation, as shown in Figure 54, if it is also cognate. During fluctuation of the whole structure, both residues, C1399 and G1504, would become close enough to base-pair, as they are not so far separated. Then, A-U base pair of either A site or E site is broken. Which A-U pair is broken depends on the stability of the codon-anticodon helices at the A and E sites, since the distance between the U33 base and C1400 base, for example, would become larger in the case of less stable anticodon loop. From this reason, both noncognate (before GTP hydrolysis) and near-cognate aa-tRNA (at the step of GTP hydrolysis) are rejected, while only cognate one (after GTP hydrolysis) can enter the A site to expel the deacylated tRNA at the E site from the ribosome. This would be a reasonable explanation of the mechanism of translation concerning how high accuracy could be achieved at the decoding site.
When the region of U2653-C2666 of 23S rRNA (magenta) including the SRL is bound together with the region of G1064-G1077 of 16S rRNA (skyblue), the conformation of which is shown in Figure 47, the region of 16S rRNA is extended from the main part of 30S subunit. In order to achieve such a long-range base-pairing interactions, it is essential that the long helix composed of h30, h32 and h34 of 16S rRNA should have bends of a considerable degree around the regions between h32 and h34 as well as between h30 and h32. It necessarily causes a big deviation of the barrier, G1338 and A1339, toward the joint region of h32 and h34 from its original position, and the location of h45 is changed very much. As a result, the universally conserved dimethylated adenines, Am21519 and Am21520, at the loop of h45 makes a contact with the downstream of mRNA. This result can explain why those residues are dimethylated, while the X-ray structure, 2HGR [26] cannot. A1396 approaches the U33 base of aa-tRNA, while h44 of 16S rRNA makes a contact at the inner groove of A-site codon, with universally conserved A1492 and A1493 [30]. When U33 of the A-site tRNA is base-paired with A1396 and U33 of the E-site tRNA is not base-paired with A1502, as shown in Figure 53, the deacylated tRNA at the E site (purple) in the three tRNA binding structure changes its conformation from the U33-extended and docking with P-site tRNA state to the U33-folded and isolated form. Then, the deacylated tRNA leaves the ribosome in the direction of L1 stalk. When the conformations of nucleotides at the decoding site are such as those in Figure 52, what would happen to the T site? When the aa-tRNA is noncognate, the base-pair of the codon-anticodon helix would not be formed without need of U33-A1396 base-pair formation. In the case of either near-cognate or cognate, the codon-anticodon helix could become an ideal A-form, and the help of U33-A1396 would be very important at the step of GTP hydrolysis. After fluctuation of the conformations at the decoding site between those as in Figures 54 and 52, the helix at the T site would be broken, if the one at the E site is a little stronger. Then, the conformation of the aa-tRNA would become a U33-folded form with its isolated L-form elbow region, and leaves the ribosome in the direction of L7/L12 stalk. At the instant, the conformation of the A-site codon would loosen, and become ready for accepting the next anticodon of aa-tRNA as a ternary complex, that would have probably been waiting for opening the A-site codon by using the 3’-side of h35 and A1394. A1394 is also highly conserved, although it is less conserved than A1396 and A1398.
Translocation as a rotational movement of A-P tRNA docking pair to P-E pair
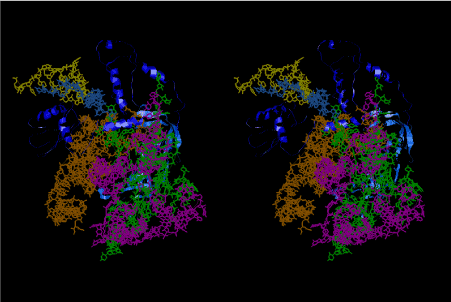
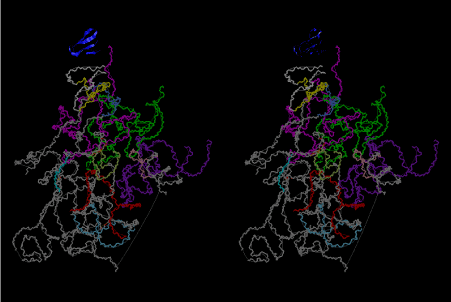
The inhibition of spectinomycin on the EF-G-dependent translocation has been noticed long time ago [31,32]. In addition to the above, Peske et al. [33] have concluded that EF-G produces conformational rearrangements on the ribosome in the vicinity of the decoding region on the 30S subunit and that spectinomycin has a direct inhibitory effect on tRNA-mRNA movement, that is quite consistent with the basic assumptions of the present work. Comparison of Figure 56 with Figures 57 and 58 suggests that translocation is not a translational movement of tRNAs from the crystallographically obtained P site to the E site but a rotational one around an axis that is close to both A- and E-site tRNAs. If the aminoacyl group remains at the A site and the P-site tRNA is still peptidylated, translocation would not occur because of locking at the P site [34]. Peptidyl transferase reaction results in peptidyl-tRNA at the A site and deacylated tRNA at the P site, the state of which automatically brings about P and E sites on the 50S subunit. This is due to a rotational freedom around the hinge between H14 and H22 (nucleotides AA423) and a rigid binding of two helices, H22 and H88 at a pseudoknot CCAU416/AUGG2410 of 23S rRNA. C2394 and G2421 at the base of H88, which is empty as a result of the process shown in Figure 57, could turn to catch the adenine base of the CCA end of deacylated tRNA at the P site [35]. According to chemical modification experiments, 2’-hydroxyl groups of the nucleotides 71 and 76 of the deacylated P-site tRNA can be recognized by nucleotide C1892 in the minor groove of H68 and A2433 and A2434 at the base of H74 of 23S rRNA, respectively [36]. Those residues also constitute part of the E site on the 50S subunit. It would expel the P-loop at the loop of H80 as well as A2450 and its associated nucleotides of the central loop of 50S subunit from the CCA end of P-site tRNA, that is the P site on the 50S subunit, and transfer them to the CCA end of the neighboring A-site tRNA. These are what we call P/E and A/P hybrid states. Such a transition would not occur if either the 3’-end of P-site tRNA is peptidylated or some of the above key nucleotides are chemically modified. This could be an explanation as to why peptidyl-tRNA bound to the P site locks ribosomal functions such as translocation, termination, and recycling [34]. Figure 59 shows that the foot of H88 (cyan), where C2395 and C2421 are situated, reaches the adenine base of P-site tRNA (green), while the P-loop of H80 (red) catches the bases of C74 and C75 of A-site tRNA (magenta). This is the 3D structural representation of the 3’-end of tRNAs at the A/P and P/E hybrid states. When EF-G·GTP complex comes to occupy the space of A-site tRNA, the A-P tRNA docking pair rotates around the axis passing closer to the A-, P- and E-site tRNAs to reach the site of P-E tRNA docking pair at the classical P/P and E/E states. The 3D structural representation of them can be shown as in Figure 60.
How elongation factors work on the present models to produce GTP hydrolysis?
The recent result of the crystal structure of the ribosome bound to EF-Tu and aa-tRNA [37] does not seem to fully explain the mechanism of accommodation of aa-tRNA into A site. Starting from the tRNA structure in magenta in Figure 58, which is either leaving the ribosome or entering the ribosome as a ternary complex with EF-Tu·GTP, its 3’-end region was modified by transplanting 3’-end region of Trp-tRNATrp along with EF-Tu and GDP bound to a cognate codon on the 70S ribosome 2Y18 [38]. GDP structure was changed to GTP by adding Pγ phosphate. The conformation of EF-Tu was changed so that the Pγ atom comes closer to N6 atom of A2660 and Pβ atom closer to N4 atom of C2658. Pγ and Pβ atoms are covered by the region of amino acid residues 20-26 (VDHGKTT) in EF-Tu. The G base of GTP moiety is hydrogen bonded to U2656, while the O3’ and O2’ atoms on its ribose ring are hydrogen-bonded to N6 atom of A2657 and O6 atom of G1074 of 16S rRNA, respectively. Such a local structure of GTP binding to the present model at the interface of RSL of 23S rRNA and the 5’-half of h35 of 16S rRNA on the ribosome structure is shown in Figure 61 [9].
Inspection of this local structure suggests that GTP hydrolysis could occur when the region of EF-Tu with GTP moves in the direction from N4 atom of C2658 to N6 atom of A2660 in contrast to the movement vertical to the above. When the distance between the N4 and N6 atoms becomes larger accompanying the Pβ and Pγ atoms, respectively, NH2 group of the N2 position of G2659 attacks the Pβ-Pγ bond. The total structure of EF-Tu with the related regions of T- and P-site tRNAs is shown in Figure 62. After GTP hydrolysis in the structure shown in Figure 62, the conformation of EF-Tu returns to the original one observed in the crystal structure of the ribosome bound to EF-Tu and Trp-tRNATrp 2Y18 [38]. Such a structure is shown in Figure 63. The EF-Tu molecule would leave the ribosome soon under the normal condition of low Mg2+ concentration. The conformation of the A-site tRNA is the same as those shown in Figures 56 and 57. Since the binding of A-site tRNA very close to P-site tRNA, the location of which is almost the same as the other structures shown in Figures 55 to 58, the cavity between the SRL region and P-site tRNA becomes a little wider, where EF-G is supposed to bind. The structure of tRNA in gold, as shown in Figure 64, is a putative ancestral form of EF-G, in which the tRNA-like body in gold represents the domain IV of EF-G [39], while the other part represents the rest of the whole structure of EF-Tu. If the conformational change in the part of EF-Tu occurs after GTP hydrolysis, the structure very much like the one shown in Figure 62 would be obtained. Because the exposed form of the domain IV of EF-G, or the tRNA moiety in gold, would be very unstable, the structure would become immediately the same as that in Figure 63 after translocation. This is exactly what happened in the crystal structure of the ribosome shortly after binding of EF-G [40]. The reason why EF-G dependent translocation is inhibited by binding of spectinomycin [31-33] can be explained very clearly as the result of missing the contribution from the 5’-half of h35 in the mechanism of GTP hydrolysis shown in Figure 61. In contrast to the EF-G dependent translocation, the A-site tRNA accommodation catalyzed by EF-Tu does not seem to be affected by spectinomycin. The reason for this would be that the region of CGAGC1107 on the 3’-half of h35 is unfolded by interaction with the GTѰCG region of T-loop of aa-tRNA, or could be due to a slight difference in the distance between Pγatom and 3’-end of P-site tRNA (27 Å). GTP hydrolysis results in a big conformational change in EF-Tu with a right hand (amino acid sequence from Ala1 to Arg190) pushing the GTPase-binding site and with a left hand (from Gly191 to Glu405) pulling the whole body of P-site tRNA. The final shape of A-site tRNA is just like a sitting-up of the T-site tRNA. On the other hand, GTP hydrolysis in translocation by means of EF-G produces a little different result from that of EF-Tu. This could be due to a slight difference in amino acid sequence between EF-Tu and EF-G (one amino acid insertion) and result in a different rotational movement with EF-G’s left hand pushing the whole body of A-site tRNA toward P-site tRNA and with its right hand pushing the GTPase-binding site to break the long helix made by the SRL region of 23S rRNA and 5’-side of h35 of 16S rRNA. The big distortion introduced by formation of the GTPase-binding site is cancelled and returns to the original state. This movement of the whole ribosome represents exactly where the driving force of the ratchet-like movement of the ribosome [41] comes from.
Evolution of ribosomal binding proteins and protein factors
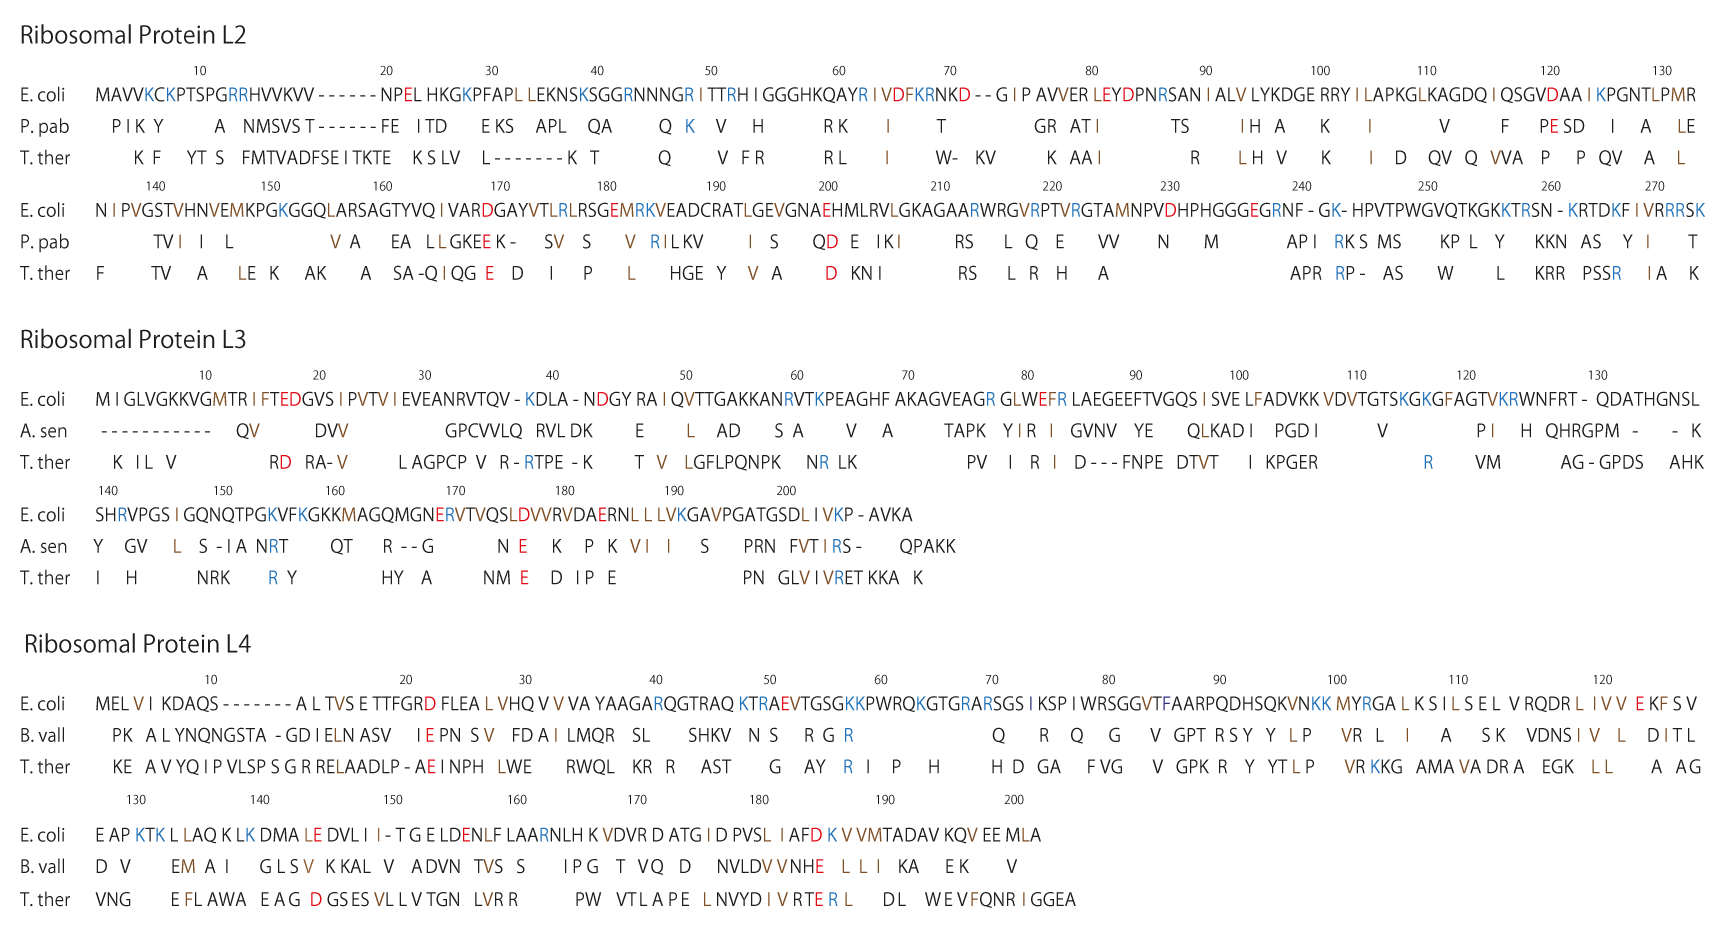
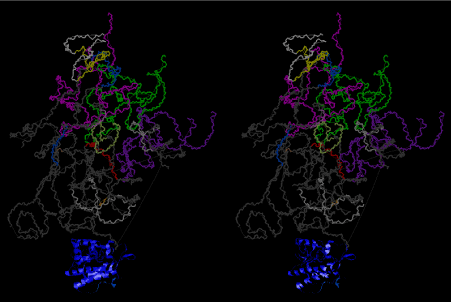
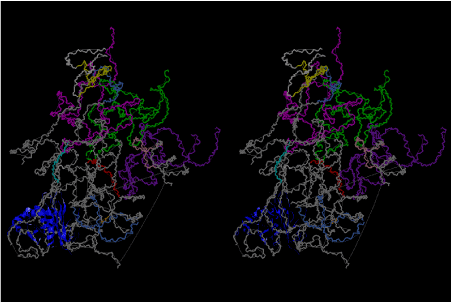
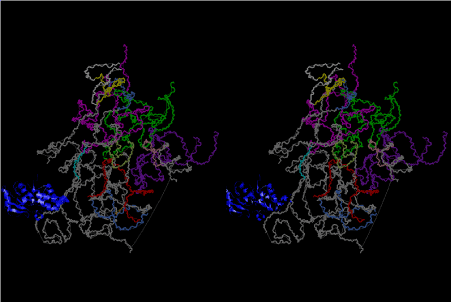
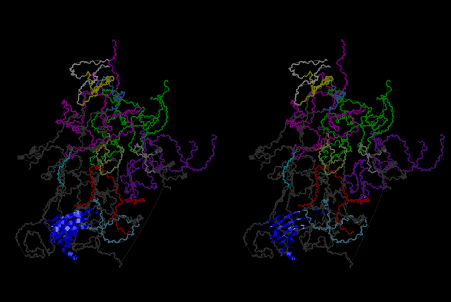
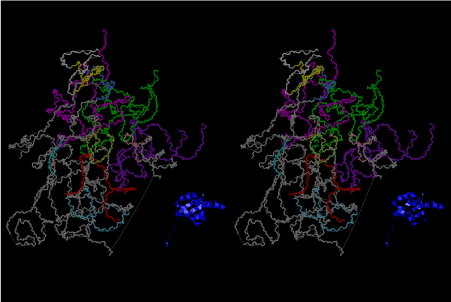
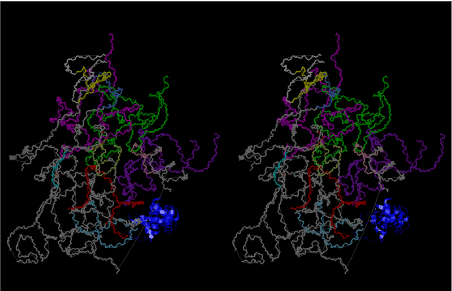
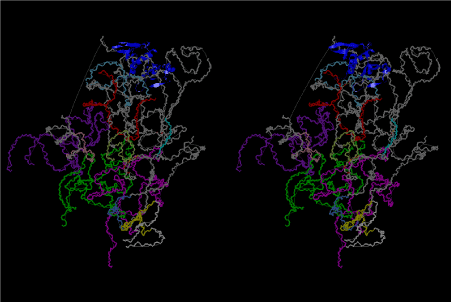
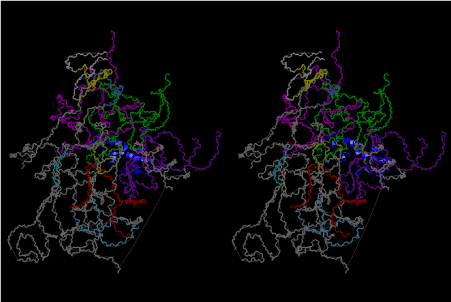
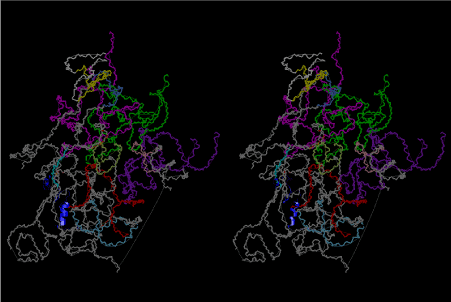
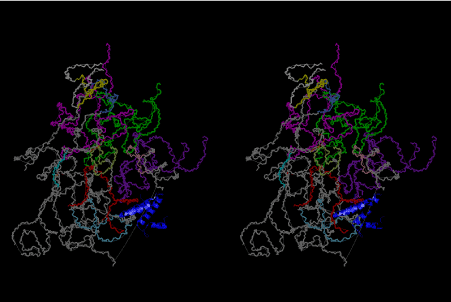
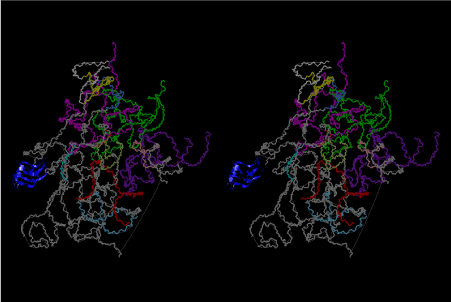
During the course of evolution of ribosome, various ribosomal binding proteins have also pursued their structural evolutions by changing their amino acid sequences. The present author has been carrying a question as to what type of amino acid sequence can selectively recognize their responsible locations on the 16S and 23S rRNAs. The number of ribosomal proteins is found to range between 50 – 60 in bacterial ribosomes and 70 – 80 in cytoplasmic ribosomes of eukaryotes [42]. In E. coli there are 21 small-subunit ribosomal proteins and 32 individual large-subunit ribosomal proteins [42]. Using large subunit ribosomal proteins and ribosome (50S) from E. coli, Nierhaus performed the analysis on the stepwise assembly of 50S ribosome by reconstitution [43]. Nierhaus’s 50S assembly diagram shows that large subunit ribosomal proteins, L2, L3, and L4, recognizes somewhere on the 23S rRNA sequence around 1500, 2200 and 650, respectively. Figure 65 shows that L2 from E. coli has a considerable sequence homology with those from Paenibacillus pabuli (P. pab) and Thermus thermophillus (T. ther), L3 from E. coli with those from Alicyclobacillus sendaiensis (A. sen) and T. ther, and L4 from E. coli with those from Bacillus vallisimortis (B. vall) and T. ther. The three-dimensional atomic models of the present article are based on the Cartesian coordinates of Korosterev et al. [26] (PDB accession numbers are 2HGR for small subunit and 2HGU for large subunit). The locations of all ribosomal proteins for both 16S and 23S subunits are shown on the atomic models of the present work as from Figures 66 to 111. If we compare the sequence comparison of L2, L3 and L4, as shown in Figure 65 with the atomic coordinates of 23S rRNA and those of L2, L3 and L4, we might be able to obtain something about the idea about the strength of the interactions between peptide structure and rRNA structure. In that case the result of the analysis of step-wise reconstitution of 50S subunit [43] will give us a lot of information about the protein-rRNA and protein-protein interactions. Such an analysis has not been done yet.
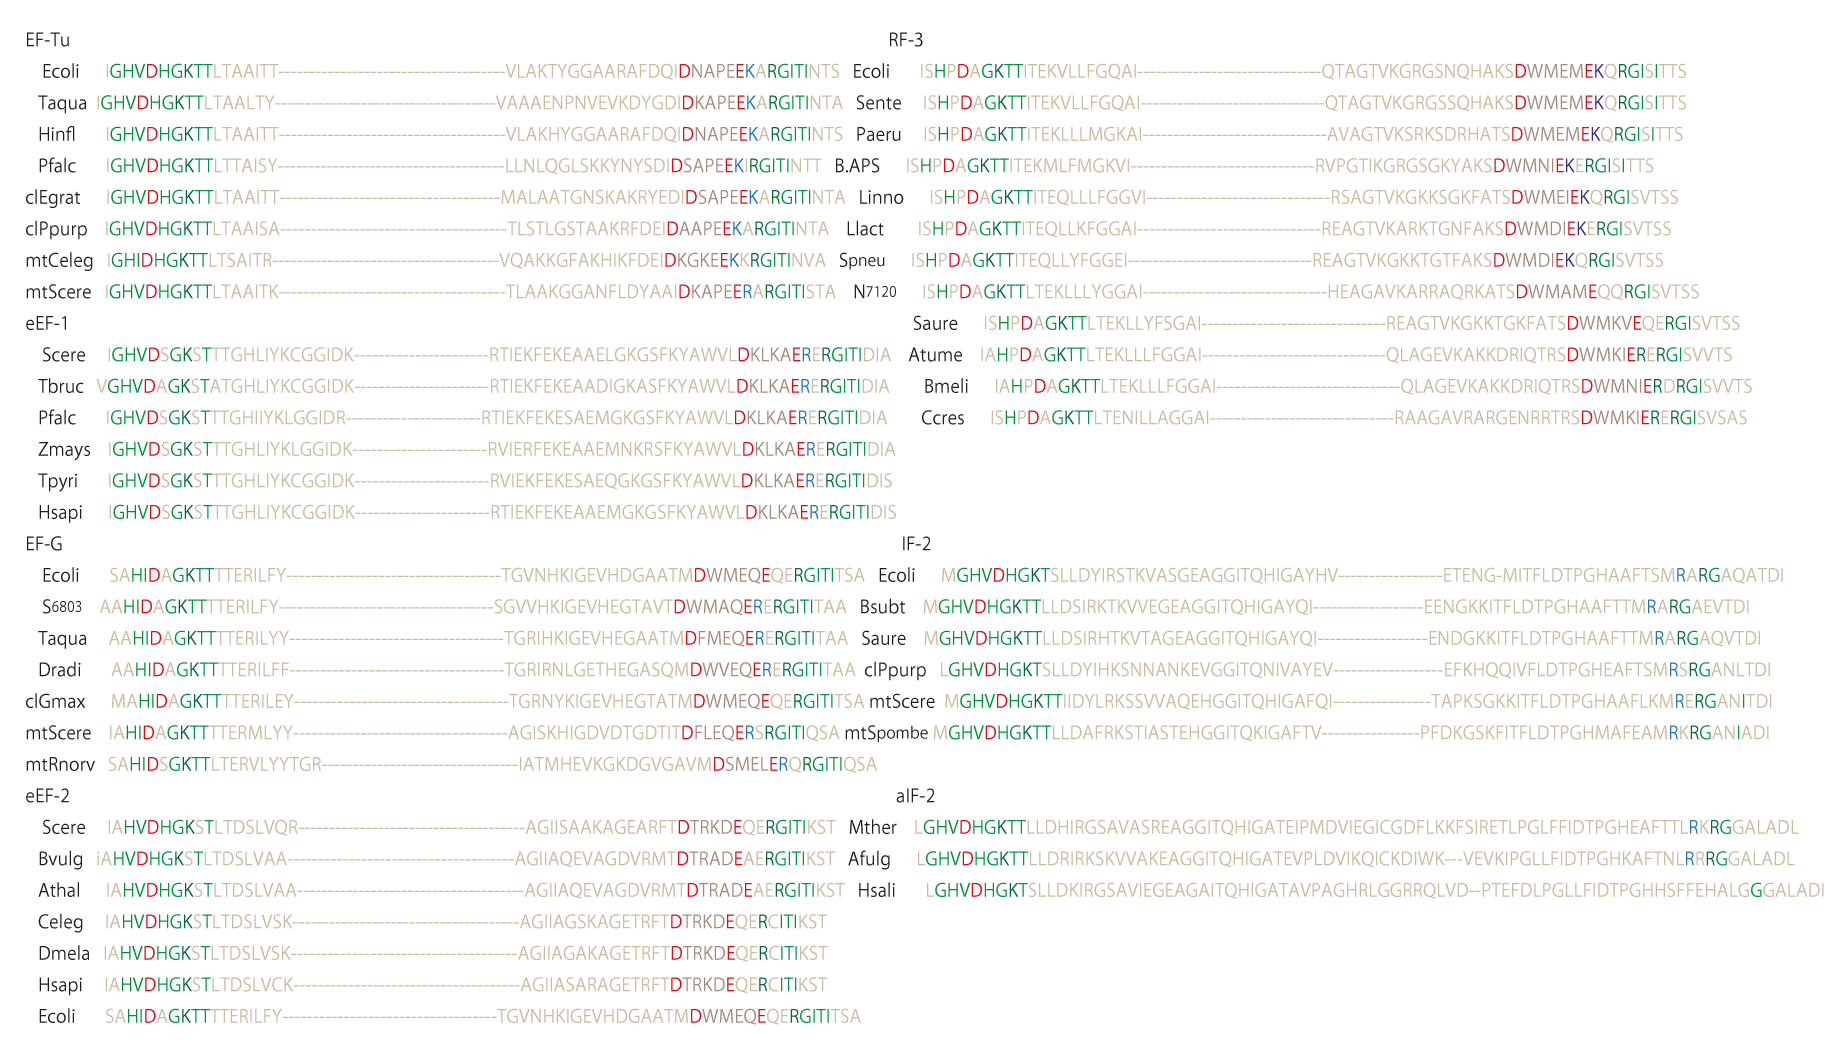
Figure 112 shows the similarity of amino acid sequences of the effector region for four types of GTPases, viz. EF-Tu and its related elongation factors (eEF-1), EF-G and its related ones (eEF-2), termination factors (RF3), and initiation factors (IF-2). The proteins in the group of EF-Tu has a common sequence type such as D****E**RGITI, while those in the group of EF-G has a sequence type of D****E***G**I, and those in the group of RF3 has a sequence type of D****E**RGIS*. It seems important to note that all of them except the group of IF-2 started their evolution from a common sequence of GTPase, but gradually diverged into three different sequences for performing a slightly different function with respect to 70S ribosome. It is, however, a quite different function with initiation factors that must start their function by splitting the 70S ribosome into 30S and 50S subunits. The amino acid sequence of the effector region of IF-2 seems to tell us that it took a long time to reach the present state if it also started its evolution from the common structure of the ancestral GTPase. The personal opinion of the present author is that the RNA structure of the ribosome would have started at the bottom of the mantle under the strong influence of silicate rocks without much help of protein factors and binding ribosomal proteins, when their environment, in particular, was controlled by high pressure and temperature, and that the evolution of various types of protein structures helped the ancestral form of ribosomes to be independent of the silicate rocks. There must have been an increasing trend of water concentration as well as alkali metal concentration. In order to protect the hydrolytic effect of such trends, evolution of ribosomal proteins and cell membrane structure must have been very important. This is the evolution of ribosome, that is also highly associated with the evolution of aminoacyl-tRNA synthetase, very briefly described above. The story about the origin of life begins from the completion of ribosome structure and how an assembly of messenger RNAs performs self-reproduction before appearance of DNA in the world. This is the story of RNA world [6].
References
- Engel MH, Macko SA (1997) Isotopic evidence for extraterrestrial non-racemic amino acids in the Murchison meteorite. Nature 389: 265-268. [Crossref]
- Chyba CF (1997) Origins of life. A left-handed solar systems? Nature 389: 234-235. [Crossref]
- Chyba CF (1998) Origins of life. Buried beginnings. Nature 395: 329-330. [Crossref]
- Corliss JB, Dymond J, Gordon LI, Edmond JM, von Herzen RP, et al. (1979) Submarine thermal springs on the Galapagos rift. Science 203: 1073-1083. [Crossref]
- Martin W, Baross J, Kelley D, Russell MJ (2008) Hydrothermal vents and the origin of life. Nat Rev Microbiol 6: 805-814. [Crossref]
- Joyce GF (1989) RNA evolution and the origins of life. Nature 338: 217-224. [Crossref]
- Nagano K, Nagano N (2007) Mechanism of translation based on intersubunit complementarities of ribosomal RNAs and tRNAs. J Theor Biol 245: 644-668. [Crossref]
- Holbrook SR, Sussman JL, Warrant RW, Kim SH (1978) Crystal structure of yeast phenylalanine transfer RNA II. Structural features and functional implications. J Mol Biol 123: 631-660. [Crossref]
- Nagano K (2015) Structural implications of universal complementarities in translation-High accuracy at the decoding site. Advances in Biol Chem 5: 151-167.
- Eriani G, Delarue M, Poch O, Gangloff J, Moras D (1990) Partition of tRNA synthetases into two classes based on mutually exclusive sets of sequence motifs. Nature 347: 203-206. [Crossref]
- Cusack S, Berthet-Colominas C, Härtlein M, Nassar N, Leberman R (1990) A second class of synthetase structure revealed by X-ray analysis of Escherichia coli seryl-tRNA synthetase at 2.5 A. Nature 347: 249-255. [Crossref]
- Ibba M, Sӧll D (2000) Aminoacyl-tRNA synthesis. Annu Rev Biochem 69: 617-650. [Crossref]
- Cech TR (1987) The chemistry of self-splicing RNA and RNA enzymes. Science 236: 1532-1539. [Crossref]
- Gutell RR (1993) The simplicity behind the elucidation of complex structure in Ribosomal RNA. In: Nierhaus KH., Franceschi F., Subramanian AR., Erdmann VA. and Wittmann-Liebold B., Eds., The translational apparatus, structure, function, regulation, evolution, plenum press, New York, 477-488.
- Brimacombe R (1995) The structure of ribosomal RNA: a three-dimensional jigsaw puzzle. Eur J Biochem 230: 365-383. [Crossref]
- Lotfield RB, Vanderjagt D (1972) The frequency of errors in protein synthesis. Biochem J 128: 1353-1356. [Crossref]
- Hopfield JJ (1974) Kinetic proofreading: A new mechanism for reducing errors in biosynthetic process requiring high specificity. Proc Natl Acad Sci U S A 71: 4135-4139. [Crossref]
- Szer W, Ochoa S (1964) Complexing ability and coding properties of synthetic polynucleotides. J Mol Biol 8: 823-834. [Crossref]
- Thompson RC, Dix DB, Gerson RB, Karim AM (1981) Effect of Mg2+ concentration, polyamines, streptomycin, and mutations in ribosomal proteins on the accuracy of the two-step selection of aminoacyl-tRNAs in protein biosynthesis. J Biol Chem 256: 6676-6681.
- Egebjerg J, Larsen N, Garrett RA (1990) Structural map of 23S rRNA. In: Hill EE., Dahlberg A, Garrett RA., Moore PB., Schlesinger D., Warner JR., Eds., The ribosome structure, function and evolution, American society for microbiology, Washington DC, USA, 168-179.
- Moazed D, Noller HF (1987) Interaction of antibiotics with functional sites in 16S ribosomal RNA. Nature 327: 389-394. [Crossref]
- Endo Y, Wool IG (1982) The site of action of alpha-sarcin on eukaryotic ribosomes. The sequence at the alpha-sarcin cleavage site in 28S ribosomal ribonucleic acid. J Biol Chem 257: 9054-9060. [Crossref]
- Demeshkina N, Jenner L, Westhof E, Yusupov M, Yusupova G (2012) A new understanding of the decoding principle on the ribosome. Nature 484: 256-259. [Crossref]
- Yusupov MM, Yusupova GZ, Baucom A, Lieberman K, Earnest TN, et al. (2001) Crystal structure of the ribosome at 5.5 A resolution. Science 292: 883-896. [Crossref]
- Selmer M, Dunham CM, Murphy FV 4th, Weixlbaumer A, Petry S, et al. (2006) Structure of the 70S ribosome complexed with mRNA and tRNA. Science 313: 1935-1942. [Crossref]
- Korostelev A, Trakhanov S, Laurberg M, Noller HF (2006) Crystal structure of a 70S ribosome-tRNA complex reveals functional interactions and rearrangements. Cell 126: 1065-1077. [Crossref]
- Prince JB, Taylor BH, Thurlow DL, Ofengand J, Zimmermann RA (1982) Covalent crosslinking of tRNA1Val to 16S RNA at the ribosomal P site: identification of crosslinked residues. Proc Natl Acad Sci U S A 79: 5450-5454. [Crossref]
- Sprinzl M, Wagner T, Lorenz S, Erdmann VA (1976) Regions of tRNA important for binding to the ribosomal A and P sites. Biochemistry 15: 3031-3039. [Crossref]
- Nagano K, Nagano N (1997) Transfer RNA docking pair model in the ribosomal pre- and post-translocational states. Nucleic Acids Res 25: 1254-1264. [Crossref]
- Ogle JM, Brodersen DE, Clemons WM Jr, Tarry MJ, Carter AP, et al. (2001) Recognition of cognate transfer RNA by the 30S ribosomal subunit. Science 292: 897-902. [Crossref]
- Bollen B, Davies J, Ozaki M, Mizushima S (1969) Ribosomal protein conferring sensitivity to the antibiotic spectinomycin in Escherichia coli. Science 165: 85-86. [Crossref]
- Sigmund CD, Ettayebi M, Morgan EA (1984) Antibiotic resistance mutations in 16S and 23S ribosomal RNA genes of Escherichia coli. Nucleic Acids Res 12: 4653-4663. [Crossref]
- Peske F, Savelsbergh A, Katunin VI, Rodnina MV, Wintermeyer W (2004) Conformational changes of the small ribosomal subunit during elongation factor G-dependent tRNA-mRNA translocation. J Molec Biol 343: 1183-1194. [Crossref]
- Valle M, Zavialov A, Sengupta J, Rawat U, Ehrenberg M, et al. (2003) Locking and unlocking of ribosomal motions. Cell 114: 123-134. [Crossref]
- Sergiev PV, Lesnyak DV, Kiparisov SV, Burakovsky DE, Leonov AA, et al. (2005) Function of the ribosomal E-site: a mutagenesis study. Nucleic Acids Res 33: 6048-6056. [Crossref]
- Feinberg JS, Joseph S (2001) Identification of molecular interactions between P-site tRNA and the ribosome essential for translocation. Proc Natl Acad Sci U S A 98: 11120-11125. [Crossref]
- Schmeing TM, Voorhees RM, Kelley AC, Gao YG, Murphy FV 4th, et al. (2009) The crystal structure of the ribosome bound to EF-Tu and aminoacyl-tRNA. Science 326: 688-694. [Crossref]
- Schmeing TM, Voorhees RM, Kelley AC, Ramakrishnan V (2011) How mutations in tRNA distant from the anticodon affect the fidelity of decoding. Nat Struct Mol Biol 18: 432-436. [Crossref]
- AEvarsson A, Brazhnikov E, Garber M, Zheltonosova J, Chirgadze Y, et al (1994) Three-dimensional structure of the ribosomal translocase: Elongation factor G from Thermus thermophiles. EMBO J 13: 3669-3677. [Crossref]
- Gao YG, Selmer M, Dunham CM, Weixlbaumer A, Kelley AC, et al. (2009) The structure of the ribosome with elongation factor G trapped in the posttranslocational state. Science 326: 694-699. [Crossref]
- Frank J, Agrawal RK (2000) A ratchet-like inter-subunit reorganization of the ribosome during translocation. Nature 406: 318-322. [Crossref]
- Wittmann HG, Littlechild JA, Wittmann-Liebold B (1979) Structure of ribosomal proteins. In: Chambliss G., Craven GR., Davies J., Davis K., Kahan L., Nomura M. (Eds.), Ribosomes: structure, function, and genetics. University Park Press, Baltimore, USA, 51-88.
- Nierhaus KH (1979) Analysis of the assembly and function of the 50S subunit from Escherichia coli ribosomes by reconstitution. In: Chambliss G., Craven GR., Davies J., Davis K., Kahan L., Nomura, M. (Eds.), Ribosomes: structure, function, and genetics. University Park Press, Baltimore, USA, 267-294.

