Feline mammary cancers have high recurrence and metastatic potential. Abnormal expression or function in the major molecules of the cadherin-catenin adhesion complex have been related to breast cancer development and associated to cell migration, invasion and metastatic dissemination. In feline mammary tumours, cadherins and catenins´ role is still poorly known. Therefore, we seek for suitable in vitro and in vivo model systems to study the leading role of P-cadherin and the molecules of the cadherin-catenin complex (CCC) in feline mammary carcinogenesis.
Major molecules from the CCC (E- and P-cadherin, α-, β- and p120-catenin) were evaluated in a feline mammary carcinoma cell line (FMCm), by Western blot analysis, immunofluorescence, imunoprecipitation and in situ proximity ligation assay. The FMCm cell line tumourigenic and metastatic capacity was assessed by orthotopically inoculation of a cell suspension in the mammary fat pad of athymic nude mice (N:NIH(S)II-nu/nu). Mice xenografts, as well as metastatic lesions, were evaluated immunohistochemically for cadherins and catenins expression. P- and E-cadherin double-labelling immunofluorescence was also assessed.
The FMCm cell line expressed E- and P-cadherin as well as α-, β- and p120-catenin. E-cadherin was showed to interact with each catenin, revealing a putative complete CCC. The cells had E- and P-cadherin co-expression and a close proximity between these two molecules. The FMCm cell line revealed to be highly tumourigenic and metastatic leading to the formation of primary and metastatic lesions in all animals that express all the molecules from the CCC studied. FMCm cell line represents a useful model for in vitro and in vivo studies of feline mammary carcinoma progression.
FMCm cell line, in vitro model, in vivo model, classical cadherins, catenins
Cadherins are members of a large family of transmembrane glycoproteins that mediate calcium-dependent homotypic cell-cell adhesion [1]. Two cadherin family members are expressed in the normal mammary gland: E-cadherin, a 120 kDa glycoprotein [2], present in luminal epithelial and myoepithelial cells [3], and P-cadherin, a 118 kDa glycoprotein [4], which is confined to the myoepithelium [3,5]. Cadherins connect indirectly to the actin cytoskeleton, through their cytoplasmic domain, via a group of proteins known as catenins [6]. β-Catenin is a 95 kDa protein that associates directly with cadherins, while α-catenin is a 102 kDa protein indirectly associated through interaction with β-catenin, thus mediating the interaction between cadherin-catenin complex (CCC) and actin cytoskeleton [7]. p120-Catenin is a protein with multiple isoforms ranging in size from 90-120 kDa that binds to the cadherin juxtamembrane region, but does not link the complex to the actin cytoskeleton [7,8]. Changes in the major molecules of the cadherin-catenin adhesion complex are related to the development of human breast cancer and their abnormal expression or function are associated to decreased intercellular adhesion, cell migration, invasion and metastatic dissemination [6,9,10]. Loss or delocalization of E-cadherin and catenins from the membrane is related to an invasive breast cancer phenotype [6]. P-cadherin overexpression is associated to breast cancer progression and worse patient survival [10,11].
Mammary neoplasia is the third most common tumour in female cats, with 85 to 90% being malignant [12,13]. Affected cats have a high mortality rate and a mean survival time of one year [14], due to local recurrence and/or metastatic disease [12,13], particularly to the regional lymph nodes, lungs, pleura and liver [14]. Colonization of distant tissues by tumour cells represents the most dangerous attribute of cancer. Prevention of metastasis and effective treatments of already established metastases are necessary in order to increase survival. Thus, it is of extreme importance to identify and characterize biologic, biochemical and molecular basis mechanisms that drive metastasis, in order to develop therapeutic agents to inhibit this process.
Only a small number of studies assessed the expression of cadherins and catenins in feline mammary tumours [15-18]. Molecular studies of these proteins in spontaneously lesions, as well as in both in vitro and in vivo models, are extremely valuable to assess their roles in feline mammary tumours. We have been focused on studying P-cadherin in feline mammary tumours as it revealed to be associated to aggressive feline mammary carcinomas (FMC). To the best of our knowledge there is no FMC cell line characterized in what concern P-cadherin expression, nor studies of this protein in an in vivo model for feline species. Thus, we search a FMC cell line in order to establish a suitable in vitro and in vivo model systems to evaluate the expression and functions of CCC molecules, namely P- and E-cadherin, as well as α-, β-, and p120-catenin, towards a better understanding of their role in feline mammary tumours progression. In this context we studied the feline mammary carcinoma cell line (FMCm), by evaluating the expression of the P-cadherin molecule as well as the other CCC molecules. Moreover, in order to mimic as much as possible the spontaneous lesions we used xenograft mice aiming to develop an in vivo model for the study of P-cadherin in FMC, with both prognosis and therapeutic purposes.
In vitro studies
Cell culture: The FMCm cell line was established and characterized by Uyama et al. [19] and kindly provided by Professor Sasaki, University of Tokyo, Japan. FMCm cell line was established from a regional lymph node metastatic lesion collected during surgery of a 12 years old Japanese domestic female cat with a primary mammary adenocarcinoma in stage III (T3cN1(+) M0) [19].
FMCm cells were grown in monolayer culture in RPMI 1640 with Glutamax medium (Gibco, Invitrogen), supplemented with 10% fetal bovine serum (Gibco, Invitrogen) and 1% penicillin-streptomycin (Gibco, Invitrogen), replaced every two days. Culture was maintained at 37ºC in humidified 5% CO2 atmosphere.
Western blot analysis: Confluent T75 cm2 flasks were incubated with NP40 lysis buffer and cells were scraped. Total cell lysates were centrifuged at 14000 rpm for 10 min to remove pellet cell debris. Protein concentration was determined by the bicinchoninic acid (BCA) protein assay (Pierce). Proteins from cell lysates were separated according to their molecular weight by gel electrophoresis, in 7.5% acrylamide/bis acrylamide (Sigma) SDS-PAGE. A 25 µg of total protein extract was used. Gels were transferred onto a nitrocellulose membrane (Amersham) in a semi-dry system. Membranes were blocked with 5% non-fat milk, washed three times with phosphate buffer saline with 0.005% tween (PBS-T), and incubated overnight at 4ºC with primary antibodies (Table 1). Membranes were then washed three times with PBS-T and incubated 1 hour with secondary antibodies conjugated with horseradish peroxidase (DAKO) at 1:2000. Analysis was performed by chemiluminescence using the ECL Western blotting detection reagent and films (GE Healthcare).
Immunofluorescence: FMCm cells were cultured in glass slides and placed in 24 well plates until reached approximately 80% confluence. After washing with phosphate buffered saline (PBS) three times, cells were fixed with methanol for 15 min at 4ºC and rehydrated using PBS for 10 minutes. Unspecific detection was blocked using normal goat serum (1:5) in 10% BSA for 20 min. Incubation was performed with primary antibody (Table 1) diluted in 5% BSA, overnight in a wet chamber. After three washes with PBS, slides were incubated for one hour with secondary antibodies, diluted 1:500 in 5% BSA. Cells were washed with PBS and incubated with 4,6-diamidine-2-phenylindolendihydrochoride (DAPI) 100 µg/mL for 10 min. Slides were mounted in Vectashield medium (Vector, Burlingame, CA, USA) and observed by fluorescence microscopy (Zeiss Imager Z1 microscope) with appropriate filters. Separate images for Alexa 488 and Alexa 594 were captured at 200x magnification and then merged to allow a double immunostaining. For negative controls, the primary antibody was replaced by PBS.
In situ proximity ligation assay: Cells were deposited on glass slides and fixed with methanol. In situ proximity ligation assay (PLA) was performed using the Duolink kit (Olink Bioscience, Uppsala, Sweden) according to the manufacturer’s recommendations. Slides were analysed with fluorescence microscopy (Zeiss Imager Z1 microscope).
E-cadherin immunoprecipitation: Two µL of rabbit anti-E-cadherin antibody (clone 24E10, Cell Signalling) were coupled to 60 µL of ProteinG Sepharose beads (Sigma) for 2 hours at 4ºC. Protein cell lysates (750 µg) were pre-cleared in 30 µL of ProteinG Sepharose beads during 2 hours in order to block protein unspecific linkage. Following the lysate pre-clear and antibody linkage to the beads, pre-cleared lysates were incubated overnight in antibody-proteinG beads. Washes were performed with PBS and after protein incubation 1% of Triton X-100 (Sigma) were added to PBS to clear unspecific protein binding. Three independent immunoprecipitation assays were performed and each was done in triplicate in order to have enough protein for the different western blots. The immunoprecipitated proteins were eluted in SDS Laemmeli buffer and used for E-cadherin, P-cadherin, α-, β- and p120-catenin Western blots. Negative controls were performed using rabbit immunoglobulins instead of E-cadherin antibody in protein G-beads.
In vivo studies
Animals
N:NIH(S)II-nu/nu athymic nude mice [20] was used. Animal experiments were carried out in accordance with the European Guidelines for the Care and Use of Laboratory Animals, Directive 2010/63/UE and the National Regulation 2013. The Humane Endpoints for euthanasia were established: any signals of distress; suffering or pain; body weight loss greater than 20-25% of the body mass and anorexia, related or not to the experimental procedure. The endpoint for the experiment was established at day 185.
FMCm tumorigenic and metastatic capacity assessment
Six female NIH(S)II-nu/nu, aged 8 to 9 weeks-old, were orthotopically inoculated with 1x10⁷ viable FMCm cells suspension in the mammary fat pad using a 25 gauge needle, as previously described [21]. Mice were monitored every day for development of primary xenografted tumours. When nodules become palpable, tumour size was measured and three dimensions were estimated (length, width and thickness). Tumour volumes (mm3) were assessed using the formula: WxL2x½ (W=width, L=length). Lesions were surgically removed when volumes reached 850-1000 mm3. Exception was made in cases where tumours developed large ulcers being removed earlier. For tumours surgical excision purpose, mice were anesthetized by intraperitoneal injection with 100 μL of a mixture containing 75 mg/kg of ketamine hydrochloride (Imalgene 1000®, Merial) and 1 mg/kg of medetomidine hydrochloride (Medetor®, Virbac). To antagonize the effect of anaesthesia a solution of 100 μL containing 2.5 mg/kg of atipamezole hydrochloride (Revertor®, Virbac) was intraperitoneal administered. 10 mg/kg tramadol hydrochloride (Tramal®, Grunenthal GmbH), was given orally every 8h for 24-48h for pain control. At surgery, tumours were collected and fixed in 10% neutral buffered formalin. All mice were humanely euthanized according to the predefined Humane Endpoints and necropsies were performed. At necropsy, mice were examined visually for macro-metastases and both tumour masses and target organs (lymph nodes, lung and liver) were removed and also formalin-fixed. After routine histological processing, tissues were paraffin-embedded and sequential 3µm-sections were cut, one being stained with haematoxylin and eosin (HE) for histological examination and the others were used for immunohistochemical studies.
The histological classification of tumours was performed independently by two observers (ACF and FG) and based on the criteria of the World Health Organization (WHO) for the histological classification of mammary tumours of domestic animals [22]. Carcinomas were graded in accordance with the modification of the numeric method of Nottingham grading system for human breast carcinomas [23].
Immunohistochemistry of mice xenografts
For the immunohistochemical study, paraffin sections were dewaxed, rehydrated and treated for antigen retrieval at high temperature (98ºC) with Tris-EDTA (NovocastraTM, Ref 7119, Newcastle, UK). Endogenous peroxidase activity was blocked with 3% H2O2 in methanol for 10 minutes and washed in PBS three times. Then, sections were incubated with normal goat serum diluted 1:5 in 10% BSA in PBS during 30 min, followed by incubation with the primary monoclonal antibodies diluted in 5% BSA in PBS, overnight, at 4ºC in a humid chamber (Table 1). Incubation with biotinylated secondary antibodies (DAKO) was done during 30 min at room temperature, followed by avidin-biotin complex incubation (Vectastain). Immunolabelling was detected with 3,3´-diaminobenzidine tetrahydrochloride (DAB) (Sigma) containing 0.02% hydrogen peroxide and sections were then hematoxylin counterstained. For negative controls, the primary antibody was replaced by PBS. Sections of feline normal mammary gland were used as positive controls. In the lymph nodes sections, additional immunohistochemical analysis with antibody anti-pancytokeratin AE1/AE3 was performed in order to evaluate the presence of (micro)metastases.
P-cadherin and E-cadherin double-labelling immunofluorescence in mice xenografts
Tissue sections were dewaxed, rehydrated and treated at high temperature (98ºC) with Tris-EDTA (NovocastraTM, Ref 7119, Newcastle, UK) for antigen retrieval. Then, tissues sections were blocked with 10% BSA for 20 minutes, followed by incubation with the primary antibodies anti P-cadherin and anti E-cadherin (Table 1), diluted in 5% BSA for two hours in a wet chamber. After washing with PBS, slides were incubated for one hour with Alexa 488 and Alexa 594 secondary antibodies, diluted 1:500 in 5% BSA. Washes were performed with PBS and slides incubated with DAPI 100 μg/mL for 10 min, mounted in Vectashield medium (Vector, Burlingame, CA, USA) and analysed by fluorescence microscopy (Zeiss Imager Z1 microscope) with appropriate filters. Negative controls were performed by replacing the primary antibody by PBS.
Table 1. Data from primary antibodies used in the techniques applied in this work.
Antibody |
Monoclonal antibodies |
Clone |
Laboratory |
Primary antibody dilution |
Antigen retrieval for IHC |
Western blot |
IF cell |
IF tissue |
IHC |
P-cadherin |
mouse anti-human |
56 |
BD Transduction |
1:500 |
1:50 |
1:50 |
1:50 |
Tris-EDTA, pH 7.6 |
E-cadherin |
mouse anti-human |
4A2C7 |
Invitrogen |
___ |
___ |
___ |
1:50 |
Tris-EDTA, pH 7.6 |
E-cadherin |
rabbit anti-human |
24E10 |
Cell Signalling |
1:1000 |
1:100 |
1:100 |
__ |
___ |
α-catenin |
mouse anti-human |
αCAT-7A4 |
Zymed/Invitrogen |
1:500 |
1:100 |
___ |
1:100 |
Tris-EDTA, pH 7.6 |
β-catenin |
mouse anti-human |
CAT-5H10 |
Zymed/Invitrogen |
1:500 |
1:300 |
___ |
1:300 |
Tris-EDTA, pH 7.6 |
p120-catenin |
mouse anti-human |
98/pp120 |
BD Transduction |
1:1000 |
1:1000 |
___ |
1:1000 |
Tris-EDTA, pH 7.6 |
Pan-cytokeratin |
mouse anti-human |
AE1/AE3 |
Zymed/Invitrogen |
1:300 |
___ |
___ |
1:300 |
10 mM citrate buffer , pH 7.6 |
CAM 5.2 |
mouse anti-human |
CK8 |
BD Transduction |
___ |
1:5 |
___ |
___ |
___ |
Vimentin |
mouse anti-human |
V9 |
Dako |
1:500 |
1:500 |
___ |
1:500 |
10 mM citrate buffer , pH 7.6 |
p63 |
mouse anti-human |
4A4 |
Ventana |
___ |
___ |
___ |
1:200 |
10 mM citrate buffer , pH 7.6 |
IF - immunofluorescence |
IHC - immunohistochemistry |
Characterization of the FMCm cell line
FMCm cell line formed a monolayer of epithelial-like cells in culture, round to spindle in shape, with large nuclei and often two or more nucleoli (Figure 1).
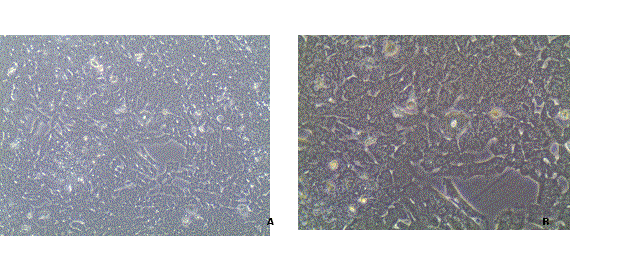
Figure 1. FMCm cell line in culture. Cells grown as a monolayer of epithelial-like cells, round to spindle in shape, with large nuclei and often two or more nucleoli. 100x (A) and 200x (B).
Western blot characterization of cadherin and catenin proteins showed that FMCm cells expressed both E-and P- cadherin as well as p120, α- and β- catenin (Figure 2). For E-cadherin two main bands were observed at approximately 135 and 110 kDa. Regarding P-cadherin, two bands were formed near the 120 and 90kDa. Western blot for catenins demonstrated the expression of α- and β-catenin both at approximately 100 kDa, and the expression of p120-catenin at different weights with the major bands formed at 100 and 120 kDa. FMCm cells also expressed epithelial and mesenchymal markers, such as cytokeratins in the 45 kDa position and vimentin at approximately 80 kDa (Figure 2).
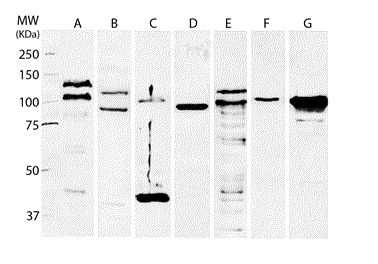
Figure 2. Western blot analysis of the expression of proteins from the cadherin-catenin complex (CCC), as well as phenotypic markers of the FMCm total cell lysate. FMCm cells showed expression of E-cadherin (A), P-cadherin (B), p120-catenin (E), α-catenin (F) and β-catenin (G). The expression of epithelial and mesenchymal markers was evaluated by expression of cytokeratins (C) and vimentin (D).
Immunofluorescence revealed membranous E-cadherin, p120, α- and β- catenins labelling of the majority of the cells, while P-cadherin was restricted to the cell membrane of a smaller proportion (Figure 3). Double immunofluorescence analysis showed the co-expression of E-cadherin with each catenin (α-, β- and p120-catenin) and with P-cadherin at the cell membranes. In addition, immunofluorescence analysis of FMCm cells confirmed the expression of both cytokeratins and vimentin (Figure 3).
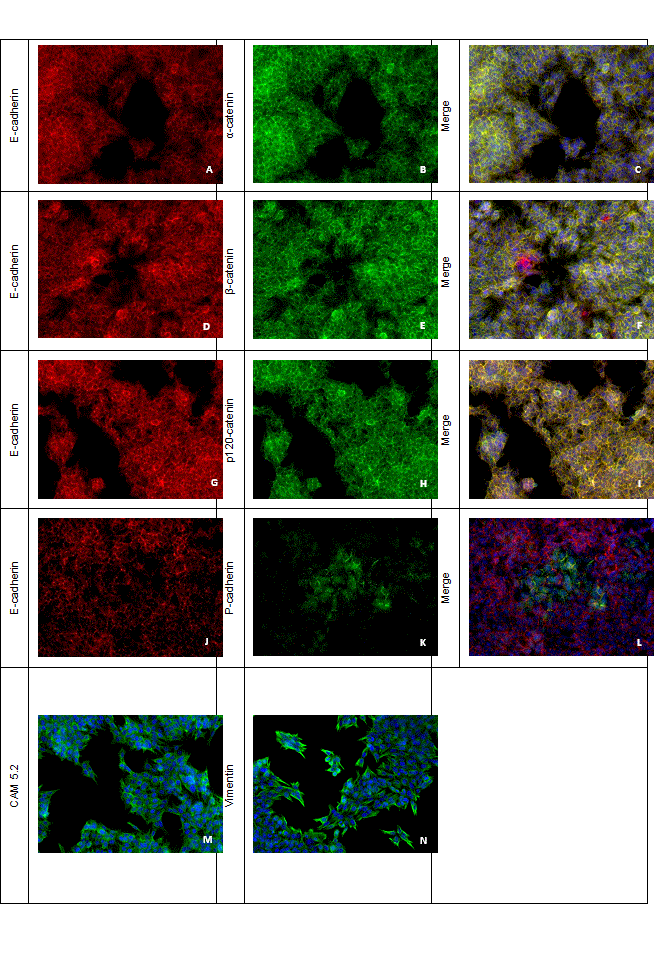
Figure 3. Simple and double-label immunofluorescence analysis in FMCm cell line, 200x. Imunofluorescence expression of (A, D, G, J) E-cadherin (red), (K) P-cadherin (green), (B) α-catenin (green), (E) β-catenin (green) and (H) p120 catenin (green) in FMCm cells. Double-label immunofluorescence co-expression of (C) E-cadherin and α-catenin (yellow), (F) E-cadherin and β-catenin (yellow), (I) E-cadherin and p120-catenin (yellow) and (L) E-cadherin and P-cadherin (yellow). Immunofluorescence expression of (M) cytokeratins (green) and (N) vimentin (green).
Immunoprecipitation assays were performed in order to evaluate the possible interaction of E-cadherin with the other proteins of the CCC. E-cadherin was immunoprecipitated from total cell lysates of FMCm cells and western blot analysis for P-cadherin and p120, α- and β- catenins was performed (Figure 4). The results demonstrated that along with E-cadherin it was possible to detect the presence of each one of the catenins as well as P-cadherin (Figure 5), indicating that E-cadherin interacts with all these molecules. Furthermore, the P-cadherin western blot analysis of E-cadherin immunoprecipitates identified the P-cadherin at a lower molecular weight (approximately 80-90 kDa) when compared with the expression of P-cadherin in the total cell lysate (of 120 kDa). This result was very consistent in all the experiments. Despite many improvements in the immunoprecipitation protocol, a clear negative control for p120-catenin western blot after E-cadherin immunoprecipitation was not achieved. This probably suggests that the rabbit immunoglobulins used in the negative control have some cross reactivity to feline p120 protein.
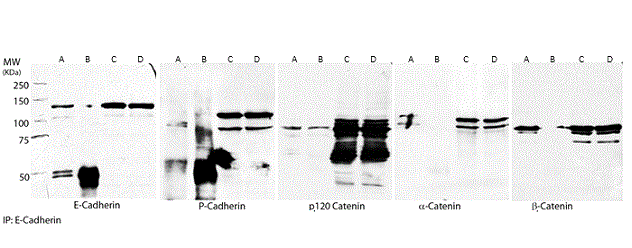
Figure 4. E-cadherin immunoprecipitation and evaluation of CCC in FMCm cells. Immunoprecipitation of E-cadherin was performed in cell lysates and the presence of P-cadherin, p120-catenin, α-catenin and β-catenin were evaluated. Immunoprecipitation assay was capable of capture E-cadherin from total cell lysates. P-cadherin, p120-catenin, α-catenin and β-catenin proteins were also detected after immunoprecipitation. (A) E-cadherin immunoprecipitates; (B) Rabbit IgG immunoprecipitates (immunoprecipitation control); (C) Protein input from E-cadherin immunoprecipitates; (D) Protein input from rabbit IgG immunoprecipitates
In order to validate the interaction between E- and P-cadherin observed in the immunoprecipitation experiments, an in situ proximity ligation assay was performed, which demonstrated the close proximity of P- and E-cadherin observed by the cell red dots (Figure 5).
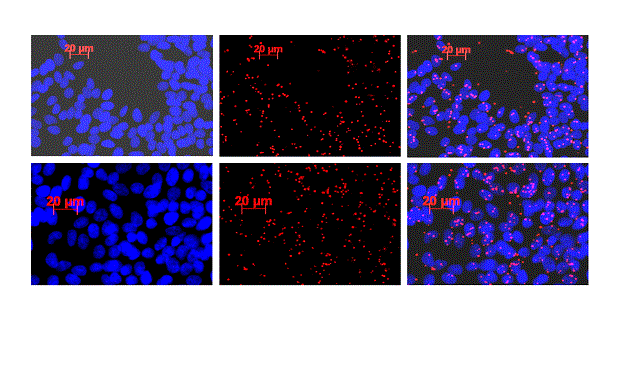
Figure 5. In situ proximity ligation assay for E- and P-cadherin. Positive signals (red dots) observed in FMCm cells show a proximity and putative interaction between these two proteins.
In vivo behaviour of FMCm cell line – tumourigenic and metastatic capacity
All mice presented a palpable mammary nodule at days 2 or 3 post-inoculation with FMCm cells. The growth of the nodules was noticeable from day 7 post-inoculation onwards. The FMCm cell line was able to induce local nodules in the six inoculated mice.
Two of the 6 mice developed tumours with large areas of ulceration leading to its early removal (625 mm3 and 550 mm3 volume) and one mouse had a tumour that stop growing with 158 mm3 volume, at day 51. All mice, except the one that tumour did not grow as the overall, showed signs of body-weight loss and were euthanized. Table 2 displays the time intervals (in days) between inoculation (day 0) and primary tumour excision and their respective volumes by the time of surgery and euthanasia. Metastases were detected in all mice at the time of euthanasia, including in the one that the tumour did not grow as the majority.
Table 2. Tumours growth kinetics, time of surgery and metastases location at time of euthanasia.
Mice |
Surgery (days)
/Tumour volume (mm3) |
|
Euthanasia
(days inoculation/days tumour
excision) |
Mestastases location |
1 |
52 / 847 |
|
185 /133 |
Lymph node |
2 |
51 / 963 |
|
104 / 53 |
Lymph node/Lungs |
3 |
52 / 550 |
|
146 / 94 |
Lymph node |
4* |
74 / 158 |
|
185 / 111 |
Lymph node |
5 |
52 / 625 |
|
114 / 62 |
Lymph node/Lungs |
6 |
51 / 1080 |
|
114 / 63 |
Lymph node |
*mice excluded from the kinetic curve of tumour growth; the tumour did not grow after day 51.
Characterization of mice xenografts
All the tumours were classified as solid carcinomas, characterized by a predominant solid pattern with areas of tubular differentiation, high mitotic counts, and marked nuclear pleomorphism. Carcinomas were classified as grade III (poorly differentiated) and exhibited extensive areas of necrosis and invasive growth. In four cases (66.67%) the masses ulcerated and all mice developed nodal macro or micro metastases. In two animals (33.33%) lung metastases were also documented. Histologically, metastases showed features similar to those observed in xenografts. Neoplastic lesions expressed both cytokeratin and vimentin, however immune reactivity to p63 was not observed (Figure 6).
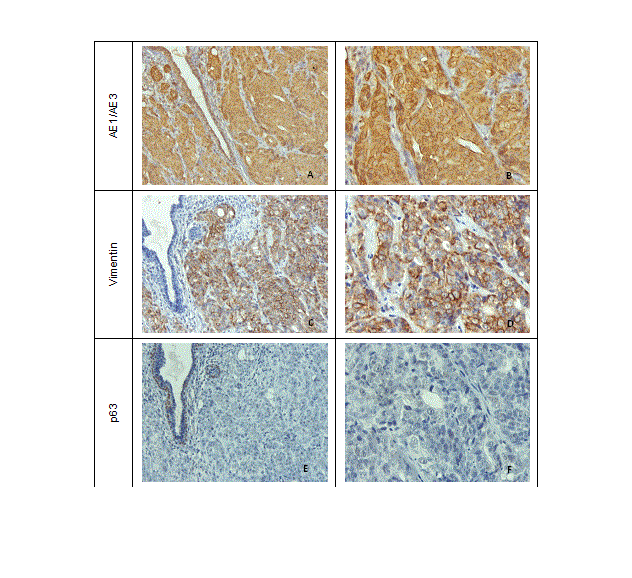
Figure 6. AE1/AE3, vimentin and p63 expression by immunohistochemistry in neoplastic epithelial cells of mice xenografts. (A and B) Strong membranous and cytoplasm AE1/AE3 immunoreactivity, x200 and x400; (C and D) Strong membranous vimentin immunoreactivity, x200 and x400; (E and F) Absence of p63 immunoreactivity in epithelial cells, x200 and x400.
All tumours showed E-cadherin, α-, β- and p120-catenin immune positivity (Figure 7 and 8) with a membranous expression in approximately 75% of the neoplastic cells. The expression of P-cadherin was also membranous and found in more than half of the neoplastic epithelial cells (Figure 7). The pattern of expression in metastases matched their xenografts (Figure 7 and 8).
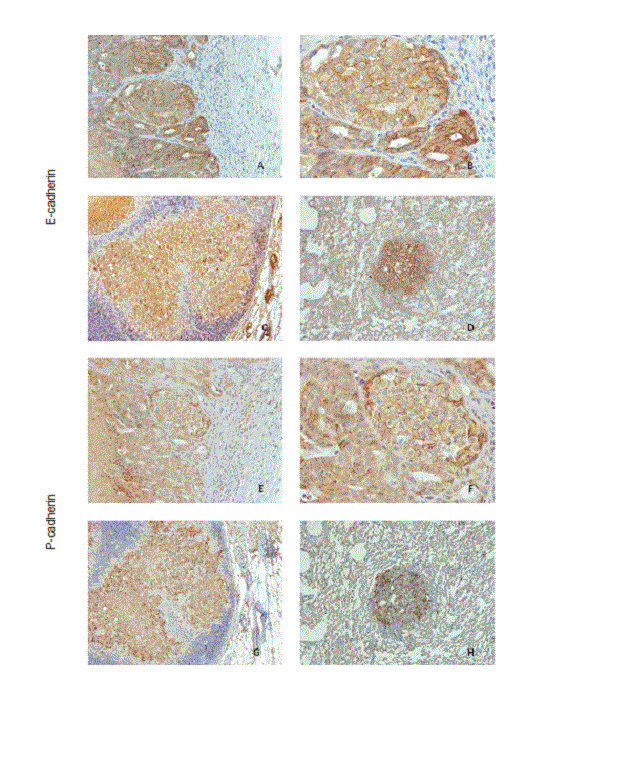
Figure 7. E- and P-cadherin immunoexpression in mice lesions. (A and B) Carcinoma with E-cadherin expression in more than 75% of the epithelial cells, x200 and x400; (C) E-cadherin expression in lymph node metastases, x100; D) E-cadherin expression in lung metastases, x100; (E and F) Carcinoma with P-cadherin expression in more than 50% of the epithelial cells, x200 and x400; (G) P-cadherin expression in lymph node metastases, x100; (H) P-cadherin expression in lung metastases, x100.
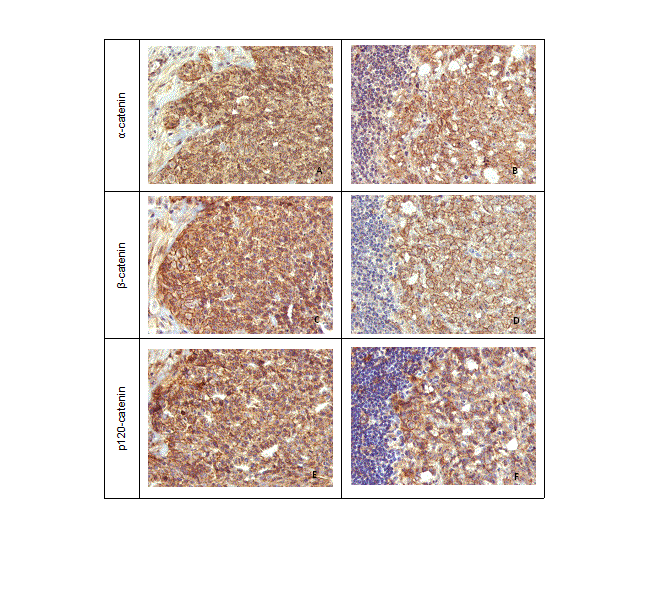
Figure 8. α- β- and p120-catenin immunoexpression in mice carcinoma lesions, 400x. (A) α-catenin immunoreactivity in the membrane of neoplastic epithelial cells. (B) α-catenin expression in lymph node metastase. (C) β-catenin immunoreactivity in the membrane of neoplastic epithelial cells. (D) β-catenin expression in lymph node metastase. (E) p120-catenin immunoreactivity in the membrane of neoplastic epithelial cells. (F) p120-catenin expression in lymph node metastase.
P- and E-cadherin double-labelling immunofluorescence analysis revealed a membranous co-expression of both molecules, particularly at the tumours´ peripheral invasive front. The same pattern was observed in lymph node metastases (Figure 9).
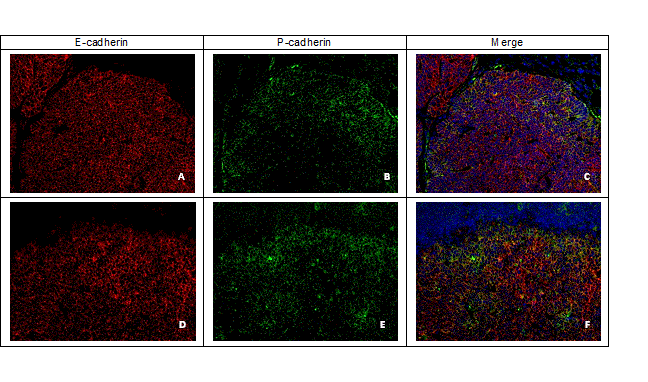
Figure 9. E- and P-cadherin expression by double-label immunofluorescence in mice epithelial neoplastic cells, x200. (A) E-cadherin expression (red colour) and (B) P-cadherin (green colour); (C) Co-expression of P-cadherin and E-cadherin (yellow colour); (D) Lymph node metastatic cells expressing E-cadherin (red colour) and (E) P-cadherin (green colour); (F) Lymph node metastatic cells co-expressing P-cadherin and E-cadherin (yellow colour).
Experimental model systems for cancer research and several established FMC cell lines have been reported [19, 24-26]. However, in vitro models are limited in the representation of real cancer at various levels, including the lack of three dimensional structures and absence of matrix and stromal cells interactions, endocrine influences, immune response, amongst others, which can be achieved only using in vivo models [27]. The in vivo xenograft models allows heterotransplantation of cancer cells or tumour biopsies into immunodeficient rodents, favouring the growth of tumours under direct stromal interactions [27].
Since our main goal was to determine an in vitro and in vivo model for the study of P-cadherin and the associated molecules of the CCC, E-cadherin and α-, β-, and p120-catenin in mammary neoplasms, we choose the FMCm cell line established from a nodal metastase of a feline mammary carcinoma [19].
The FMCm cell line in culture revealed an epithelial-phenotype with an intense immunoreactivity for the epithelial cell marker pan-cytokeratin. However, cells also expressed vimentin, an intermediate filament of mesenchyme cells that has been associated with a loss of cell-to-cell contact and acquisition of migration and invasion capacities by breast cancer cell [28]. This cell line was also characterized by the expression of E-cadherin, α-, β- and p120-catenin, and it was determined a link between E-cadherin and each catenin. This may indicate a preserved CCC, a characteristic of intercellular adhesion system of luminal epithelial mammary cells. The FMCm cell line also expressed P-cadherin, which is not usually present in epithelial luminal cells of the breast, being normally found at myoepithelium [10]. In Western blot analysis, for each one of the cadherins we detected two bands with distinct molecular weights, that probably correspond to the cadherin molecule (higher weight) and to the cadherins fragment sE-cad and sP-cad (lower weight), that results from the cleavage and shedding of the extradomain of the cadherins [29]. By immunofluorescence, P-cadherin was co-localized with E-cadherin in a small population of cells, possibly indicating a sub-clone population. There was an interaction between the two cadherins, as demonstrated by the in situ proximity ligation assay and confirmed by immunoprecipitation. However, the smaller weight P-cadherin was identified in the immunoprecipitation assay. Thus, E-cadherin probably is only able to interact with the small weight P-cadherin, which possibly corresponds to the described fragment of P-cadherin (sP-cad)[29]. Thus, this in vitro cell model displays in the same cell line the major molecules of the CCC.
Aiming to develop an in vivo model for the study of FMC that could mimic as much as possible the spontaneous lesions, an FMCm cell suspension was inoculated in the mammary fat pad of athymic nude mice. This location permits the interaction of the breast tumour cells with matrix and stromal cells from the proper anatomical site and when compared to the subcutaneous area (interscapular), it is a more favourable site for the growth of xenografts of breast cell lines and also to favour metastasis [30]. Furthermore, it has been reported as the best in vivo model for accurately assessing breast cancer metastatic potential [31]. The FMCm cells were able to induce local tumours in all animals revealing to be a highly tumorigenic cell line in nude mice, with development of high grade mammary carcinoma.
A significant characteristic of spontaneous FMC is the high incidence of metastases which is the cause of most therapeutic failures [12,13]. Metastasis is a complex multistep process by which tumour cells escape from the primary site and disseminate through blood or lymphatic vessels to form new lesions in other organs. To metastasize, tumour cells must degrade and cross the extracellular matrix, intrastate, travel through blood or lymphatic vessels, extravasate at the secondary site, and finally, establish secondary tumours. To understand metastization it is imperative to have a research model that mimics a number of steps of this process [32]. Therefore, the mice of this study were not euthanized by the time of surgical excision of the primary tumour to permit metastization and mimic the medical procedure usually applied in the clinical practice to felines’ patients. At the time of death all mice had developed nodal metastases or micro metastases and in two mice pulmonary metastases were also found. This metastatic pattern was similar to the one described in queens [14]. The behaviour of the tumours induced by the FMCm cell line underlines the high aggressive and high metastastic potential of this cell line. The immunohistochemical analysis of the mammary lesions revealed the presence of all molecules of the CCC and also P-cadherin, both in primary and metastastic lesions. Moreover, double-immunofluorescence revealed co-expression of E-cadherin and P-cadherin.
P-cadherin is normally not expressed by luminal epithelial mammary cells, and its overexpression in breast cancer cells is correlated with increased tumour cell motility, migration and invasiveness [29] and associated to a worse prognosis [33]. Moreover, the expression of P-cadherin in E-cadherin positive breast cancer is associated to aggressive behaviour, invasion, metastasis and poorest prognosis than that of carcinomas that express only one of the cadherins [29,34,35]. The invasive and metastatic potential of the FMCm cells derived tumours in vivo is possibly related to the presence of both E- and P-cadherins.
The most widely used treatment approach to feline mammary tumours is surgical excision [36]. However, cats with mammary cancer have a high rate of post-mastectomy recurrence or metastatic disease [12,13]. In spite of attempts to develop better surgical approaches, chemotherapeutic or radio therapeutic protocols, the treatment options are limited and the overall patient treatment outcome has not been substantially improved. Therefore, the development of novel adjuvant therapies is crucial [14]. P-cadherin has been recently considered as a potential therapeutic target in human breast cancer [37], and considering the large number of P-cadherin positive feline mammary tumours [16,38] this molecule may constitute a potential therapeutic target in this species too. Therefore, an in vivo model that expresses P-cadherin is fundamental to study the potential anti-P-cadherin therapy in feline mammary tumours.
The in vitro and in vivo model exposed herein, with co-expression of E- and P-cadherin as well as catenins, might be useful to study the role of these molecules in FMC development, progression and clinical approach.
The authors would like to acknowledge doctor Professor Sasaki, of the Laboratory of Veterinary Surgery, University of Tokyo, Japan, and all his team for kindly provided us the feline tumour cell line and all support in this field. The authors would like to acknowledge doctor Joana Paredes, doctor Ana Sofia Ribeiro and doctor André Ribeiro for the important scientific discussion. We thank the technical staff of the Laboratory of Veterinary Pathology of Institute of Biomedical Sciences Abel Salazar of the University of Porto for the precious technical support.
The Portuguese Foundation for Science and Technology (FCT) supports ACF (Ph.D. grant SFRH/BD/69493/2010) and CG (Postdoctoral grant SFRH/ BPD/ 96510/ 2013). IPATIMUP integrates the i3S Research Unit, which is partially supported by FCT. This work is funded by FEDER funds through the Operational Programme for Competitiveness Factors-COMPETE and National Funds through the FCT, under the projects "PEst-C/SAU/LA0003/2013" and “PTDC/CVT/117610/2010”. The funders had no role in study design, data collection and analysis, decision to publish, or preparation of the article.
The Authors declare that they have no competing interests in regard to this study.
- Takeichi M (1990) Cadherins: a molecular family important in selective cell-cell adhesion. Annu Rev Biochem 59: 237-252. [Crossref]
- Pećina-Slaus N (2003) Tumor suppressor gene E-cadherin and its role in normal and malignant cells. Cancer Cell Int 3: 17. [Crossref]
- Paredes J, Milanezi F, Viegas L, Amendoeira I, Schmitt F (2002) P-cadherin expression is associated with high-grade ductal carcinoma in situ of the breast. Virchows Arch 440: 16-21. [Crossref]
- Nollet F, Kools P, Van Roy F (2000) Phylogenetic analysis of the cadherin superfamily allows identification of six major subfamilies besides several solitary members. J Mol Biol 299: 551-572. [Crossref]
- Palacios J, Benito N, Pizarro A, Suarez A, Espada J, et al. (1995) Anomalous expression of P-cadherin in breast carcinoma. Correlation with E-cadherin expression and pathological features. Am J Pathol 146: 605-612. [Crossref]
- Berx G, Van Roy F (2001) The E-cadherin/catenin complex: an important gatekeeper in breast cancer tumorigenesis and malignant progression. Breast Cancer Res 3: 289-293. [Crossref]
- Nollet F, Berx G, van Roy F (1999) The role of the E-cadherin/catenin adhesion complex in the development and progression of cancer. Mol Cell Biol Res Commun 2: 77-85. [Crossref]
- Paredes J, Correia AL, Ribeiro AS, Schmitt F (2007) Expression of p120-catenin isoforms correlates with genomic and transcriptional phenotype of breast cancer cell lines. Cell Oncol 29: 467-476.
- Talvinen K, Tuikkala J, Nykänen M, Nieminen A, Anttinen J, et al. (2010) Altered expression of p120catenin predicts poor outcome in invasive breast cancer. J Cancer Res Clin Oncol 136: 1377-1387. [Crossref]
- Albergaria A, Ribeiro AS, Vieira AF, Sousa B, Nobre AR, et al. (2011) P-cadherin role in normal breast development and cancer. Int J Dev Biol 55: 811-822. [Crossref]
- Paredes J, Correia AL, Ribeiro AS, Albergaria A, Milanezi F, et al. (2007) P-cadherin expression in breast cancer: a review. Breast Cancer Res 9: 214. [Crossref]
- Martín De Las Mulas J, Reymundo C (2000) Animal models of human breast carcinoma: canine and feline neoplasms. Revista de Oncología 2:274-281.
- Misdorp W, Weijer K (1980) Animal model of human disease: breast cancer. Am J Pathol 98: 573-576. [Crossref]
- Zappulli V, De Zan G, Cardazzo B, Bargelloni L, Castagnaro M (2005) Feline mammary tumours in comparative oncology. J Dairy Res 72: 98-106. [Crossref]
- Penafiel-Verdu C, Buendia AJ, Navarro JA, Ramirez GA, Vilafranca M, et al. (2012) Reduced expression of E-cadherin and ß-catenin and high expression of basal cytokeratins in feline mammary carcinomas with regional metastasis. Vet Pathol 49:979-987. [Crossref]
- Figueira AC, Teodósio AS, Carvalheira J, Lacerda M, de Matos A, et al. (2012) P-cadherin expression in feline mammary tissues. Vet Med Int 2012: 687424. [Crossref]
- Buendia AJ, Penafiel-Verdu C, Navarro JA, Vilafranca M, Sanchez J (2014) N-cadherin expression in feline mammary tumors is associated with a reduced E-cadherin expression and the presence of regional metastasis. Vet Pathol 51: 755-758.
- Dias Pereira P, Gärtner F (2003) Expression of E-cadherin in normal, hyperplastic and neoplastic feline mammary tissue. Vet Rec 153: 297-302. [Crossref]
- Uyama R, Hong SH, Nakagawa T, Yazawa M, Kadosawa T, et al. (2005) Establishment and characterization of eight feline mammary adenocarcinoma cell lines. J Vet Med Sci 67: 1273-1276. [Crossref]
- Azar HA, Hansen CT, Costa J (1980) N:NIH(S)-nu/nu mice with combined immunodeficiency: a new model for human tumor heterotransplantation. J Natl Cancer Inst 65: 421-430. [Crossref]
- De Oliveira JT, De Matos AJ, Santos AL, Pinto R, Gomes J (2011) Sialylation regulates galectin-3/ligand interplay during mammary tumour progression--a case of targeted uncloaking. Int J Dev Biol 55: 823-834. [Crossref]
- Misdorp W, Else RW, Hellmén E, Lipscomb TP (1999). Histological Classification of Mammary Tumors of the Dog and the Cat., Washington, D.C. USA, WHO, Armed Forces Institute of Pathology, American Registry of Pathology.
- Elston CW, Ellis IO (1998) Assessment of histological grade. In: ELSTON, C. W. & ELLIS, I. O. (eds.) The Breast. Systemic pathology. Third Edition ed. Edinburgh: Churchill-Livingstone.
- Muleya JS, Nakaichi M, Sugahara J, Taura Y, Murata T, et al. (1998) Establishment and characterization of a new cell line derived from feline mammary tumor. J Vet Med Sci 60: 931-935. [Crossref]
- Adelfinger M, Gentschev I, Grimm de Guibert J, Weibel S, Langbein-Laugwitz J, et al. (2014) Evaluation of a new recombinant oncolytic vaccinia virus strain GLV-5b451 for feline mammary carcinoma therapy. PLoS One 9: e104337. [Crossref]
- Minke JM, Schuuring E, Van Den Berghe R, Stolwijk JA, Boonstra J, et al. (1991) Isolation of two distinct epithelial cell lines from a single feline mammary carcinoma with different tumorigenic potential in nude mice and expressing different levels of epidermal growth factor receptors. Cancer Res 51: 4028-4037.
- Kim JB, O'Hare MJ, Stein R (2004) Models of breast cancer: is merging human and animal models the future? Breast Cancer Res 6: 22-30. [Crossref]
- Gilles C, Polette M, Mestdagt M, Nawrocki-Raby B, Ruggeri P, et al. (2003) Transactivation of vimentin by beta-catenin in human breast cancer cells. Cancer Res 63: 2658-2664. [Crossref]
- Ribeiro AS, Albergaria A, Sousa B, Correia AL, Bracke M, et al. (2010) Extracellular cleavage and shedding of P-cadherin: a mechanism underlying the invasive behaviour of breast cancer cells. Oncogene 29: 392-402. [Crossref]
- Price JE, Polyzos A, Zhang RD, Daniels LM (1990) Tumorigenicity and metastasis of human breast carcinoma cell lines in nude mice. Cancer Res 50: 717-721. [Crossref]
- Iorns E1, Drews-Elger K, Ward TM, Dean S, Clarke J, et al. (2012) A new mouse model for the study of human breast cancer metastasis. PLoS One 7: e47995. [Crossref]
- Nguyen DX, Bos PD, Massagué J (2009) Metastasis: from dissemination to organ-specific colonization. Nat Rev Cancer 9: 274-284. [Crossref]
- Paredes J, Stove C, Stove V, Milanezi F, Van Marck V, et al. (2004) P-cadherin is up-regulated by the antiestrogen ICI 182,780 and promotes invasion of human breast cancer cells. Cancer Res 64: 8309-8317. [Crossref]
- Ribeiro AS, Sousa B, Carreto L, Mendes N, Nobre AR, et al. (2013). P-cadherin functional role is dependent on E-cadherin cellular context: a proof of concept using the breast cancer model. J Pathol 229: 705-718. [Crossref]
- Paredes J, Correia AL, Ribeiro AS, Milanezi F, Cameselle-Teijeiro J (2008) Breast carcinomas that co-express E- and P-cadherin are associated with p120-catenin cytoplasmic localisation and poor patient survival. J Clin Pathol 61: 856-862.
- Novosad CA (2003) Principles of treatment for mammary gland tumors. Clin Tech Small Anim Pract 18: 107-109. [Crossref]
- Bernardes N, Ribeiro AS, Abreu S, Mota B, Matos RG, et al. (2013) The bacterial protein azurin impairs invasion and FAK/Src signaling in P-cadherin-overexpressing breast cancer cell models. PLoS One 8: e69023. [Crossref]
- Figueira AC, Gomes C, de Oliveira JT, et al. (2014) Aberrant P-cadherin expression is associated to aggressive feline mammary carcinomas. BMC Vet Res 10: 270. [Crossref]


