Abstract
A series of half-sandwich ruthenium complexes, two containing an arene face-cap and the other a thiacrown ether face-cap were synthesized to investigate the necessity of the arene for anticancer activity in this class of compounds. The complexes are formulated as [(h6-p-cymene)Ru(dmabTSC)Cl]PF6, [(h6-benzene)Ru(dmabTSC)Cl]PF6 (arene complexes), and [([9]aneS3(dmabTSC)Cl]PF6 (dmabTSC = dimethylaminobenzaldehye thiosemicarbazone). It was observed that none of the complexes showed good anticancer activity in vitro against HCT-116 and Caco-2 (colon adenocarcinoma) cells. All three complexes can bind strongly to calf-thymus DNA with binding constants on the order of 105 M-1. In addition they all bind strongly to human serum albumin with binding constants between 105 and 106 M-1. There appears to be a single binding site on the protein for these complexes. A computational investigation of these complexes and their hydrolysis products was carried out by molecular docking with DNA and topoisomerase II. From this analysis it is noted that the type of face-capping ligand had different effects on the two macromolecules. It is therefore noted that the knowledge gained from this study will be useful in identifying the type of complexes in this class that show useful metallodrug potential.
Key words
anticancer, computational, human serum albumin, protein binding, ruthenium, thiosemicarbazone
Introduction
Over the last decade or so half-sandwich organometallic ruthenium complexes of the type [(arene)Ru(LL)Cl][X] or [(arene)Ru(L)(L)Cl][X] (Figure 1), have been generating significant interest as potential antitumor complexes [1-7]. These piano-stool complexes exhibit ligand exchange kinetics and generally different chemical reactivity when compared to the classical coordination complexes that are in various phases of clinical trials [8,9]. They also offer a novel structural motif which could prove useful in designing new drugs that have a wealth of variety in structure and hopefully in biological activity.
Figure 1. General structure of the anticancer organometallic ruthenium(II) complexes currently being studied.
Figure 1 suggest two obvious variations–the “seat” of the piano-stool (or the arene) and the “legs” of the stool (or the ligand (LL) system). In original reports it was proposed that a more hydrophobic arene ligand and a single exchange site (the other two coordination sites being occupied by a stable bidentate chelating ligand), are associated with high in vitro cytotoxicity [4,10]. Complexes that lacked NH groups on the coordinated ligand were often inactive. It was thought that the stereospecific H-bonding could optimize DNA recognition [11]. Likewise, it was proposed that arenes with extended ring structures were more carcinostatic as a result of being better able to intercalate into DNA. So for a series of similar complexes cytotoxicity was in the order benzene < p-cymene < biphenyl < dihydroanthracene < tetrahydroanthracene. Through recent studies however, it has emerged that the structure-activity relationship is more complex. A wide variety of chelating ligand systems have been used to create cytotoxic complexes [11]. Thiosemicarbazones [6,7,12], pyrones [13,14], phenanthroimidazoles [15], and 1,3,5-triaza-7-phosphadamantane, pta [3], are a small sample of such ligand systems. In fact the RAPTA complexes [3] may be sufficiently distinctive from the other piano-stool complexes as they have two potential ligand exchange sites. These complexes have been considered as anti-metastatic agents [16,17] as opposed to anticancer agents.
Variations in the types of face-caps for the complexes have not been as extensively studied. As mentioned above it is generally thought that a more lipophilic arene enhances cytotoxicity. Using a non-arene face-capping ligand has rarely been explored. Of the potential ligands, 1,4,7-trithiacyclononane ([9]aneS3) has been the most attractive. Alessio [18-20] have developed a series of non-organometallic piano-stool complexes based on this ligand. When compared to [(h6-biphenyl)Ru(en)Cl]PF6 the one complex that showed any activity [([9]aneS3)Ru(en)Cl][CF3SO3], was an order of magnitude less in terms of anti-proliferative activity [18]. Still the authors suggest that the thiacrown ligand would be a suitable substitute for the arene as a face-capping in these piano-stool complexes.
In an effort to further investigate if the arene is required for anticancer activity in these half-sandwich ruthenium complexes, we have synthesized three complexes containing either an arene or [9]aneS3 face-capping ligand and a bidentate thiosemicarbazone chelating ligand (Figure 2).
Figure 2. Proposed structure of the complexes synthesized in the study
Material and methods
Physical measurements
Analytical or reagent grade chemicals were used throughout. All the chemicals including solvents were obtained from Sigma-Aldrich or other commercial vendors and used as received. Microanalyses (C, H, N) were performed by Columbia Analytical, (Tucson, AZ) or by Galbraith Laboratories, (Knoxville, TN). The 1H and 13C NMR spectra were acquired on a Varian Unity 400 MHz NMR. Samples were dissolved in DMSO-d6 and spectra were acquired at 25° C. The residual protons present in DMSO-d6 (2.50 ppm) were used as internal references. Normal IR spectra in the range 4000–500 cm-1 were obtained using KBr pellets or using the ATR accessory on a Nicolet 6700 FTIR spectrophotometer. For the metal complex-HSA (HSA is human serum albumin) interaction experiments, a Perkin-Elmer Spectrum 100 spectrometer with a UATR accessory containing a diamond-ZnSe crystal was used. (Peaks are defined as w=weak and b=broad). Cyclic voltammetric (CV) data were collected on a Bioanalytical Systems Inc. Epsilon workstation on a C3 cell stand at 296 K. DMSO solutions (1 x 10⁻³ M) containing 0.1 M tetrabutylammonium hexafluorophosphate were saturated with nitrogen for 15 minutes prior to each run. A blanket of nitrogen gas was maintained throughout the measurements. The measurements were carried out with a three-electrode system consisting of a platinum working electrode, a platinum wire auxiliary electrode and a Ag/AgCl reference electrode. Ferrocene was used as an internal standard. The working electrode was polished before each experiment with alumina slurry. Absorption spectra were recorded on an Agilent 8453A spectrophotometer. Fluorescence spectra were recorded on a Varian Cary Eclipse or on a Perkin Elmer LS-50B spectrophotometer. One of the metal complexes was synthesized using a Discover S-Class microwave reactor (CEM, Matthews, USA). ESI MS spectra were acquired via positive electrospray ionization on a Bruker 12 Tesla APEX –Qe FTICR-MS with and Apollo II ion source. Samples were first dissolved in methanol, and then the solution was introduced by direct injection using a syringe pump with a flow rate of 2 ml s-1. The data was processed using Bruker Daltonics Data Analysis Version 3.4.
X-ray single-crystal data was determined at room temperature due to the crystal’s instability upon cooling in the cryo-stream flow. A suitable clear dark red-brown plate-like single crystal of the compound was selected and with the help of vacuum grease mounted on a thin galls fiber attached to the copper-pin positioned on the goniometer head of the Bruker APEX 2 diffractometer equipped with a SMART CCD area detector. The intensity data were collected in w scan mode using the Mo tube (Ka radiation; l = 0.71073 Å) with a highly oriented graphite monochromator. Intensities were integrated from 4 series of 364 exposures, each covering 0.5o in w at 20 seconds of acquisition time, with the total data set being a sphere [21]. The space group determination was done with the aid of XPREP software [21]. The absorption correction was performed by the numerical method using the set of images obtained from the video-microscope and using the SADABS program from Bruker AXS software package [22]. The structure was solved by direct methods and refined by least squares on weighted F2 values for all reflections using the SHELXTL program.
Syntheses
The ligand (dmabTSC) was synthesized as previously described.[23] The ruthenium dimers, [(h6-C6H6)RuCl2]2 and [(h6-C10H14)RuCl2]2,[24] as well as [[9]aneS3)RuCl2(DMSO)],[25] were synthesized as described in the literature.
Synthesis of [(C6H6)Ru(dmabTSC)Cl]PF6, 1. In a 35-mL microwave reaction vessel, [(C6H6)RuCl2]2 (200 mg, 0.400 mmol) and dmabTSC (183 mg, 0.823 mmol), was suspended in 15 cm3 of methanol. The brown-orange suspension was degassed for 10 minutes using argon. The reaction mixture was heated using the following method: temperature = 67°C, power = 225 W, maximum pressure = 250 psi and time = 10 minutes. At the end of the reaction time a blood-red mixture had formed. Addition of 5 cm3 of a saturated aqueous solution of NH4PF6 produced an orange-brown suspension which was filtered. The solid was washed with water and ether and air-dried to give a rust-red solid (93%). Elemental analysis for C16H20ClF6N4PRuS (found/calc.): C 32.57/33.02, H 3.34/3.46, N 9.65/9.63. IR (cm-1): 3307(b,w), 3179(b,w), 3088(w), 2982, 2883(w), 1630, 1570(w), 1547, 1440, 1246, 1004(b), 833, 711, 644. 1H NMR (400 MHz, DMSO-d6) d ppm 9.67 (s, 1 H, NH), 8.68 (s, 1H, NH-C=S); 8.19 (3 H, m); 6.69(dd, 2H1,5, ArH); 6.55(d, 2H2,4, J = 9.4 Hz, CH) 6.08 and 6.27 (m, 6H11-16, CH); 6.69(dd, 2H1,5, ArH) 4.85 (br. s. 2 H, NH2); 3.04(s, 3H10, CH3); 3.02(s, 3H9, CH3). 13C NMR (101MHz, DMSO-d6, d ppm): 176.9, 173.0 (C-8), 158.0 (C-7), 151.8 (C-3), 134.7 (C-6), 121.5 (C-1, 5), 111.1 (C-10, 12), 92.4 and 89.8 (C-11-16), 29.32 (C-9, 10).
Synthesis of [(C10H14)Ru(dmabTSC)Cl]PF6, 2. The ruthenium dimer, [(C10H14)RuCl2]2, 200 mg (0.326 mmol) was dissolved in 10 cm3 of methanol and the solution degassed with argon for 15 minutes. The solid dmabTSC (145 mg, 0.652 mmol) was added to the orange metal solution and the reaction mixture stirred at room temperature for 2h. To the resulting red solution, 10 cm3 of a saturated aqueous solution of KPF6 was added and the reaction mixture stirred for a further 1½ h. The orange-red suspension was filtered and the solid obtained was washed with water and ether and air-dried to give an orange-red solid (77%). Elemental analysis for C20H28ClF6N4PRuS (found/calc.): C 38.04/37.65, H 3.99/4.42, N 8.66/8.78. IR (cm-1): 3634(w), 3562(w), 3472, 3368, 3296, 3166(b), 2971, 2931, 2875, 2811, 1733 (w,b), 1603, 1565, 1525, 1475, 1448, 1438, 1369, 1320, 1227, 1190, 1170, 1126, 1059(w), 1027, 945, 878, 833, 644. 1H NMR (400 MHz, DMSO-d6) d ppm 9.67 (s, 1 H, NH), 8.69 (s, 1H, H-C=N); 7.71 (d, 2H2,4, J = 8.6 Hz, CH), 7.66 (dd, 2H, J = 8.9 Hz, J = 9.0 Hz, NH2); 6.72 (m, 2H1,5, CH); 6.14 (d, 1H11, J = 5.8 Hz, CH); 6.04 (d, 1H12, J = 5.8 Hz, CH); 5.90 (d, 1H14, J = 6.1 Hz, CH); 5.82 (d, 1H15, J = 5.8 Hz, CH), 3.03 (m, 6 H, (CH3)2), 2.75 (m, 1 H, CH), 2.29 (3 H, CH3), 1.19 (t, 3 H, J=6.5 Hz, CH3), 1.00 (t, 2 H, J=6.49 Hz, CH3). 13C NMR (101 MHz, DMSO-d6, d ppm): 176.9 (C-8), 157.0 (C-7), 151.6 (C-6), 134.7 (C-3), 129.6 (C-4, C-5), 126.0 (C-1, C-2), 106.3 (C-13), 105.4 (C-16), 91.3 (C-15), 89.7 (C-11), 87.6 (C-14), 82.7 (C-12), 31.2 (C-17), 23.9 (C-18), 21.7 (C-19), 18.6 (C-20)
Synthesis of [([9]aneS3)Ru(dmabTSC)Cl]PF6×0.5C4H10O, 3. The ruthenium starting compound [([9]aneS3)RuCl2(DMSO)] (100 mg, 0.232 mmol) and the dmabTSC (62 mg, 0.278 mmol) along with NH4PF6 (2 equivalents) was partially dissolved in 20 cm3 of methanol. Under argon the reaction mixture was heated at reflux for 1½ h. The orange-yellow suspension that resulted was filtered and the solid washed with water and ether and air-dried to give a yellow solid (66%). Elemental analysis for C18H31ClF6N4O0.5PRuS4 (found/calc.): C 29.57/29.98, H 4.00/4.33, N 8.15/7.77. IR (cm-1): 3637(w), 3466(w), 3360(w), 3166(b), 2982, 2886, 2162, 2034(vw), 1973(vw), 1603, 1523, 1451, 1411(w),1366, 1318, 1187, 1169, 1128(w), 1075, 1025, 945, 910, 833, 644. 1H NMR (400 MHz, DMSO-d6, δ ppm): 12.03(s, 1H, NH); 8.93-8.88(m, 2H, NH2); 7.97(s, 1H, H-C=N); 7.65(dd, 2H10,14, J = 9.0 Hz, J = 8.9 Hz, CH); 6.71- 6.82(m, 2H11,13, CH); 2.95-3.03(m, 6H15,16, CH3); 2.55-2.89(m, 12H1-6, CH2). 13C NMR (100 MHz, DMSO-d6, δ ppm): 177.28 (C-7), 173.45 (C-7); 151.93 (C-12); 147.42 (C-8); 133.94 (C-9); 129.24; 120.11 (C-10, C-14); 111.54 (C-11, C-13); 31.56 - 34.71 (C1-C6), 30.58 (C-15, C-16)
Cell culture
Cell lines included two human colon cancer cells: HCT116 (human colon carcinoma) and Caco-2 (human epithelial colorectal adenocarcinoma). In addition, normal human colon cells CCD-18Co (human colon fibroblasts), were included. All cell lines were obtained from the American Type Culture Collection (ATCC, Rockville, MD, USA) and maintained at the University of Rhode Island. Caco-2 cells were grown in Eagle's minimal essential medium (EMEM) supplemented with 10% v/v fetal bovine serum, 1% v/v nonessential amino acids, 1% v/v L-glutamine and 1% v/v antibiotic solution (Sigma). HCT-116 cells were grown in McCoy’s 5a medium supplemented with 10% v/v fetal bovine serum, 1% v/v nonessential amino acids, 2% v/v HEPES ((4-(2-hydroxyethyl)-1-piperazineethanesulfonic acid) and 1% v/v antibiotic solution. CCD-18Co cells were grown in EMEM medium supplemented with 10% v/v foetal bovine serum, 1% v/v nonessential amino acids, 1% v/v L-glutamine and 1% v/v antibiotic solution and were used from population doubling levels (PDL) = 26 to PDL = 35 for all experiments. Cells were maintained at 37ºC in an incubator under a 5% CO2/95% air atmosphere at constant humidity and maintained in the linear phase of growth. The pH of the culture medium was determined using pH indicator paper (pHydrionTM Brilliant, pH 5.5-9.0, Micro Essential Laboratory, NY, USA) inside the incubator. All of the test samples were solubilized in DMSO (<0.5 % in the culture medium) by sonication and were filter sterilized (0.2 μm) prior to addition to the culture media. Control cells were also run in parallel and subjected to the same changes in medium with 0.5 % DMSO.
Cytotoxicity assay: The assay was carried out as described previously [26] to measure the IC50 values for samples. Briefly, the in vitro cytotoxicity of samples were assessed in tumor cells by a tetrazolium-based colorimetric assay, which takes advantage of the metabolic conversion of MTS [3-(4,5-dimethylthiazol-2-yl)-5-(3-carboxymethoxyphenyl)-2-(4-sulfenyl)-2H-tetrazolium, inner salt] to a reduced form that absorbs light at 490 nm. Cells were counted using a haemocytometer and were plated at 2,000 to 5,000 cells per well, depending on the cell line, in a 96-well format for 24 h prior to drug addition. Test samples and a positive control, etoposide 4 mg/ cm3 (Sigma), were solubilized in DMSO by sonication. All samples were diluted with media to the desired treatment concentration and the final DMSO concentration per well did not exceed 0.5%. Control wells were also included on all plates. Following a 24 h, 48 h or 72 h drug-incubation period at 37°C with serially diluted test compounds, MTS, in combination with the electron coupling agent, phenazine methosulfate, was added to the wells and cells were incubated at 37˚C in a humidified incubator for 3 h. Absorbance at 490 nm (OD490) was monitored with a spectrophotometer (SpectraMax M2, Molecular Devices Corp., operated by SoftmaxPro v.4.6 software, Sunnyvale, CA, USA) to obtain the number of surviving cells relative to control populations. The results are expressed as the median cytotoxic concentrations (IC50 values) and were calculated from six-point dose response curves using 4-fold serial dilutions. Each point on the curve was tested in triplicate. Data are expressed as mean ± SE for three replicates on each cell line.
DNA-interaction studies
All the experiments involving the interaction of the complexes with DNA were carried out in TRIS buffer (5 mM Tris, 50 mM NaCl, pH 7.20). Stock solutions of ct-DNA were prepared by dissolving commercial nucleic acids in buffer and stored at 4°C for 24 h. The stock DNA solution was diluted appropriately and the concentration of the diluted solutions (per nucleotide phosphate) was determined spectrophotometrically using the molar absorption coefficient of 6600 M-1 cm-1 at 260 nm [27]. The purity of the solutions was checked by observing a ratio of ³ 1.8 [28]. The DNA stock solutions were stored at 4°C and used within 4 days after their preparation. Doubly purified water used in all experiment was from a Milli-Q system.
Absorbance titration experiments: Spectroscopic titrations were carried out at room temperature to investigate the binding between the complexes and ct-DNA. A constant concentration of the complexes (1.0 x 10⁻⁵ M) was treated with aliquots of a stock concentrated solution of the DNA in a 1-cm quartz cell. A reference cell without the metal complexes was titrated in a similar manner simultaneously.
Fluorescence titration experiments: In the ethidium bromide (EB) fluorescence displacement experiment, a buffered solution that is 10 mM DNA pre-treated with a saturating amount EB (0.33 mM, [29]) was titrated with a concentrated solution of the complex. After each addition, the solution was stirred at the appropriate temperature for 5 minutes before the fluorescence measurement was taken by exciting at 520 nm and measuring the emission spectra from 530-700 nm. Temperature was controlled using a single-cell Peltier accessory.
Viscosity measurements: Viscosity studies were done using a Cannon-Manning semi micro-dilution viscometer (type 75, Cannon Instruments Co., State College, PA, USA) in a thermostatted water bath maintained at 30.0 ± 0.1°C. The viscosity for a DNA solution (100) was measured in the presence and absence of the metal complexes (0–80 mM). Data are presented as (h/h0)1/3 versus 1/R, where R = [DNA]/[complex], h is the viscosity of DNA in the presence of the complex and h0 is the relative viscosity of DNA alone. Relative viscosity values were calculated using the expression h0 = (t–t0)/t0. In this expression, t is the flow time of the DNA solution and t0 is the flow time of the buffer. The flow time of each sample was measured three times and an average flow time was used.
Chemical nuclease activity: The DNA unwinding and cleavage ability of the complexes was evaluated by agarose gel electrophoresis of supercoiled pBR322 DNA. Samples of pBR322 DNA (0.1 mg/mL) were incubated with the complexes (10 to 200 mM) in TRIS (Tris(hydroxymethyl)aminomethane) buffer (50 mM Tris, 18 mM NaCl, pH 7.2) at room temperature for 1h in the dark or subjected to 365 nm light. The reactions were quenched by addition of 3 mL of loading buffer (0.25% bromophenol blue and 15% Ficoll in water). Samples of the reaction mixtures were then loaded onto a 1% agarose gel in TBE buffer (89 mM Tris, 89 mM boric acid, 2 mM EDTA, pH 8.2). The gels were subjected to electrophoresis for 1 h at 70 V, followed by staining with 0.5 mg/ cm3 ethidium bromide for 30 minutes. The bands on the gel were visualized under UV light and photographed using a GEL Logic 440 Imaging System with a Kodak Molecular Imaging Software.
Interaction with human serum albumin
Fluorescence titration: For the fluorescence titration experiments, a 3 mM solution of HSA was titrated with various amounts of a concentrated solution of the complex. The complex concentration ranged from 0–30 mM. After each addition, the mixture was stirred for 15 seconds and allowed to sit at the appropriate temperature for 5 minutes before measurement. The fluorescence spectra of the solutions were obtained by exciting at 295 nm and measuring the emission spectra from 300-450 nm. The measurements were done at ambient temperature.
Infrared measurements: The HSA and the complex solutions, mixed in a 1:1 molar ratio, were incubated for 48 h prior to measurement. The infrared spectra of HSA, HSA plus the complex (1:1 molar ratio) and the complex alone were recorded.
Results and discussion
Synthesis and characterization
The thiosemicarbazone used in this study has been previously reported [23]. Complex 1 was synthesized according to a novel microwave-enhanced reaction from [Ru(benzene)Cl2]2 by reaction with two equivalents of the thiosemicarbazone in methanol followed by addition of an aqueous solution of ammonium hexafluorophosphate. This complex was obtained as a rust-red solid. Complex 2 was obtained as an orange-red solid from the room-temperature reaction of the thiosemicarbazone with [Ru(cymene)Cl2]2 in methanol. Based on elemental analysis and spectroscopic data we propose that these complexes are best formulated as [(h6-arene)Ru(dmabTSC)Cl]PF6 (Figure 2). Complex 3 with the proposed formula [(9aneS3)Ru(dmabTSC)Cl]PF6 was obtained by refluxing [(9aneS3)RuCl2(dmso)] with the thiosemicarbazone in ethanol. (Incidentally we could synthesize [(9aneS3)Ru(dmabTSC)Cl]Cl, 3b, similarly without using the hexafluorophosphate ion. To avoid the variation in counter-ion, this particular compound was not studied and is included only for it’s and mass spectrometric spectrum). Like 1 and 2, the yellow solid 3 was quite soluble in acetone, DMSO and CH2Cl2 but slightly less so in alcohols. The stability of the complexes in methanol was investigated by monitoring their UV-Vis spectra over time (Figure S1 ESI). The complexes behave differently with only 3 showing distinct changes, with shifting of spectral features, after 24 hours. Complexes 1 and 2 showed only hypochromic changes over this time period.
The 1H NMR spectra were acquired for 1, 2 and 3 in DMSO-d6 as all complexes showed good solubility in this solvent. The complexes show many similarities in the 1H NMR spectra attributed to the conserved dmabTSC ligand,[23] with the major differences arising from the variation of the coordinated arene moiety. Coordination of the dmabTSC ligand to the metal center was confirmed due to the generally observed upfield shift (D d = 1.51 ppm for 1 and 2) of the resonance of the azomethine proton, compared to the free uncoordinated ligand [23]. Complex 3 show a downfield shift of 0.85 ppm, possibly indicating that the face-capping ligand have an impact on the spectroscopic properties of the complexes. Additionally, the 13C NMR spectra for all compounds show a general upfield shift for the two primary low-field signals attributed to the thioketo (C=S) and azomethine (C=N) indicating coordination via an N,S-binding mode [23]. While these features are well conserved between the spectra of the presented compounds major differences are visible due to the variation in the arene system utilized. For instance, the 1H NMR spectrum of 1 shows resonances from the benzene arene moiety at δ = 6.07–6.26 ppm, whereas the incorporation of the p-cymene arene functionality in 2 leads to the loss of the twofold symmetry of the arene ligand and the appearance of four sets of doublets in the range of δ = 5.82–6.15 [30-32]. Additionally, 2 shows resonances for two inequivalent methyl groups δ = 1.15 and 1.21 ppm, a result previously observed by Halbach et al. [33]. The peaks for the [9]aneS3 macrocyclic ring of 3 are second order, and thus it is difficult to determine whether there are multiple sets of peaks for the thioether group. Integration values indicate the chemical shifts for the [9]aneS3 ligand occurred between δ = 2.55 and 2.89 ppm, a similar shift range was previously reported by Goodfellow et al. [25]. Additionally, this complex exhibits a resonance for the hydrazinic proton downfield at approximately d = 12.0 ppm. Using the analysis by Afrasiabi [34], it can be determined that the dmabTSC ligand under our conditions exists in the Z form. Coupled with the lack of a resonance shift signal at δ = 4.0 attributable to –SH proton resonance, we can say the ligand in the complexes exists in the thione form.
The proposal that the thiosemicarbazone ligand coordinates as the thione tautomer in the solid state of all three complexes is also suggested by the infrared spectroscopic data for the complexes. The amine region (3400-3100 cm-1) shows three broad and weak peaks; these of course correspond to the amine and hydrazinic hydrogens [23]. One would have expected the hydrazinic hydrogen (near 3150 cm-1) would have been absent had the thiol tautomer (as the ionic form) been the coordinated species. The coordination through the azomethine nitrogen and the thione sulfur is also obvious in the infrared spectra as the ν(C=N) and C-S bands of the thiosemicarbazone shifts (to higher energies relative to the free ligand) on coordination.
High resolution electrospray ionization mass spectra were acquired for 1, 2, and 3b (Figure S2, ESI). We have assigned M as the metal complex in absence of any solvates in all the mass spectral analyses. The results obtained correspond to the expected structural formulas. The m/z value of 401.036654 which is detected for 1 in the mass spectrometer indicates that during ionization, in combination with the loss of the PF6- and Cl- counter-ions, deprotonation of a proton ensues after the tautomerization of the coordinated thiosemicarbazone’s hydrazinic N(2)-H proton (Fig. S3, ESI). This leads to the formation of the anionic thiolate form of the thiosemicarbazone ligand coordinated to the ruthenium (II) metal center of 1, where the calculated exact mass of the singly charged cation = 401.037 g mol-1. Just like the 1 cation, 2 and 3b formed the singly charged cation which was detected as m/z = 457.099190 and 503.000116 respectively. The calculated exact mass of the singly charged cations were 457.100 and 503.000 g mol-1 respectively.
The electrochemical (cyclic voltammetry) behavior of the complexes has been studied in DMSO using a variety of scan rates ranging from 100 to 500 mV/s. Tetrabutylammonium hexafluorophosphate was used as the supporting electrolyte. Complexes 1 and 2 with their somewhat similar structures showed similar features in the investigated sweep range (0–2.0 V). There is one irreversible oxidation wave (Epa = 1.09 V and 1.00 V for 1 and 2 respectively) (Fig. S4, ESI) corresponding to the Ru(II)/Ru(III) couple. This peak becomes less pronounced as scan rate is increased and moves to 1.11V concurrently. This Ru-centered oxidation is irreversible even up to a scan rate of 500 mV s-1. This pattern of behavior is similar to what we have observed for similar complexes bearing a p-cymene or benzene arene cap [6,7,30,35]. For such complexes Epa values range from 1.02 V to 1.11 V. Complex 3 had an irreversible oxidation at 0.91 V with an additional, though less defined peak, at 1.34 V.
X-ray analysis
In an attempt to grow crystals of 2, the mother liquor from the isolation step was left to slowly evaporate. The small crystals that resulted were subjected to X-ray analysis resulting in a unique dimeric structure. We propose that as the solvent evaporated from the mother liquor, the concentration of the residual complex increased. Hydrolysis of the complex resulted as a consequence of the large amount of water present followed by tautomerization of the coordinated thiosemicarbazone ligand to generate the thiol form. This tautomerization could be facilitated by basic species in the medium (likely methoxide from methanol). Dimerization then occurred to satisfy the valency requirements of the metal center (Fig. S5, ESI). (The formation of a similar dimeric species at high concentration has been previously reported [36].) This process could be aided by the fact that the N,N'-diethylamino-group attached to the thiosemicarbazide fragment is strongly electron-donating group. So, electron density in the whole organic ligand is redistributed to favor the thiol structure upon complexation. In such thiol structure there is well known propensity to form dimers because there is an excess of electron density at sulfur center. In addition the C-S distance is longer which allows less steric repulsion.
The crystal structure of the dimeric Ru(II) complex was determined at room temperature due to the crystal’s instability upon cooling in the cryo-stream cold N2 flow. Crystal and refinement data are presented in Table 1, while selected bond lengths and valence angles are shown in the electronic supplementary information. Careful inspection of crystalline specimen of the Ru(II) dimeric complex under the microscope using polarized light did not indicate an obvious twinning. Nevertheless, after data collection, a series of 160 frames obtained from 4 different orientation runs allowed harvesting of 702 strong reflections with I>20s(I), which were subjected to testing using the CELL_NOW program [21]. The output produced the figure of merit (FOM) equal to 0.932, with all 702 reflections nicely indexed in one monoclinic cell with b=116.616(2)o. The XPREP suggested the centro-symmetric C2/m space group #12 based on the analysis of 5946 unique reflections and |ExE-1| = 0.962 at I/s =5.67. The choice of the group was confirmed using the PLATON program [37]. The crystal structure has been deposited into the CCDC (#992015).
Table 1. Crystal data and structure refinement for [(C10H14)Ru(dmabTSC)]2(PF6)2
Chemical formula |
C40H54F12N8P2Ru2S2 |
Formula weight |
1203.11 |
Temperature |
296(2) K |
Wavelength |
0.71073 Å |
Crystal size |
0.196 x 0.222 x 0.432 mm |
Crystal habit |
clear dark red-brown plate |
Crystal system |
Monoclinic |
Space group |
C 1 2/m 1 |
Unit cell dimensions |
a = 14.140(2) Å
b = 32.808(5) Å
c = 12.7477(18) Å |
α = 90°
β = 116.616(2)°
γ = 90° |
Volume |
5287.0(13) Å3 |
|
Z |
4 |
Density (calculated) |
1.512 g/cm3 |
Absorption coefficient |
0.789 mm-1 |
F(000) |
2432 |
Theta range for data collection |
1.2 to 27.2° |
Index ranges |
-18<=h<=18, -41<=k<=42, -16<=l<=16 |
Reflections collected |
30125 |
Independent reflections |
5946 [R(int) = 0.044] |
Coverage of independent reflections |
99.3% |
Absorption correction |
multi-scan |
Max. and min. transmission |
0.9600 and 0.8024 |
Function minimized |
Σ w(Fo2 - Fc2)2 |
Data / restraints / parameters |
5946 / 37 / 331 |
Goodness-of-fit on F2 |
1.03 |
Δ/σmax |
0.42 |
Final R indices |
3864 data; I>2σ(I)
all data |
R1 = 0.083, wR2 = 0.236
R1 = 0.118, wR2 = 0.279 |
Weighting scheme |
w=1/[σ2(Fo2)+(0.1640P)2+24.7678P]
where P=(Fo2+2Fc2)/3 |
Largest diff. peak and hole |
3.49 and -1.47 eÅ-3 |
R.M.S. deviation from mean |
0.16 eÅ-3 |
| |
|
|
|
The structure solution was obtained, and it was apparent that there is a significant overall disorder in the structure. Thus, there were several parts of the complex in which functional groups had several orientations: 1) coordinated to Ru(II) atom h6-para-cymene group has isopropyl- and methyl- groups being severely disordered by two positions; 2) one of the counter-anions–PF6-–was also disordered. A successful modeling of the disorder of the organic groups was possible and H-atoms were geometrically attached to their host carbon atoms (Fig. S6, ESI). At the same time the disorder in one of the counter-anions (PF6-) was much more difficult to handle. This anion is in a special position in the crystal and the P2 atom is located on the C2 axis. The electron density from the fluorine atoms was clearly seen on the map, but it was rather difficult to model the proper geometry of the anion with two F atoms even being refined isotropically. The overall shape of thermal ellipsoids of carbon and nitrogen atoms of the aromatic moiety of the thiosemicarbazone as well as that of the counter-anions indicate that there is a loose crystal packing with the possibility to anions and coordinated to Ru organic groups to adopt slightly different orientations. Indeed, the structure occupies 3203.12 Å3 (60.6% only) with significant void and solvent accessible volume. The unresolved disorder generated several A and B-type errors in the checkCIF report by PLATON. (The PLATON checkCIF reports are shown in the ESI.) It is important to note that the disorder in both fragments is not affecting the core structure of the molecule–Ru(II) coordination environment–which was the main scope of our interest. Final residual electron densities or lack thereof was observed at 0.83 Å from Ru1 (+1.14 e), and the hole at 0.64 Å from F1 atom (-0.82 e). The first one at the heavy metal site represents a typical "ripple" of electron density and has no chemical meaning.
The molecular structure and numbering scheme in the [Ru2S2] dimer is shown in Figure 3, together with a detailed picture of the Ru(II) environment in the complex. The two halves of the dimer are related through a C2 axis passing in the middle of the Ru2S2 rhomb (Figure 3). Geometrical parameters of the p-cymene group and thiosemicarbazone ligand are normal for these types of compounds. A recent search of the Cambridge Structural Database pertaining to the S,N ligand set and p-cymene-Ru fragment resulted in thirty-three hits. Among these reported crystal structures there are five di- and poly-nuclear Ru-sulfides, four structures containing dinuclear Ru-complexes with ligands acting as S-donor atoms bridges, and only four true dimers in which two structures contain metal-ligated thiosemicarbazone ligands [38]. The refcodes of the above-mentioned structures are given in the ESI. Therefore, this work presents a crystal structure that is the third known example of the formation of a centro-symmetric dimer with N,S donor atoms. A comparison of our complex with the most-similar complexes found in the CDCC, showed that the key geometric parameters are indeed comparable. The average Ru-S-Ru bond angle for the three similar complexes of 97.20° is slightly less than the 99.36° observed for our complex. Similarly, for the S-Ru-S angle, this complex is 1.27° less than the average for the comparison complexes. It is also observed that the Ru-S bonds in the [Ru2S2] core are not the same length and that the difference in length is similar to that of the comparison complexes. A comprehensive table of the geometric parameters is given in the ESI.
Figure 3. A–The asymmetric unit of the Ru-core dimer in the structure (two PF6- anions are omitted for clarity) showing the numbering scheme of the most important atoms; an ORTEP drawing at 50% thermal ellipsoids probability level. B and C - two views of the ordered part of the [Ru2S2] dimer with part of the ligand and p-cymene groups in ball-&-stick representation; green dot indicates how two ASU parts of the [Ru2S2] dimer are related via a C2 axis. H-atoms in B and C are omitted for clarity as well as two PF6- anions.
Cytotoxicity assay
The cytotoxicity profiles of the complexes against two human cancer cell lines, HCT-116 (colon carcinoma) and Caco-2 (epithelial colorectal adenocarcinoma) and a non-cancerous cell line, CCD-18Co (colon fibroblasts) was investigated using a tetrazolium-based (MTS) colorimetric assay. Etoposide, a potent anti-neoplastic drug, was used as a standard comparison treatment. The IC50 values, the median cytotoxic concentrations, were determined after 24, 48, and 72 h of drug exposure. None of the complexes showed any reasonable cytotoxicity. For instance, complex 2 was the most active (against Caco-2) with IC50 of 318 ± 9 mM. We did not determine a value for complex 3. By comparison, etoposide had an IC50 value of 18.3 ± 1.4 mM for under similar experimental conditions (72 h treatment). Still, a number of generalizations can be made. Longer exposure times is indicated for more cytotoxic activity. In addition, the HCT-116 cell line is less sensitive to the complexes than the Caco-2 cell line. It should be noted that that there is a cytotoxic selectivity as all the complexes are less cytotoxic to the normal CCD18-Co cells relative to the cancer cells. Incidentally, while 3 is non-active against the colon cancer cells it shows moderate activity against the MCF-7 breast cancer cell line with IC50 of 95.6 ± 4.2 mM. The lack of activity of 3 could be related to the lack of hydrogen bonding capability on the thiosemicarbazone ligand. This factor, along with facile aquation of the chloride ligand, has been identified as being important for good anticancer activity.[19,20] While the complexes are not super-active, they can still be investigated for further development. This is because it is known that some ruthenium complexes have low in vitro toxicity but show good in vivo characteristics. For example, complexes of the type [(arene)Ru(PTA)Cl]+ exhibited low activity against cancer cells but had very good anti-metastatic activity in vivo [39].
Reaction of the complexes with DNA
Electronic absorption spectroscopy: The structure of DNA presents three structural features to which a small molecule can bind. The major and minor grooves, with the abundance of hydrogen donors and acceptors present, can accommodate a ligand. A ligand can also intercalate between the base pairs if it possesses appropriate functional groups. Finally, a charged ligand can interact with phosphate groups via ionic interactions. As mentioned before, ruthenium piano-stool complexes with an extended aromatic moiety, were found to enhance cytotoxicity by facilitating DNA binding. Using UV-Vis spectroscopy is typically part of a suite of spectroscopic methods used to examine the strength of the binding interactions of metal complexes with DNA [40-42]. Given the structure of the ligands in the complexes under investigation, we examined whether the compounds are capable of binding to DNA through intercalation. Complexes which adopt this method of binding generally have electronic absorption bands that show bathochromic changes relative to the free complex and also display hypochromism. Absorption titration experiments in TRIS buffer were performed by using solutions with a fixed complex concentration (10-4 M) to which aliquots of a concentrated solution of ct-DNA were added. The changes in absorbance upon each addition were monitored at the maximum wavelengths 386, 373 and 367 nm for 1, 2, and 3 respectively (Figure 4). It can be seen from the figure that as the DNA concentration is increased, there is notable hypochromism of the main absorption bands, 27% for 1, 20% for 2 and 18% for 3. There was no wavelength shift for compound 3 but the absorption spectra for 1 and 2 were blue-shifted by 9 and 7 nm respectively. Consequently, we can suggest that the complexes are minor intercalators into the DNA structure. To quantify the binding strength, the intrinsic binding constant Kb can be calculated from equation 1[40]:
Figure 4. Electronic absorption spectral changes of complexes on titration with ct-DNA. [Ru] = 10 mM, [DNA] = 0, 1, 3, 5, 7, 9, 11, 13, 15, 17 and 19 mM. Arrow indicates the change upon increasing DNA concentration. Inset: Plot of [DNA]/(εa –εf) vs. [DNA].
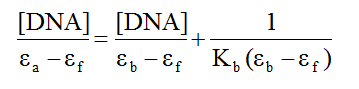
(1)
where ea, ef and eb correspond to the molar absorptivities of the metal complex after each addition of ct-DNA, for the free metal complexes and for the metal complexes in the completely bound form respectively. the binding constants Kb are calculated from the plots of [DNA]/(ea - ef) versus [DNA] (insets of Figure 4), The values are given in Table 2. From the table, it is seen that the binding constant are on the order of 105 M-1 which characterizes them as moderate to strong binders. The nature of the results suggests that the complexes do not interact with DNA via intercalation or at least this type of interaction is weak. Also, given the magnitude of these values, it is possible that the cationic nature of the complexes could provide for electrostatic interactions as described above.
Table 2. Binding constants (M-1) for the interaction of 1, 2 and 3 with ct-DNA
Experimental method |
1 |
2 |
3 |
Absorption titrationa |
(1.87 ± 0.10) x 105 |
(1.42 ± 0.08) x 105 |
(4.28 ± 0.29) x 105 |
Ethidium bromide competitionb |
2.22 x 10⁴ |
6.52 x 10³ |
4.51 x 10³ |
a at ambient temperature b apparent binding constant
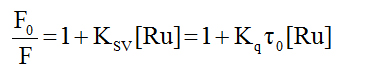
Ethidium bromide competition experiment: We have investigated the reaction of the complexes with calf-thymus DNA via a fluorescence competition experiment. Both DNA and ethidium bromide (EB) are non-emissive in aqueous solution; however when they interact, the EB intercalates into the DNA molecule generating an adduct that is fluorescent. This fluorescence may be quenched if an added compound can displace the EB from the binding sites on the DNA (returning to the non-emissive states). We can see from Figure 5 that all the complexes reduced the fluorescence of the EB-DNA solution (indicated by the arrow). By treating the data according to the Stern-Volmer equation (equation 2), one calculate the quenching constant which estimates the strength of the binding.
Figure 5. Fluorescence spectra of the EB-DNA complex in the absence and presence of increasing amounts the complexes, lex = 520 nm, [EB] = 0.33 mM, [DNA] = 10 mM, [M] (mM): 0–50 in 5 mM increments. Temperature = 303 K. Arrow indicates the change upon increasing complex concentration.
(2)
In this equation F0 and F are the fluorescence intensities of the reaction solution in the absence and presence of the metal compound. KSV is the Stern-Volmer quenching constant. The expected linearity of the plot (F0/F vs. [Ru]) was observed only for 2 and 3 with quenching constants of (1.49 ± 0.02) x 104 M-1 and (8.30 ± 0.15) x 103 M-1, respectively. For complex 1 the Stern-Volmer plot was nonlinear displaying a concave shape and a quenching constant could not be calculated. In all cases, to assess the strength of the binding, equation 3 was employed to calculate the apparent binding constant.
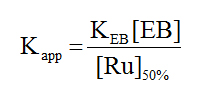
(3)
In this equation KEB is the binding constant for ethidium bromide, taken as 1.2 x 10⁶ M-1 ,[43] and [Ru]50% is the concentration of the complex that causes a 50% reduction of the initial fluorescence. These values are shown in Table 2 and are on the order of 103 M-1 which suggest that the complexes are weak binders.
We propose that in the reactions here, predominantly static mechanism is operating (as opposed to dynamic quenching). In static quenching, a quencher-fluorophore complex is formed. This is usually inferred from the bimolecular quenching constant, (Kq in equation 1), calculated by using t0 = 22 ns [44] for the EB-DNA complex. Keq for the reactions under investigation are on the order of 1011 M-1 s-1 which is an order of magnitude larger than the limiting value of 1010 M-1 s-1.[45] This value is considered the largest possible value in aqueous solution.
A typical intercalator like ethidium bromide has a binding constant of 3.0 x 10⁶ M-1 [46]. The calculated apparent binding constants are an order or two of magnitude less than those obtained from the absorption titrations the results confirm that the complexes are weak intercalators. This is not unexpected as none of the complexes have the structural characteristics, whether on the face-cap or the thiosemicarbazone ligand, that are common for intercalators.
Viscosity: To further clarify the binding mode of the complexes with DNA, we studied the interaction of the complexes with ct-DNA by viscometry. This involves measuring the viscosity of DNA solutions containing varying amount of added complex. Viscometry is considered a definitive test of the classical intercalation model of binding in aqueous solution. For a metal complex (or any ligand) to intercalate, the DNA molecule must unwind to a certain degree in order to accommodate the binder. One consequence of this structural change is a lengthening of the strands. This should lead to more entanglement of the said strands and an increase in the viscosity of a DNA solution containing a classical intercalator [47]. In the current study, the viscosity of a 100 mM DNA solution containing 0–80 mM of metal complexes were measured after thermal equilibrium. We followed the protocol established by Cohen and Eisenberg [48] where viscosity data were plotted as (h/h0)1/3 versus the binding ratio ([Ru]/[DNA]) as shown in Figure 6. It was observed that increasing the complex concentration led to an increase in the viscosity of the DNA solution at lower complex:DNA ratios. In the case of 1 however, at higher ratios there is a decrease in the viscosity of the solutions. Therefore this supports the results from the EB displacement experiments, and we may conclude that the complexes are poor intercalators. In general, the complexes with the arene face-cap had a slightly quicker rate of change. This might suggest that the top face of the complexes might be the initial entry point into the nucleic acid.
Figure 6. Effect of increasing concentrations of complexes on the relative viscosity of ct-DNA solutions at 303 K ± 1 K.
Cleavage of pBR322 DNA: Gel electrophoresis, particularly agarose gel electrophoresis, is probably the most important biochemical technique used to study DNA topology. This technique was used to probe the chemical nuclease activity of the complexes. This was accomplished by measuring their ability to convert supercoiled pBR322 DNA from the circular form to the nicked circular form in the dark as well as after illumination by UV irradiation under aerobic conditions. When circular plasmid DNA in the presence of metal complexes is interrogated by electrophoresis, relatively fast migration through the gel is normally observed for the intact, more compact supercoil (the so-called Form I). If nicking (a single-strand break) occurs, the supercoil will relax to generate a slower-moving open circular form (Form II). The linear Form III move at an intermediate rate. Figure 7 shows the electrophoretic separation of the DNA after incubation with the complexes in the dark and after irradiation with 365 nm light. With or without irradiation, complexes 1 and 2 show no significant cleavage of the DNA even at concentrations as high as 200 mM. Complex 3 show some cleavage activity at all the concentration levels. This activity seems to disappear when the reaction was irradiated.
Figure 7. Agarose gel electrophoresis diagram for the cleavage of pBR322 DNA by the complexes at ambient temperature with (A) and without (B) irradiation with 365 nm light under aerobic conditions. Irradiation time was 1 h and incubation time was 1 h. Lane DNA: DNA alone; Lane 1: DNA + solvent; Lane 2–8: DNA + 5, 10, 20, 30, 50, 100, and 200 mM complexes; Lane 9: DNA ladder
Interaction with human serum albumin
Fluorescence titration: Human serum albumin (HSA) is the most abundant protein in blood plasma. It is a multifunctional protein serving as a transport agent amongst other roles. This transport function is important for drug action as HSA can reversibly bind drugs, which necessarily affects pharmacokinetic behavior. HSA is a single-chain protein generating a secondary structure which contain three structurally similar domains. It is generally accepted that the domains present two major binding sites referred to as site I and II. Site I is much bigger than site II; consequently a wide range of drugs can bind and be transported. Despite the large amount of studies that have been done on HSA, exact details of the nature of the potential interactions is still debated and might logically be expected to depend on the drug being studied. The site I binding pocket is hydrophobic in nature and contains the single tryptophan amino acid residue [49]. (There is also an emissive tyrosine residue (Tyr 411 in site II). As a result, binding interactions between ligands and the protein can be probed by fluorescence spectroscopy. The tryptophan exhibits the majority of the inherent protein fluorescence. Groups binding at or near this residue will quench the fluorescence from the protein. On excitation at 295 nm HSA has strong fluorescence emission near 350 nm. It can be observed from Figure 8 that titration of HSA with the complexes led to dramatic decreases in the HSA fluorescence suggesting that binding occurs at or near the tryptophan residue resulting in changes in the secondary structure of the protein. It can also be observed that there is a blue shift of about 10 nm to near 333 nm. We interpret this to mean that it is likely that binding results in reduction of the tryptophan exposure to a polar environment; emission in this region suggests that the tryptophan residue is buried in a nonpolar hydrophobic pocket on the HSA. One could therefore initially speculate that the complexes bind at site I on the protein.
The insets of Figure 8 show the Stern-Volmer plots, which are expected to be a straight line. For 1 and 2 it is obvious that there are strong positive deviations in the plots. The concave-up nature of these plots usually indicates that both dynamic and static quenching is involved. For proteins the quenching constants is approximately the same [50,51]. Alternatively, there may be more than one independent binding site on the HSA that are not all equivalently accessible to the complexes or the complexes bind to them to different extents. While it is understood that there are the two main binding sites on the protein, other sites are indeed possible. The situation is different for 3 where the expected straight line is observed which suggest that the mechanism of interaction with the protein is different when the face-cap is an arene versus when it’s the thiacrown.
Figure 8. (A, B, C): Emission spectra of HSA in the absence and presence of increasing amounts of the complexes. lex = 295 nm, [HSA] = 3.0 mM and [M]: 2.5, 7.5, 12.5, 17.5, 22.5, 27.5 mM. Temperature = ambient. Inset: Stern-Volmer plots. (D) Double-log plot of log (F0–F)/F vs. log [Ru]
In order to examine quantitatively the complex–HSA binding, equation (4) [52] has been used to calculate the binding constant.
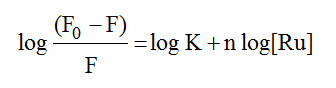
(4)
In this equation K and n are the binding constant and the number of binding sites on the albumin, respectively. The double-logarithm curves log (F0-F)/F vs. log [Ru] gave log K as the intercept and n as the slope. The results show that the binding between the complexes and HSA was significant with binding constants of 2.74 x 10⁵ M-1 and 1.96 x 10⁶ M-1 for 1 and 3, respectively. The binding site n was approximately equal to 1 (1.1 and 1.3) suggesting (though not definitively) that there was one binding site for the complexes on HSA.
Infrared spectrophotometry: Infrared spectroscopy is a well-established experimental technique for the characterization of the secondary structure of proteins [53]. A qualitative assessment of the interaction of the three complexes with HSA was therefore undertaken using infrared spectrophotometry. There are nine characteristic infrared absorption bands for proteins. Of these, two are more generally useful in studying ligand-protein interactions. The amide I band is due to stretching of the C=O functional group of the peptide moiety and occur between 1600 and 1700 cm-1. Since this band is closely associated with the secondary structure (percent a and b content) of the protein [54], changes in said structure on interaction with a metal compound can provide information on the binding. The amide II band (which shows around 1550 cm-1), by contrast, shows much less protein conformational sensitivity compared to the amide I band. Unordered structure can be observed in the 1640–1648 cm-1 region in water [55]. Figure 9 shows the infrared spectra before and after incubation 48 h of HSA with the complexes. The infrared spectra of HSA, HSA plus the complex (1:1 molar ratio) and the complex alone were recorded. Then difference spectra were calculated using the instrument’s software package. The free HSA shows the amide I absorption at 1653 cm-1. When complexes 1 and 2 interact with the protein, this band shifts by +3 and +2 cm-1 respectively. For complex 3, this amide I absorption is almost absent. Another noteworthy change is observed at 1647 cm-1. This band, which can be attributed to unordered structure, is absent in the free HSA but is quite prominent in the complex-protein adduct for all three complexes. So in the case of 3 there appears to be significant disruption of the secondary structure of the HSA. The same is true for 1 and 2 though to a lesser degree as there are still strong indicators of significant a-helix content. As is expected, the amide II absorption shows changes that are difficult to interpret meaningfully.
Figure 9. FTIR spectra of free HSA and the difference spectra (metal complex-HSA–metal complex)
Computational studies
Though DNA is implicated as the main target for anticancer ruthenium compounds, other information suggests that proteins such as topoisomerase II may also be reasonable targets. We have previously shown that complexes like those in this study can act as topo II inhibitors [6]. In addition, it is generally accepted that organometallic ruthenium compounds bearing a Ru-Cl bond is biologically activated by hydrolysis of this bond. Therefore, we undertook a basic computational investigation of the complexes in this study along with their aquated counterparts pertaining to their interaction with DNA and topoisomerase II.
Optimized structures: Density functional theory (DFT) calculations are a well-established tool to describe the geometry in transition-metal complexes. Consequently, the geometry of the complexes was optimized at this level of theory with wB97X-D/6-31G* using the Spartan 14 software [56]. This combination of functional and basis set equated to LANL2DZ on Ru and 6-31G* on all other atoms. Vibrational frequencies calculation were carried out to verify the minimized configuration of each species and to derive thermodynamic parameters. The calculated structures were used along with the Autodock 4.2.6 (in AutodockTools) software package [57] for the docking calculations on the crystal structure of DNA (PDB code: 423D) and topoisomerase II (PDB code: 2RGR). Grid boxes of 110 × 100 × 80 points and 100 × 100 × 126 points with a spacing of 0.375 Å between the grid points were used for the DNA and protein respectively. The box was centered on the macromolecule. One hundred docked structures (i.e., 100 runs) were generated by using genetic algorithm searches. The protocol that was applied had an initial population of 150 randomly placed individuals, a maximum number of 2,500,000 energy evaluations, a maximum number of 27000 generations, a mutation rate of 0.02, and a crossover rate of 0.8. Docking input files for the complex and the macromolecule were generated with the ADT software. The results were visualized using the Discovery Studio 4 visualizer from Accelrys.
Figure 10 show the calculated structures for the six complexes using DFT/wB97X-D computations. Some selected geometrical parameters are given in Table 3. In general, the complexes show the classical piano-stool structure which is essentially a distorted octahedral geometry. For complexes 1 and 2 the TSC ligand essentially coordinates in the same fashion. The N(t)-Ru1-S(t) bite angles averages 81.93° for the chloro complexes and 81.41° for the aqua complexes. The Ru1-S(t) bond averages 2.363 Å and 2.380 Å in the chloro and aqua complexes respectively. The Ru1-N(t) bond doesn’t really vary between the two types of complexes. However this bond is 3 and 3-aq were noticeable longer than in the other four complexes. This suggest that even in the context of a general distortion of the octahedron, there could be structural effects of the face-cap. Along the same lines it could be noted that in 2 the calculated structures show that the p-cymene ring is not “level” but is essentially sloping with the ring tilting away from the thiosemicarbazone (TSC).

Figure 10. Calculated structures of the complexes synthesized in this study (left) and their aquated analogs (right)
Table 3. Selected calculated geometrical parameters for the complexes and their hydrolysis products
|
Complexes |
1 |
1-aq |
2 |
2-aq |
3 |
3-aq |
Bond lengths |
|
|
|
|
|
|
Ru1-Cl1 |
2.400 |
|
2.359 |
|
2.440 |
|
Ru1-O1 |
|
2.221 |
|
2.240 |
|
2.232 |
Ru1-S1 |
|
|
|
|
2.351 |
2.317 |
Ru1-S2 |
|
|
|
|
2.334 |
2.350 |
Ru1-S3 |
|
|
|
|
2.412 |
2.432 |
Ru1-S(t) |
2.396 |
2.387 |
2.341 |
2.360 |
2.395 |
2.393 |
Ru1-N(t) |
2.156 |
2.141 |
2.154 |
2.137 |
2.188 |
2.207 |
Ru-centroid |
1.745 |
1.750 |
|
|
|
|
Bond Angles |
|
|
|
|
|
|
S1-Ru1-S2 |
|
|
|
|
89.09 |
89.03 |
S1-Ru1-S3 |
|
|
|
|
|
|
S2-Ru1-S3 |
|
|
|
|
85.51 |
84.91 |
O1-Ru1-S(t) |
|
85.39 |
|
84.37 |
|
86.71 |
O1-Ru1-N(t) |
|
84.09 |
|
90.79 |
|
93.63 |
S(t)-Ru1-N(t) |
82.05 |
81.30 |
85.67 |
80.72 |
82.08 |
82.21 |
Cl1-Ru1-N(t) |
84.54 |
|
91.95 |
|
93.07 |
|
Cl1-Ru1-S(t) |
86.11 |
|
81.65 |
|
90.18 |
|
|
|
|
|
|
|
|
Lig-Ru1-S(t) |
127.09 |
128.30 |
|
|
|
|
Lig-Ru1-N(t) |
133.09 |
131.19 |
|
|
|
|
Lig-Ru1-Cl1 |
127.55 |
|
|
|
|
|
Lig-Ru1-O1 |
|
129.52 |
|
|
|
|
(t) = thiosemicarbazone |
|
|
|
|
|
|
Interaction with the macromolecules: A close examination of Table 4 provide some feel for if and how the nature of the face-cap on the complexes affect binding to the macromolecule (MM). Generally speaking the aqua complexes bind stronger to both DNA and topo II than the chloro compounds even though it is only for complex 1 that we observe a very large difference. It can also be noted that binding to the protein as indicated by the dissociation constant kI, is significantly stronger that binding to DNA. A look at the binding interactions of the complexes with the MMs, (Figure 11), allow us to gain some insight into the trends in dissociation constants. (General pictograms of the complexes with the MMs can be seen in the ESI). In both the chloro and aqua complexes the –NH2 group of the TSC ligand plays an important role in the binding to the MMs. In particular, it is involved in H-bonds with a variety of groups on the nucleic acid or protein.
Figure 11. Binding groups and the interactions of the complexes with the macromolecules: A = chloro complexes: DNA top; topo II bottom. B = aquated complexes: DNA top; topo II bottom
Table 4. Calculated binding parameters for the complexes with DNA and topoisomerase II
Macromolecular target ®
Compound ¯ |
DNA |
Topoisomerase II |
|
Binding energy* |
kI |
Binding energy* |
kI |
1 |
- 6.06 |
36.18 |
- 7.18 |
5.43 |
1-aq |
- 6.92 |
8.47 |
- 8.57 |
0.523 |
|
|
|
|
|
2 |
- 6.14 |
31.53 |
- 7.79 |
1.94 |
2-aq |
- 7.30 |
4.47 |
- 8.83 |
0.783 |
|
|
2021 Copyright OAT. All rights reserv
|
|
|
3 |
- 6.49 |
17.59 |
- 8.01 |
1.36 |
3-aq |
- 7.04 |
6.91 |
- 8.04 |
1.29 |
* Binding energy is in kJ/mol and dissociation constant (kI) is in micromolar units; aq implies the aquated complexes
For instance, the phosphate groups on the DNA backbone are seen to form bonds with this group. For the interaction of 1 with 423D it is Cyt21 that has this interaction. In the other complexes various nucleotides are involved: for 2 Gua7 is involved. The sugar unit of the nucleic acid residues also feature in the hydrogen bonding interaction. The –NH group of the TSC also participated in hydrogen bonding interactions with similar groups. For example 2-aq interacts via H-bond with the sugar units of Cyt9 in 423D. The –NH group also show charge-charge interactions with the phosphates of the backbone in both the DNA and topo II. The benzene ring of the thiosemicarbazone ligand as well as the –N(CH3)2 moiety also play in a role in binding the MM. For complex 2-aq the ring participates in pi-pi interaction with Ade17 when interacting with 423D; the same complex exhibit this type of interaction with Tyr840 of 2RGR. In 3-aq this interaction is seen with Gua9. The arene rings of the complexes also show this type of interaction. As mentioned above the methyl groups of the –N(CH3)2 moiety are non-innocent in binding. In the binding to topo II this group in 1 show a carbon-hydrogen-bond interaction with the hydroxyls of Asn974 and Thy10 as well with Glu831. The same group in 1-aq interacts with Ade17 and the phosphate unit of Cyt18.
A possible reason for the aqua complexes binding stronger to the MMs is the additional hydrogen-bonding interactions that these complexes present. In almost all the docking runs this group forms conventional hydrogen bonds with various acceptors on the MMs. 1-aq interacts with the sugar unit of Cyt11 as well as Thy10 of the topo II target. For DNA the acceptor moiety is the sugar of Gua19 along with Cyt19 in the interaction with the same complex. The same two nucleotides are also the target for 2-aq and 3-aq.
As mentioned before, the complexes interact stronger with topo II than DNA. For the aqua complexes Asn974 feature prominently in the binding interactions. For 1-aq, 2, and 2-aq the –NH2 of the TSC has a conventional H-bond with this group. Particularly noteworthy are the interactions of the Tyr840. This residue of topo II interacts in a variety of ways with the complexes. For 2 and 2-aq a pi-sigma interaction is seen with the isopropyl group. In the case of 1-aq the interaction is pi-pi with the benzene ring of the TSC. The tyrosine residue of topoisomerase II is very important for its function. Topo II is involved in DNA replication by facilitating the unwinding to relieve strain during the replication process. Tyrosine residues in the enzyme are involved in the chain breaking process. The hydroxyl group attacks the phosphate units causing strand scission. The residues form covalent bonds to DNA pulling the chains apart to create a gap. The intact strand of DNA is passed through the gap before the break is resealed. Non-covalent interaction of protein with DNA is a key step in topoisomerase II catalytic cycle. The fact that these complexes can bind to or interact with the tyrosine residue would enable them stabilize the covalent topo II-DNA cleavage complex, forming a ternary complex and act as topo II poisons.
On the basis of molecular modeling analyses we suggest that these complexes have one, two or three distinct binding domains. In the aqua complexes of 1 and 2 the arene, TSC and water molecule can all bind to the macromolecules. In 3 the thiacrown ligand doesn’t not bind directly at all. The chloro complexes present two binding sites as the chloro ligand doesn’t interact significantly with either macromolecule. (There is one unfavorable negative-negative interaction with the phosphate observed between 1 and Gua7 as well as 3 and Gua10 in DNA). We can also see that the complexes are generally minor-groove binders. This is not totally unexpected as there are no typical intercalative (large planar aromatic) groups in the complexes.
Based on the results from the docking studies, it is difficult to fully discern if there is a true effect of the face-cap on the interaction with macromolecules. For the chloro compounds, the inorganic complex bind stronger than the organometallic complexes to both DNA and topo II. For the aquated complexes however, it is seen that the p-cymene complex binds the strongest to both MMs.
Conclusion
The three complexes synthesized in this study show a relatively poor cytotoxicity profile in vitro colon cancer models. They are strong binders of DNA as demonstrated by electronic absorption titrations probably via an electrostatic binding mechanism. The organometallic complexes do not photocleave pBR322 plasmid DNA. Based on the results it can be suggested that the organometallic complexes a different biophysical reactivity than the coordination compound. However we can draw no hard conclusion as to whether the thiacrown enhances or reduces the potential of half-sandwich ruthenium complexes to act as anticancer agents. However based on results from the computational studies which indicate that both DNA and topo II favors binding to this complex in what is presumably the inactivated form. Altogether, the information obtained from this study is interesting enough to suggest that these complexes warrant further study towards their possible development as metallodrugs.
Acknowledgements
This project was supported by grants from the National Center for Research Resources (5P20RR016460-11) and the National Institute of General Medical Sciences (8P20GM103429-11) from the National Institutes of Health (USA) to FAB. The content is solely the responsibility of the authors and does not necessarily represent the official views of the National Center for Research Resources or the National Institutes of Health. The funders had no input into the collection, analysis and interpretation of the data, in the writing of the report or in the decision to submit the article for publication.
Supplementary material
The crystallographic data for ruthenium complex reported in this paper has been deposited with the Cambridge Crystallographic Data Centre, CCDC #992015. One may obtain this information by contacting the CCDC at 12 Union Road, Cambridge CB2 1EZ, United Kingdom. (Fax: +44 1223 336 033] or via http://www.ccdc.cam.ac.uk/data_request/cif .) Supplementary data associated with this article can be found in the online version.
References
- Mühlgassner G, Bartel C, Schmid WF, Jakupec MA, Arion VB, et al. (2012) Biological activity of ruthenium and osmium arene complexes with modified paullones in human cancer cells. J Inorg Biochem 116: 180-187.[Crossref]
- Meier SM, Hanif M, Kandioller W, Keppler BK, Hartinger CG (2012) Biomolecule binding vs. anticancer activity: reactions of Ru(arene)[(thio)pyr-(id)one] compounds with amino acids and proteins. J Inorg Biochem 108: 91-95.[Crossref]
- Allardyce CS, Dyson PJ, Ellis DJ, Heath SL (2001) [Ru(?6-p-cymene)Cl2(pta)] (pta = 1,3,5-triaza-7-phosphatricyclo[3.3.1.1]decane): a water soluble compound that exhibits pH dependent DNA binding providing selectivity for diseased cells. Chem Commun 1396–1397
- Morris RE, Aird RE, Murdoch Pdel S, Chen H, Cummings J, et al. (2001) Inhibition of cancer cell growth by ruthenium(II) arene complexes. J Med Chem 44: 3616-3621.[Crossref]
- Süss-Fink G1 (2010) Arene ruthenium complexes as anticancer agents. Dalton Trans 39: 1673-1688.[Crossref]
- Beckford F, Thessing J, Woods J, Didion J, Gerasimchuk N, et al. (2011) Synthesis and structure of [(?(6)-p-cymene)Ru(2-anthracen-9-ylmethylene-N-ethylhydrazinecarbothioamide)Cl]Cl; biological evaluation, topoisomerase II inhibition and reaction with DNA and human serum albumin. Metallomics 3: 491-502. [Crossref]
- Beckford F, Dourth D, Shaloski M Jr, Didion J, Thessing J, et al. (2011) Half-sandwich ruthenium–arene complexes with thiosemicarbazones: synthesis and biological evaluation of [(ηâ¶-p-cymene)Ru(piperonal thiosemicarbazones)Cl]Cl complexes. J Inorg Biochem 105: 1019-1029.[Crossref]
- Hartinger CG, Zorbas-Seifried S, Jakupec MA, Kynast B, Zorbas H, et al. (2006) From bench to bedside--preclinical and early clinical development of the anticancer agent indazolium trans-[tetrachlorobis(1H-indazole)ruthenate(III)] (KP1019 or FFC14A). J Inorg Biochem 100: 891-904.[Crossref]
- Antonarakis ES, Emadi A (2010) Ruthenium-based chemotherapeutics: are they ready for prime time? Cancer Chemother Pharmacol 66: 1-9.[Crossref]
- Chen H, Parkinson JA, Parsons S, Coxall RA, Gould RO, et al. (2002) Organometallic ruthenium(II) diamine anticancer complexes: arene-nucleobase stacking and stereospecific hydrogen-bonding in guanine adducts. J Am Chem Soc 124: 3064-3082.[Crossref]
- Fernández R, Melchart M, Habtemariam A, Parsons S, Sadler PJ (2004) Use of chelating ligands to tune the reactive site of half-sandwich ruthenium(II)-arene anticancer complexes. Chemistry 10: 5173-5179.[Crossref]
- Ivanovic I, Gligorijevic N, Arandelovic S, Radulovic S, Roller A, et al. (2013) New ruthenium(II)-arene complexes bearing hydrazides and the corresponding (thio)semicarbazones of 3- and 4-acetylpyridine: Synthesis, characterization, crystal structure determination and antiproliferative activity. Polyhedron 61: 112-118.
- Kandioller W, Kurzwernhart A, Hanif M, Meier SM, Henke H, et al. (2011) Pyrone derivatives and metals: From natural products to metal-based drugs. J Organomet Chem 696: 999-1010.
- Hanif M, Meier SM, Kandioller W, Bytzek A, Hejl M, et al. (2011) From hydrolytically labile to hydrolytically stable Ru(II)-arene anticancer complexes with carbohydrate-derived co-ligands. J Inorg Biochem 105: 224-231.[Crossref]
- Wu Q, Fan C, Chen T, Liu C, Mei W, et al. (2013) Microwave-assisted synthesis of arene ruthenium(II) complexes that induce S-phase arrest in cancer cells by DNA damage-mediated p53 phosphorylation. Eur J Med Chem 63: 57-63.[Crossref]
- Gligorijević N, Aranđelović S, Filipović L, Jakovljević K, Janković R, et al. (2012) Picolinate ruthenium(II)-arene complex with in vitro antiproliferative and antimetastatic properties: comparison to a series of ruthenium(II)-arene complexes with similar structure. J Inorg Biochem 108: 53-61.[Crossref]
- Dyson PJ (2007) Systematic Design of a Targeted Organometallic Antitumour Drug in Pre-clinical Development. Chemia 61: 698-703.
- Bratsos I, Jedner S, Bergamo A, Sava G, Gianferrara T, et al. (2008) Half-sandwich Ru II[9]aneS3 complexes structurally similar to antitumor-active organometallic piano-stool compounds: preparation, structural characterization and in vitro cytotoxic activity. J Inorg Biochem 102: 1120-1133.[Crossref]
- Bratsos I, Mitri E, Ravalico F, Zangrando E, Gianferrara T, et al. (2012) New half sandwich Ru(II) coordination compounds for anticancer activity. Dalton Trans 41: 7358-7371.[Crossref]
- Rilak A, Bratsos I, Zangrando E, Kljun J, Turel I, et al. (2012) Factors that influence the antiproliferative activity of half sandwich Ru(II)-[9]aneS3 coordination compounds: activation kinetics and interaction with guanine derivatives. Dalton Trans 41: 11608-11618.[Crossref]
- Software Package for Crystal Structure Solution, APEX 2 suit. Bruker AXS, Madison, WI, 2013.
- Sheldrick GM (1999) SADABS Area-detector. Absorption Correction, 2.03; University of Göttingen, Göttingen, Germany.
- Beckford F, Robertson C, Harness R (2008) Thiosemicarbazone Complexes of Group 12 elements. 1. An Investigation of the Thiosemicarbazone From p-Dimethylaminobenzaldehyde1. J Undergrad Chem Res 7: 92-97.
- Bennett MA, Smith AK (1974) Arene ruthenium(II) complexes formed by dehydrogenation of cyclohexadienes with ruthenium(III) trichloride. Dalton Trans 233–241.
- Goodfellow BJ, Felix V, Pacheo SMD, de Jesus JP, Drew MG (1997) Structural characterisation of RuII [9]aneS3 polypyridyl complexes by NMR spectroscopy and single crystal X-ray diffraction. Polyhedron 16: 393-401.
- Cory AH, Owen TC, Barltrop JA, Cory JG (1991) Use of an aqueous soluble tetrazolium/formazan assay for cell growth assays in culture. Cancer Commun 3: 207-212.[Crossref]
- Reichmann ME, Rice SA, Thomas CA, Doty PJ (1954) A Further Examination of the Molecular Weight and Size of Desoxypentose Nucleic Acid. J Am Chem Soc 76: 3047-3053.
- Vijayalakshmi R, Kanthimathi M, Subramanian V, Nair BU (2000) Interaction of DNA with [Cr(Schiff base)(H(2)O)(2)]ClO(4). Biochim Biophys Acta 1475: 157-162.[Crossref]
- Barton JK, Goldberg JM, Kumar CV, Turro NJ (1986) Binding modes and base specificity of tris(phenanthroline)ruthenium(II) enantiomers with nucleic acids: tuning the stereoselectivity. J Am Chem Soc 108: 2081-2088.
- Beckford FA, Leblanc G, Thessing J, Shaloski M, Frost BJ, et al. (2009) Organometallic ruthenium complexes with thiosemicarbazone ligands: Synthesis, structure and cytotoxicity of [(eta-p-cymene)Ru(NS)Cl] (NS = 9-anthraldehyde thiosemicarbazones). Inorg Chem Commun 12: 1094-1098.[Crossref]
- Hamaker CG, Halbach DP (2006) Synthesis, structure, and characterization of some ruthenium arene complexes of N-(arylmethylene)-2-(methylthio)anilines and 2-(methylthio)aniline. Inorg Chim Acta 359: 846-852.
- Mai JF, Yamamoto Y (1998) Preparations and structures of (ETA(6)-ARENE)ruthenium(II) complexes bearing 1,1'-Bis(Diphenylphosphinomethyl)Ferrocene OR 1,1'-Bis(Diphenylphosphino)Ferrocene. J Organomet Chem 560: 223-232.
- Halbach DP, Hamaker CG (2006) Synthesis, characterization, and X-Ray structural analysis of some half-sandwich ruthenium(II) arene complexes with new N,S-donor Schiff base ligands. J Organomet Chem 691: 3349–3361.
- Afrasiabi Z, Sinn E, Kulkarni PP, Ambike V, Padhye S, et al. (2005) Synthesis and characterization of copper(II) complexes of 4-alkyl/aryl-1,2-naphthoquinones thiosemicarbazones derivatives as potent DNA cleaving agents. Inorg Chim Acta 358: 2023–2030.
- Beckford FA, Stott A, Gonzalez-Sarrías A, Seeram NP (2013) Novel microwave synthesis of half-sandwich [(?6-C6H6)Ru] complexes and an evaluation of the biological activity and biochemical reactivity. Appl Organometal Chem 27: 425-434.
- Mitra R, Das S, Shinde SV, Sinha S, Somasundaram K, et al. (2012) Anticancer activity of hydrogen-bond-stabilized half-sandwich Ru(II) complexes with heterocycles. Chemistry 18: 12278-12291.[Crossref]
- Platon: crystallographic software package at http://www.cryst.chem.uu.nl/spek/platon/
- Demoro B, Sarniguet C, Sánchez-Delgado R, Rossi M, Liebowitz D, et al. (2012) New organoruthenium complexes with bioactive thiosemicarbazones as co-ligands: potential anti-trypanosomal agents. Dalton Trans 41: 1534-1543.[Crossref]
- Scolaro C, Bergamo A, Brescacin L, Delfino R, Cocchietto M, et al. (2005) In vitro and in vivo evaluation of ruthenium(II)-arene PTA complexes. J Med Chem 48: 4161-4171.[Crossref]
- Ambroise A, Maiya BG (2000) Ruthenium(II) complexes of redox-related, modified dipyridophenazine ligands: synthesis, characterization, and DNA interaction. Inorg Chem 39: 4256-4263.[Crossref]
- Jiang M, Li YT, Wu ZY, Liu ZQ, Yan CW (2009) Synthesis, crystal structure, cytotoxic activities and DNA-binding properties of new binuclear copper(II) complexes bridged by N,N'-bis(N-hydroxyethylaminoethyl)oxamide. J Inorg Biochem 103: 833-844.[Crossref]
- Liu Q, Zhang J, Wang MQ, Zhang DW, Lu QS, et al. (2010) Synthesis, DNA binding and cleavage activity of macrocyclic polyamines bearing mono- or bis-acridine moieties. Eur J Med Chem 45: 5302-5308.[Crossref]
- Peberdy JC, Malina J, Khalid S, Hannon MJ, Rodger A (2007) Influence of surface shape on DNA binding of bimetallo helicates. J Inorg Biochem 101: 1937-1945.[Crossref]
- Ghosh KS, Sahoo BK, Jana D, Dasgupta S (2008) Studies on the interaction of copper complexes of (-)-epicatechin gallate and (-)-epigallocatechin gallate with calf thymus DNA. J Inorg Biochem 102: 1711-1718.[Crossref]
- Lacowicz JR (2006) Principles of Fluorescence Spectroscopy, (3rd Edn). Springer, New York.
- Baldini M, Belicchi-Ferrari M, Bisceglie F, Pelosi G, Pinelli S, et al. (2003) Cu(II) complexes with heterocyclic substituted thiosemicarbazones: the case of 5-formyluracil. Synthesis, characterization, x-ray structures, DNA interaction studies, and biological activity. Inorg Chem 42: 2049-2055.[Crossref]
- Long EC, Barton JK (1990) On demonstrating DNA intercalation. Acc Chem Res 23: 271–273.
- Cohen G, Eisenberg H (1969) Viscosity and sedimentation study of sonicated DNA–proflavine complexes. Biopolymers 8: 45-55.
- Sugio S, Kashima A, Mochizuki S, Noda M, Kobayashi K (1999) Crystal structure of human serum albumin at 2.5 A resolution. Protein Eng 12: 439-446.[Crossref]
- Privat JP, Charlier M (1978) Photochemical modifications of the tryptophan residues of wheat-germ agglutinin in the presence of trichloroethanol. Eur J Biochem 84: 79-85.[Crossref]
- Eftink MR, Ghiron CA (1981) Fluorescence quenching studies with proteins. Anal Biochem 114: 199-227.[Crossref]
- Sandhya B, Hegde AH, Kalanur SS, Katrahalli U, Seetharamappa J (2011) Interaction of triprolidine hydrochloride with serum albumins: thermodynamic and binding characteristics, and influence of site probes. J Pharm Biomed Anal 54: 1180-1186.[Crossref]
- Jackson M, Mantsch HH (1995) The use and misuse of FTIR spectroscopy in the determination of protein structure. Crit Rev Biochem Mol Biol 30: 95-120.[Crossref]
- Byler DM, Susi H (1986) Examination of the secondary structure of proteins by deconvolved FTIR spectra. Biopolymers 25: 469-487. [Crossref]
- Olchowicz JC, Coles DR, Kain LE, MacDonald G (2002) Using Infrared Spectroscopy to Investigate Protein Structure. Journal of Chemical Education 79: 369-371
- Spartan'14, Wavefunction, Inc., Irvine, CA
- Morris GM, Huey R, Lindstrom W, Sanner MF, Belew RK, et al. (2009) AutoDock4 and AutoDockTools4: Automated docking with selective receptor flexibility. J Comput Chem 30: 2785-2791.[Crossref]