Background: Abnormal myocardial loading can contribute to left ventricular (LV) mechanical dyssynchrony in patients with end-stage renal disease (ESRD) and may be a factor contributing to the high incidence of cardiac deaths in these patients. The study aims to evaluate the possible presence of LV dyssynchrony in ESRD patients, and acute effect of hemodialysis (HD) on LV synchronicity using tissue synchronization imaging (TSI).
Methods: Twenty patients with ESRD (11 males and 9 females) with mean age 63.1±4.41 were underwent echocardiographic examination before and immediately after a single HD session. Echocardiography was done using two dimensional strain imaging, global longitudinal systolic strain was measured in the apical views. LV mechanical dyssynchrony was assessed using TSI analysis enabling the retrieval of regional intraventricular systolic delay data. LV mechanical dyssynchrony was defined as a maximum regional difference in time to peak systolic velocity >105 ms and/or all segments standard deviation (SD) "dyssynchrony index" >32.6 ms.
Results: All patients had dyssynchronous LV segments before HD. A single HD session induced decrease in the global LV systolic strain from -19.65 ± 3.03 to -16.29 ± 2.75 (P<0.001), it also reduced the all segments maximum difference from 123.65 ± 33.94 to 102.60 ± 20.84 (P<0.001), the all segments SD was also reduced from 52.2 ± 12.31 to 40.15 ± 8.51 (P<0.001). Furthermore, the systolic dyssynchrony parameters were positively related to the LVEDD.
Conclusion: LV dyssynchrony is frequently present in patients with ESRD. The severity of LV dyssynchrony decreases after a single session of HD suggesting the deleterious effect of volume overload and may be the accumulating toxins on LV myocardium in such patients.
hemodialysis, left ventricular dyssynchrony, tissue synchronization imaging
Abbreviations: 2D-STE: Two dimensional speckle tracking echocardiography; ASMD: All segment maximum difference; CKD: Chronic kidney disease; CRT: Cardiac resynchronization therapy; CVD: Cardiovascular disease; EF: Ejection fraction; ESRD: End stage renal disease; GS: Global longitudinal strain; HD: Hemodialysis; HR: Heart rate; IVS: Interventricular septum; LV: Left ventricle; LVH: Left ventricular hypertrophy; PSV: Peak systolic velocity; PW: Posterior wall; RWT: Relative wall thickness; TDI: Tissue Doppler imaging; TSI: Tissue synchronization imaging; TVI: Tissue velocity imaging
Cardiac disease is the major cause of premature deaths in hemodialysis (HD) patients, accounting for 43% of all-cause mortality [1,2], and the frequency of sudden cardiac death is almost 50% higher after the long dialysis interval [3]. A factor that may have a potential to contribute to the high incidence of cardiac deaths in end-stage renal disease (ESRD) patients is intra-left ventricular (LV) mechanical dyssynchrony, a disorder that markedly affects systolic performance, cardiac electrophysiology, regional myocardial perfusion and metabolism [4,5].
Abnormal loading conditions such as excessive volume overload can worsen LV mechanical dyssynchrony by intensifying imbalances in the regional stretching and shortening of myocardial fibers following abnormal stress to myocardial tissue, especially in patients with ESRD requiring chronic HD therapy [6].
The accurate identification of LV dyssynchrony has been considerably improved by the introduction of a new diagnostic echocardiographic technique called tissue synchronization imaging (TSI) [7]. TSI provides an advanced analysis of synchronicity of myocardial motion based on the automatic detection of the time to peak systolic myocardial velocity at any discrete point within the myocardial wall and subsequent translation of the synchronicity data into color-coded maps. The regions of dyssynchrony contracting LV myocardium can thus be easily and quickly identified and quantified, and the obtained information allows better selection of patients for cardiac resynchronization therapy (CRT) and better therapeutic results [8,9].
The occurrence of intra-LV dyssynchrony has been described not only in patients with heart failure but also in individuals with LV hypertrophy (LVH) caused by pressure overload [10]. LVH has been shown to be present in 74–78% of patients on dialysis [11-13] and constitutes an independent risk factor for mortality in this patient category [14]. LVH, together with other cardiac abnormalities such as LV dilatation and arrhythmias [15,16] that often occur in ESRD patients [4], may by themselves induce and also be worsened by LV dyssynchrony. However, a possible occurrence of LV dyssynchrony in ESRD patients without heart failure and normal QRS duration has not yet been fully assessed.
There are significant numbers of studies that have shown the usefulness of tissue Doppler imaging (TDI) in identifying diastolic dysfunction in chronic kidney disease (CKD) and ESRD patients [17-19]. Unfortunately, TDI is an angle-dependent study and has a high inter- observer variability beside it requires expert interpretation. Two dimensional speckle tracking echocardiography (2D-STE) is a novel method of calculating the ventricular strain pattern that provides a reliable estimation of ventricular strain analysis in a shorter duration of time than TDI. It provides an angle-independent assessment and has less inter-observer variability [20,21]. There are very few studies of ventricular strain evaluation with 2D-STE in CKD and ESRD patients [20,22,23].
The objective of this study was to evaluate the possible presence of LV dyssynchrony in ESRD patients, and acute effect of hemodialysis (HD) on LV synchronicity using tissue synchronization imaging (TSI).
Patient selection
The study included twenty patients with ESRD (11 male and 9 female) with mean age 63.1 ± 4.41, all the included patients didn't show any clinical or electrocardiographic (ECG) signs of coronary artery disease and didn't show wide QRS duration in the surface ECG, the conventional echocardiographic screening showed normal ejection fraction (EF) and no regional wall motion abnormalities. The entire studied population was enrolled after informed consent was obtained and after approval of the ethics committee of the university hospitals was obtained.
Hemodialysis
All patients were on maintenance regular conventional hemodialysis, 4-hours session, 3 times per week for at least 6 month in the dialysis unit of Menoufiya University Hospital, using hemodialysis machine with volumetric control (Fresenius Medical Care (4008B) with polysulfone filters (Fresenius F6). The standard dialysis bath consisted of sodium, 140 mEq/L; potassium, 2 mEq/L; calcium, 3 mEq/L; and bicarbonate, 35 mEq/L. The ultrafiltration rate was programmed to reach the patient’s optimal dry weight defined as the post dialysis body weight below which the patients developed symptomatic hypotension or muscle cramps in the absence of edema. Heparin `was used for anticoagulation [24].
Exclusion criteria
Patients with evidence of coronary artery disease, conduction disturbances, wide QRS in surface ECG, atrial fibrillation, arrhythmias, severe valvular heart disease, ejection fraction <50%, congestive heart failure (New York Heart Association Classes III and IV), pericardial disease were excluded from the study.
Procedure
All patients underwent 12-lead electrocardiography, conventional echocardiographic examinations, 2D strain imaging, assessment of intra-LV synchrony using TSI mode. "Vivid 9, General Electric Healthcare (GE) Vingmed, Norway".
The body weight and the serum level of Na, K, Ca and PO4 were measured before and immediately after the dialysis session. The patients were requested to hold their medications on the day of the study to avoid any possible effects on the results of the echocardiographic measurements.
Conventional echocardiography
Echocardiographic examination was done by using the commercially available Vivid 9, General Electric Healthcare, GE Vingmed, Norway) equipped with a 1.7-4 MHz phased-array transducer .echocardiographic imaging were obtained in the parasternal long- and short-axis, and apical two, three and four-chamber views using standard transducer positions. LV end-diastolic diameter (LVEDD), LV end-systolic diameter (LVESD), septal (IVS) and posterior wall (PW) and relative wall thickness (RWT) in diastole, ejection fraction (EF%), and left atrial (LA) diameter were measured in accordance with the recommendations of the American Society of Echocardiography [25]. Pulsed and Continuous-wave Doppler was used for valvular assessment, Peak early (E) and late (A) transmitral filling velocities were measured from mitral inflow velocities.
Left ventricular pulsed-Tissue Doppler indices were acquired, using a 5-mm sample volume, placed on the four sites of mitral annulus in apical four and apical two views. Frame rate was adjusted between 120 and 180 Hz and average values of 3–5 consecutive heart beats were recorded. The myocardial peak systolic velocity (S max), early (E') and late (A') diastolic velocities were measured.
Longitudinal strain measurement
For measurement of LV longitudinal strain, two dimensional images from the apical four-chamber, two-chamber and three-chamber views were obtained, Frame rate was selected between 40–90 or at least 40% of HR.
All recordings included at least three cardiac cycles were digitally stored for off-line analysis. Stored images were opened by the machine software, which automatically brings up the end-systolic frame of the cardiac cycle. At the end-systolic frame, endocardial border was traced manually, beginning at one end of the mitral annulus and ending at the other end.
The software then generated a region-of-interest (ROI) including the entire myocardial thickness. The ROI was manually adjusted to achieve a satisfactory image. The software then tracked the myocardial speckles frame by frame and generated moving images displaying the tracking.
Careful visual inspection of the moving image was done to determine the adequacy of the tracking. If the tracking was not accurate, readjustment of the ROI or selection of a new ROI was done.
The software divided the LV myocardium into six segments and generated segmental and global longitudinal strain curves. As the myocardium shortens in longitudinal direction during systole, the longitudinal strain curves are displayed below the baseline.
The apical long-axis image (i.e., apical three-chamber view) was first image to be analyzed. In this view, the movement of aortic valve leaflets helps in timing the aortic valve closure which is essential for the software to be able to perform the deformation analysis [11].
The same process was then repeated with the apical four chamber and two-chamber images also. The strain values for all the segments were recorded and averaged to obtain the global longitudinal strain (GS). The ultrasound system also provided Bull’s eye display of the regional and global longitudinal strain.
Tissue synchronization imaging
Tissue synchronization software processes the acquired TVI data and provides automatic detection of the time to peak systolic velocity (PSV) at any discrete point within the wall. The obtained temporal data are translated into color coded maps of LV contraction synchronicity with color coding ranges from green (earliest), yellow, orange, to red (latest) giving a detailed quantitative information about the regions of dyssynchronously contracting LV myocardium. A color-coded image of synchronicity of LV contraction is thus created. The analyzed systolic interval was set by default to start 60 ms after the beginning of electrocardiographic R wave and to end 200 ms after the closure of the aortic valve, thus including possible postsystolic contraction. Prior to the analysis, the TSI images were frozen and scrolled to the end of systole to ensure adequate positioning of regions of interest within the myocardial wall for the whole systole. Subsequently, circular regions of interest (diameter 2 mm) were placed manually on the basal and midventricular myocardium of the opposing LV walls in apical 2, apical 4 and apical long axis views. Intraventricular mechanical dyssynchrony of a LV segment was defined according to Perry, et al. [26] as all segment maximum difference (ASMD) >105 ms, ASMD is the difference between the longest and the shortest time to PSV among all the evaluated 12 segments. Dyssynchrony index was used also to define intraventricular dyssynchrony of the LV which is the standard deviation of the time to PSV of the 12 LV segments. LV systolic dyssynchrony is defined as dyssynchrony index >32.6 msec [27].
Statistical analysis
Data were collected, tabulated, statistically analyzed by computer using SPSS version 20, two types of statistics were done:
1-Descriptive statistics: Quantitative data are expressed to measure the central tendency of data and diversion around the mean, mean (x) and standard deviation (SD).
Qualitative data expressed in number and percentage.
2- Analytic statistics: paired t test was used to compare between quantitative normally distributed data pre and post within the same group
Wilcoxon signed rank test was used to compare between quantitative not normally distributed data pre and post within the same group
P value > 0.05 was considered statistically non-significant.
P value ≤ 0.05 was considered statistically significant.
P value ≤ 0.001 was considered statistically highly significant.
Subjects' clinical and biochemical data: Table 1 summarizes the clinical and biochemical data of the studied ESRD patients, the study included 20 patients (11 males and 9 females) with mean age 63.1 ± 4.41. all the patients were hypertensive while 11 patients were diabetics and 7 patients were smoker.
Table 1. Demographic data of the studied group.
|
No |
Parameter |
(Range) 55-71 y |
63.1 ± 4.41 |
Age |
55%
45% |
11
9 |
Sex
Male
Female |
100%
0.00% |
20
0 |
Hypertension
Yes
No |
55%
45% |
11
9 |
Diabetes
Yes
No |
35%
65% |
7
13 |
Smoking
Yes
No |
Body weight was significantly reduced after HD, both serum potassium and serum PO4 were also reduced significantly after HD, while both serum Na and serum Ca showed no significant difference as shown in Table 2.
Table 2. Weight and serum electrolytes before and after HD.
P value |
Paired t test |
After HD
Mean ± SD |
Before HD
Mean ± SD |
|
< 0.001 |
11.831 |
74.50 ± 2.96 |
76.65 ± 2.73 |
Weight |
< 0.001 |
10.855 |
4.28 ± 0.406 |
5.33 ± 0.547 |
K (meq/l) |
< 0.001 |
10.890 |
1.08 ± 0.285 |
2.0 ± 0.362 |
PO4 (mg/dl) |
P > 0.05 |
4.543 |
137 ± 3.4 |
138.3 ± 4.1 |
Na (meq/l) |
P > 0.05 |
3.958 |
2.9 ± 0.32 |
3.2 ± 0.16 |
Ca (mmol/l) |
Standard echocardiographic variables: All patients had normal LVEDD, EF and FS, they all showed concentric LVH with RWT >0.45. As shown in Table 3, HD resulted in significant decrease in LVEDD, LVESD and LA diameter, while the myocardial systolic velocity (S max) increased significantly after HD. On the other hand, EF, FS, LV thickness and RWT didn't change significantly after HD. As regard diastolic variables, there was a significant decrease after HD in the mitral A velocity, while the mitral E velocity was decreased but the change didn't reach a statistical significant level. Both myocardial E' and A' velocity values were significantly increased after HD.
Longitudinal strain values: HD resulted in significant decrease in longitudinal strain values in apical 4, apical 2 and apical long axis views. The global longitudinal strain value was significantly decrease after HD from -19.65 ± 3.03 to -16.29 ± 2.75 (P<0.001) [Table 3, Figures 1 and 2].
Table 3. Conventional echocardiography, longitudinal strain and TSI data before and after HD.
P value |
Paired t test |
After HD
Mean ± SD |
Before HD
Mean ± SD |
|
< 0.001 |
10.299 |
51.2 ± 3.87 |
53.3 ± 4.156 |
LVEDD |
< 0.001 |
6.110 |
35.1 ± 3.59 |
36.45 ± 3.20 |
LVESD |
0.083 |
1.83 |
12.6 ± 0.68 |
12.9 ± 0.911 |
IVS |
1.00 |
0.00 |
12.35 ± 0.489 |
12.35 ± 0.671 |
PW |
0.352 |
9.54 |
31.00 ± 4.34 |
31.4 ± 3.60 |
FS |
0.245 |
1.191 |
61.1 ± 5.41 |
60.6 ± 4.99 |
EF |
0.030 |
2.34 |
31.20 ± 2.61 |
31.75 ± 2.55 |
AO |
< 0.001 |
6.164 |
41.45 ± 3.73 |
42.45 ± 3.73 |
LA |
0.070 |
1.922 |
93.70 ± 26.51 |
103.7 ± 20.18 |
E |
< 0.001 |
5.769 |
97.30 ± 32.27 |
107.00 ± 33.45 |
A |
0.205 |
1.312 |
1.029 ± 0.354 |
0.992 ± 0.269 |
E/A |
0.025 |
2.443 |
0.489 ± 0.054 |
0.475 ± 0.057 |
RWT |
< 0.001 |
10.41 |
5.78 ± 0.76 |
5.23 ± 0.81 |
SDTI |
< 0.001 |
5.74 |
6.45 ± 0.76 |
5.71 ± 1.20 |
EDTI |
< 0.001 |
3.581 |
7.56 ± 1.03 |
6.67 ± 1.49 |
ADTI |
< 0.001 |
11.69 |
-15.42 ± 3.89 |
-19.04 ± 3.81 |
AP4S |
< 0.001 |
11.528 |
-17.06 ± 2.33 |
-20.16 ± 2.88 |
AP2S |
< 0.001 |
15.465 |
-16.66 ± 3.35 |
-19.73 ± 3.66 |
AP3S |
< 0.001 |
16.82 |
-16.29 ± 2.75 |
-19.65 ± 3.03 |
GS |
< 0.001 |
5.58 |
102.60 ± 20.84 |
123.65 ± 33.94 |
ASMD |
< 0.001 |
7.105 |
40.15 ± 8.51 |
52.2 ± 12.31 |
Dyssynchrony Index |
AO: aorta; ASMD: all segment maximum difference; AP2S: apical 2 view strain; AP3S: apical 3 view strain; AP4S: apical 4 view strain; A: atrial contraction velocity by conventional echocardiography; ADTI: atrial contraction velocity by Doppler tissue imaging; E: early diastolic velocity by conventional echocardiography; EDTI: early diastolic velocity by Doppler tissue imaging; EF: ejection fraction; FS: fractional shortening; GS: global strain; HD: hemodialysis; IVS: interventricular septum; LA; left atrium; PW: posterior wall; RWT: relative wall thickness.
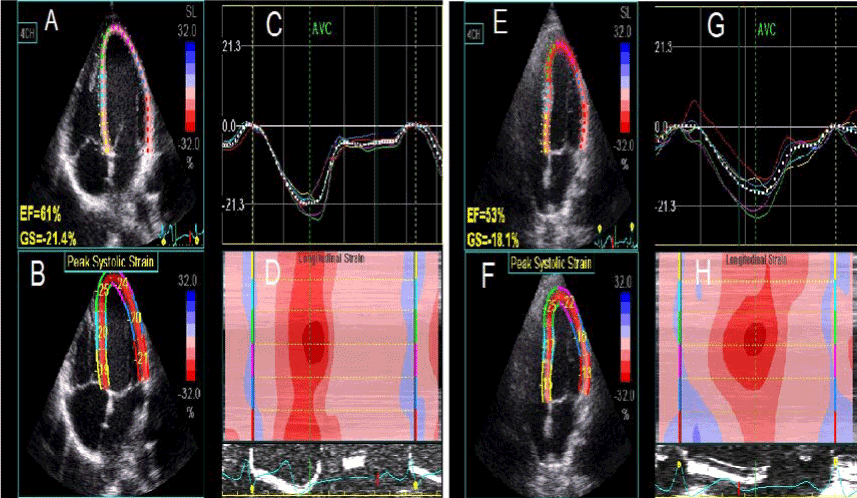
Figure 1. LV longitudinal strain obtained from AP4 view before (left panel) and after (right panel) HD session. (A) and (E) show the EF and GS, (B) and (F) show the segmental longitudinal LV strain values, (C) and (G) show the longitudinal strain curve of the LV segments, (D) and (H) show the color coded map of the LV longitudinal strain.
AP4: apical four; EF: ejection fraction; GS: global longitudinal strain; HD: hemodialysis.
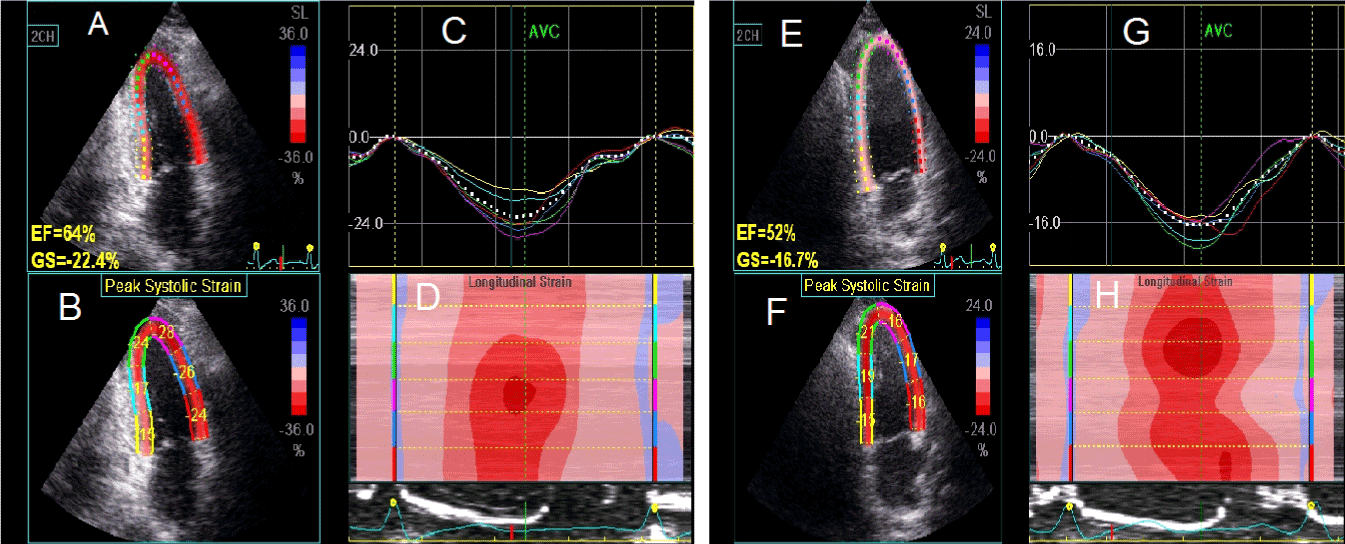
Figure 2. LV longitudinal strain obtained from AP2 view before (left panel) and after (right panel) HD session. (A) and (E) show the EF and GS, (B) and (F) show the segmental longitudinal LV strain values, (C) and (G) show the longitudinal strain curve of the LV segments, (D) and (H) show the color coded map of the LV longitudinal strain.
AP2: apical two; EF: ejection fraction; GS: global longitudinal strain; HD: hemodialysis.
Intra-left ventricular synchronicity: All patients showed intra-LV asynchrony before HD (ASMD 123.65 ± 33.94; dyssynchrony index 52.2 ± 12.31; Table 3). HD caused a significant decrease in ASMD from 123.65 ± 33.94 to 102.60 ± 20.84, P<0.001 (Table 3 and Figure 3). Though the value of dyssynchrony index didn't fall below 32.6 after HD [which is the cut off value of dyssynchrony index as described by Yu CM, et al. [27], but it decreased significantly from 52.2 ± 12.31 to 40.15 ± 8.51, P<0.001 (Table 3 and Figure 3). Furthermore, it has been shown that the LV synchronicity parameters in the form of ASMD and dyssynchrony index showed a significant positive relation with LVEDD while it showed no significant relation with serum electrolyte levels (Table 4, Figures 4 and 5).
Table 4. Correlation of LV synchronicity parameters (ASMD and dyssynchrony index) with LVEDD and serum electrolytes
|
ASMD |
Dyssynchrony Index |
LVEDD |
r = 0.53 |
r = 0.61 |
P < 0.05 |
P < 0.05 |
Na |
r = -0.12 |
r = -0.27 |
P > 0.05 |
P > 0.05 |
K |
r = 0.2 |
r = 0.1 |
P > 0.05 |
P > 0.05 |
Ca |
r = -0.03 |
r = -0.2 |
P > 0.05 |
P > 0.05 |
Po4 |
r = 0.03 |
r = 0.02 |
P > 0.05 |
P > 0.05 |
ASMD: all segment maximum difference; LVEDD: left ventricular end diastolic diameter.
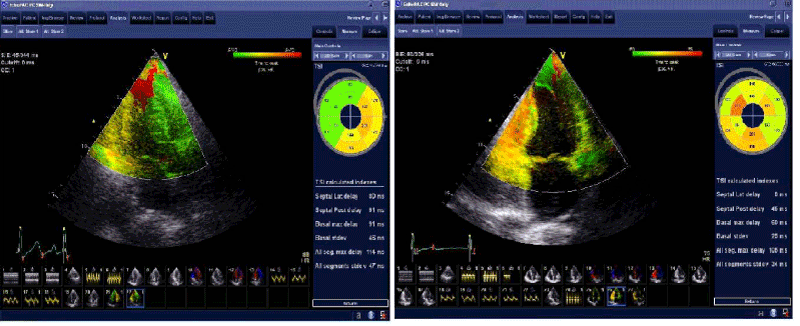
Figure 3. Tissue synchronization imagine before (left panel) and after (right panel) HD session. Before HD, ASMD was 114 ms and dyssynchrony index was 47 ms. After HD, normalization of all TSI parameters is evident, the value ASMD was 105 ms and dyssynchrony index was 34 ms.
ASMD: all segment maximum difference; HD: hemodialysis; ms: milliseconds; PSV: peak systolic velocity; SD: standard deviation; TSI: tissue synchronization imagine.
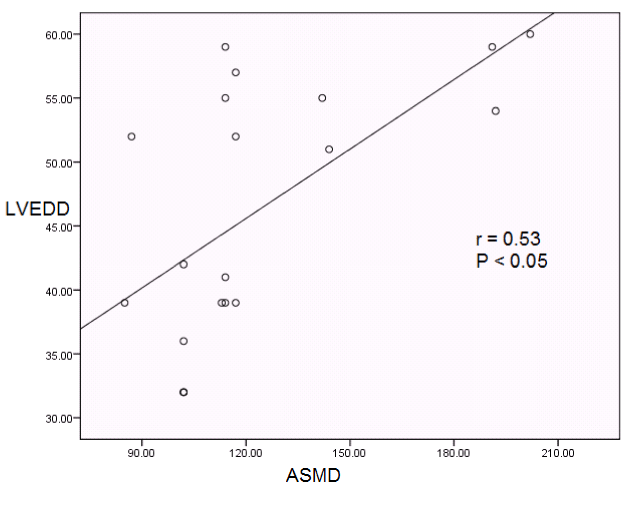
Figure 4. Correlation between ASMD and LVED.
ASMD: all segment maximum difference; LVED: left ventricular end diastolic diameter.
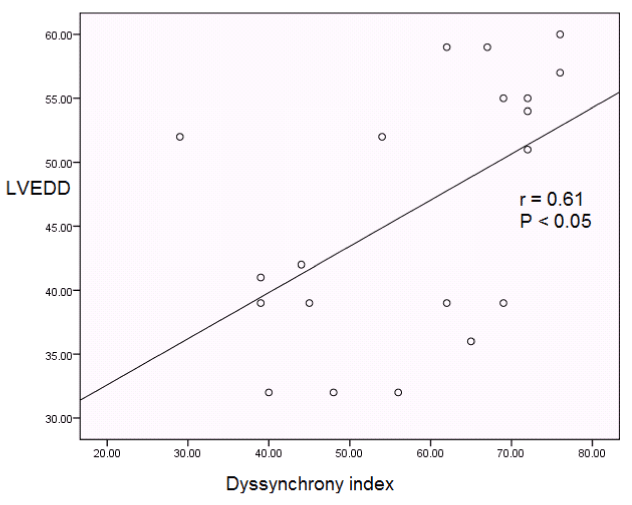
Figure 5. Correlation between dyssynchrony index and LVED .
LVED: left ventricular end diastolic diameter.
In this study, we evaluated the effect of acute preload reduction after a HD session on LV mechanics in patients with ESRD. The obtained results indicate that Intra-LV dyssynchrony is present in patients with ESRD and decreases significantly after a HD session. Furthermore, the severity of disturbance in intraventricular synchronicity is related positively to the LVEDD.
CKD patients, particularly those with ESRD, are at much higher risk of CVD in comparison with the age- and sex-matched general population, with increased prevalence of coronary artery disease, small vessel disease, silent myocardial ischaemia, complex arrhythmias [28], LVH, valvar calcifications [29] and arteriosclerosis [30]. CVD is a major cause of morbidity and mortality in dialysis patients, accounting for almost 40% of hospitalisations and 79-80% reduction in life expectancy [31,32].
The existence of LV mechanical dyssynchrony may have the potential to contribute to the high incidence of cardiac events or deaths in patients with ESRD receiving HD therapy since the non-uniformity of LV contraction impairs systolic performance. Therefore, it is clinically important to identify LV mechanical dyssynchrony and to address its underlying mechanisms in such a population. It is widely recognized that abnormal electrical activation sequences of the heart can induce the abnormal onset of myocardial contraction resulting in LV mechanical dyssynchrony [33,34]. However, LV mechanical dyssynchrony can be caused not only by abnormal electrical activation but also by the heterogeneity of myocardial tissue damage and the non-uniformity of the ventricular wall structure [35]. Furthermore, significant mechanical dyssynchrony is usually absent in 30-58% of patients with QRS duration >120 ms [7,26,36,37], being at the same time present in 65% of individuals with QRS<120 ms [26] our results went in the same direction as we found that intra-LV dyssunchrony is present in patients with ESRD despite having normal QRS duration.
The TSI technique is a novel echocardiographic imaging modality that analyzes myocardial tissue velocity signals and provides the timing of regional peak systolic velocities in relation to the onset of depolarization. The method has been proved to be reliable and reproducible [9,26] and its capacity to identify significant systolic dyssynchrony and thereby predict a positive response to CRT has been found to be superior to that of QRS duration criteria [9,26,38].
The impact of CKD and HD on LV function was assessed by Liu et al who examined 97 patients with ESRD and 56 control using 2D speckle tracking echocardiography, and he concluded that CKD and ESRD patients had more negative global ventricular strain compared with controls in order to maintain similar EF [22]. Similarly, we found that the longitudinal strain values in apical views and the global LV systolic strain were more negative in our patients before dialysis and these values were significantly reduced after the HD session.
The definition of LV dyssynchrony in the present study was based on the cutoff value proposed by Perry et al., who studied a cohort of 100 volunteers with normal LV systolic function and normal QRS duration [22] The mean level of dyssynchrony in these individuals was found to be 47 ± 29 ms that gives the mean value equal to 105 ms as the cutoff for a significant dyssynchrony of LV during systole [26].
Murata, et al. [6] assessed the role of HD on LV mechanical dyssynchrony in 23 patients with ESRD using 2D speckle tracking echocardiography, and he concluded that patients with ESRD were associated with longitudinal and radial LV dyssynchronies, and that HD dramatically improved the radial LV dyssynchrony [6]. The effect of a single HD session on LV mechanical dyssynchrony was also assessed by Hyashi, et al. [35] using TSI technique, and he found that all the examined patients had LV dyssynchrony before HD and the HD session caused complete normalization in LV synchronicity in 23% of the patients and a significant decrease in the average maximal systolic LV mechanical delay. Furthermore, the percentage of delayed LV segments before HD was positively related to LVEDD [35]. Our results went in parallel with those findings, as we found that all our patients showed LV dyssynchrony before HD which was improved significantly after a single session of HD. In addition, the parameters used to assess the LV dyssynchrony were positively related significantly to the LVEDD, whereas they showed no significant relation with the serum electrolytes level denoting that the detected LV dyssynchrony in ESRD before HD was not influenced by the electrolyte disturbances commonly seen in such patients and it is mainly affected by the LV volume overload before HD.
It has been demonstrated in animal studies and experiments in humans that sustained stretching of myocardial fibres due to increased ventricular loading induces shortening of the myocardial action potential and effective refractory time, and increase in activation time and dispersion of action potential duration. Even if the results of some studies in animals challenge any significant impact of load alterations on the outcome of the contraction–excitation interaction under normal conditions, changes in loading conditions may be of significantly greater electrophysiological implication under pathological conditions that may distort the normal mechano-electrical feedback mechanism [39-41].
Mechanical LV dyssynchrony has marked deleterious effects on ventricular pump function leading to prolonged contraction and reduced ejection time, delayed relaxation with reduced diastolic filling time, mitral regurgitation [5,41] and arrhythmia susceptibility [4]. Similar effects can be expected in ESRD patients and the occurrence of LV dyssynchrony in this population is considered an important risk factor and bad prognostic sign [36,42].
In conclusion, the result of the present study indicate that intra-LV mechanical dyssynchrony is present in patient with ESRD and this dyssynchrony can be significantly normalized by a single HD session and it correlates positively with LVEDD suggesting the deleterious effect of volume overload and may be the accumulating toxins on LV myocardium in patients with ESRD.
2021 Copyright OAT. All rights reserv
The authors declare that there is no conflict of interests regarding the publication of this article.
- (2003) USRDS: the United States Renal Data System. Am J Kidney Dis 42: 1-230. [Crossref]
- Vanholder R, Massy Z, Argiles A, Spasovski G, Verbeke F, et al. (2005) Chronic kidney disease as cause of cardiovascular morbidity and mortality. Nephrol Dial Transplant 20: 1048-1056. [Crossref]
- Bleyer AJ, Russell GB, Satko SG (1999) Sudden and cardiac death rates in hemodialysis patients. Kidney Int 55: 1553-1559. [Crossref]
- Spragg DD, Akar FG, Helm RH, Tunin RS, Tomaselli GF, et al. (2005) Abnormal conduction and repolarization in late-activated myocardium of dyssynchronously contracting hearts. Cardiovasc Res 67: 77-86. [Crossref]
- Spragg DD, Kass DA (2006) Pathobiology of left ventricular dyssynchrony and resynchronization. Prog Cardiovasc Dis 49: 26-41. [Crossref]
- Murata T, Dohi K, Onishi K, Sugiura E, Fujimoto N, et al. (2011) Role of haemodialytic therapy on left ventricular mechanical dyssynchrony in patients with end-stage renal disease quantified by speckle-tracking strain imaging. Nephrol Dial Transplant 26:1655-1661. [Crossref]
- Yu CM, Zhang Q, Fung JW, Chan HC, Chan YS, et al. (2005) A novel tool to assess systolic asynchrony and identify responders of cardiac resynchronization therapy by tissue synchronization imaging. J Am Coll Cardiol 45: 677-684. [Crossref]
- Bax JJ, Bleeker GB, Marwick TH, Molhoek SG, Boersma E, et al. (2004) Left ventricular dyssynchrony predicts response and prognosis after cardiac resynchronization therapy. J Am Coll Cardiol 44: 1834-1840. [Crossref]
- Nico R Van de Veire, Gabe B Bleeker, Johan De Sutter, Claudia Ypenburg, Eduard R Holman, et al. (2007) Tissue synchronization imaging accurately measures left ventricular dyssynchrony and predicts response to cardiac resynchronisation therapy. Heart 93: 1034-1039. [Crossref]
- Villari B, Vassalli G, Betocchi S, Briguori C, Chiariello M, et al. (1996) Normalization of left ventricular nonuniformity late after valve replacement for aortic stenosis. Am J Cardiol 78: 66-71. [Crossref]
- London GM (2003) Left ventricular hypertrophy: why does it happen? Nephrol Dial Transplant 18: viii2-6. [Crossref]
- Foley RN, Parfrey PS, Harnett JD, Kent GM, Martin CJ, et al. (1995) Clinical and echocardiographic disease in patients starting end-stage renal disease therapy. Kidney Int 47: 186-192. [Crossref]
- Dahan M, Siohan P, Viron B, Michel C, Paillole C, et al. (1997) Relationship between left ventricular hypertrophy, myocardial contractility, and load conditions in hemodialysis patients: an echocardiographic study. Am J Kidney Dis 30: 780-785. [Crossref]
- Parfrey PS, Foley RN, Harnett JD, Kent GM, Murray DC, et al. (1996) Outcome and risk factors for left ventricular disorders in chronic uraemia. Nephrol Dial Transplant 11: 1277-1285. [Crossref]
- Amann K, Ritz E (1997) Cardiac disease in chronic uremia: pathophysiology. Adv Ren Replace Ther 4: 212-224. [Crossref]
- Amann K, Breitbach M, Ritz E, Mall G (1998) Myocyte/capillary mismatch in the heart of uremic patients. J Am Soc Nephrol 9: 1018-1022. [Crossref]
- Hayashi SY, Brodin LA, Alvestrand A, Lind B, Stenvinkel P, et al. (2004) Improvement of cardiac function after haemodialysis. Quantitative evaluation by colour tissue velocity imaging. Nephrol Dial Transplant 19:1497-1506. [Crossref]
- Gulel O, Soylu K, Yuksel S, Karaoglanoglu M, Cengiz K, et al. (2008) Evidence of left ventricular systolic and diastolic dysfunction by color tissue Doppler imaging despite normal ejection fraction in patients on chronic hemodialysis program. Echocardiography 25: 569-574. [Crossref]
- Rudhani ID, Bajraktari G, Kryziu E, Zylfiu B, Sadiku S, et al. (2010) Left and right ventricular diastolic function in hemodialysis patients. Saudi J Kidney Dis Transpl 21: 1053-1057. [Crossref]
- Yan P, Li H, Hao C, Shi H, Gu Y, et al. (2011) 2D-speckle tracking echocardiography contributes to early identification of impaired left ventricular myocardial function in patients with chronic kidney disease. Nephron Clin Pract 118: c232-240. [Crossref]
- Dandel M, Lehmkuhl H, Knosalla C, Suramelashvili N, Hetzer R (2009) Strain and strain rate imaging by echocardiography - basic concepts and clinical applicability. Curr Cardiol Rev 5: 133-148. [Crossref]
- Liu YW, Su CT, Huang YY, Yang CS, Huang JW, et al. (2011) Left ventricular systolic strain in chronic kidney disease and hemodialysis patients. Am J Nephrol 33: 84-90. [Crossref]
- Choi JO, Shin DH, Cho SW, Song YB, Kim JH, et al. (2008) Effect of preload on left ventricular longitudinal strain by 2D speckle tracking. Echocardiography 25: 873-879. [Crossref]
- Makar SH, Sawires HK, Farid TM, Ali WM, Schaalan M (2010) Effect of high-flux versus low-flux dialysis membranes on parathyroid hormone. Iran J Kidney Dis 4: 327-332. [Crossref]
- Maron BJ, McKenna WJ, Danielson GK, Kappenberger LJ, Kuhn HJ, et al. (2003) ACC/ESC clinical expert consensus document on hypertrophic cardiomyopathy. A report of ACC Foundation Task Force on Clinical Expert Consensus Documents and the ESC Committee for Practice Guidelines. Eur Heart J 24: 1965-1991. [Crossref]
- Perry R, De Pasquale CG, Chew DP, Aylward PE, Joseph MX (2006) QRS duration alone misses cardiac dyssynchrony in a substantial proportion of patients with chronic heart failure. J Am Soc Echocardiogr 19: 1257-1263. [Crossref]
- Yu CM, Fung WH, Lin H, Zhang Q, Sanderson JE, et al. (2003) Predictors of left ventricular reverse remodeling after cardiac resynchronization therapy for heart failure secondary to idiopathic dilated or ischemic cardiomyopathy. Am J Cardiol 91: 684-688. [Crossref]
- D'Elia JA, Weinrauch LA, Gleason RE, Hampton LA, Smith-Ossman S, et al. (1988) Application of the ambulatory 24-hour electrocardiogram in the prediction of cardiac death in dialysis patients. Arch Intern Med 148: 2381-2385. [Crossref]
- Varma R, Aronow WS, McClung JA, Garrick R, Vistainer PF, et al. (2005) Prevalence of valve calcium and association of valve calcium with coronary artery disease, atherosclerotic vascular disease, and all-cause mortality in 137 patients undergoing hemodialysis for chronic renal failure. Am J Cardiol 95: 742-743. [Crossref]
- Blacher J, Guerin AP, Pannier B, Marchais SJ, Safar ME, et al. (1999) Impact of aortic stiffness on survival in end-stage renal disease. Circulation 99: 2434-2439. [Crossref]
- Locatelli F, Marcelli D, Conte F, D'Amico M, Del Vecchio L, et al. (2000) Cardiovascular disease in chronic renal failure: the challenge continues. Registro Lombardo Dialisi e Trapianto. Nephrol Dial Transplant 15: 69-80. [Crossref]
- Jungers P, Choukroun G, Robino C, Massy ZA, Taupin P, et al. (2000) Epidemiology of end-stage renal disease in the Ile-de-France area: a prospective study in 1998. Nephrol Dial Transplant 15: 2000-2006. [Crossref]
- Suffoletto MS, Dohi K, Cannesson M, Saba S, Gorcsan J 3rd (2006) Novel speckle-tracking radial strain from routine black-and-white echocardiographic images to quantify dyssynchrony and predict response to cardiac resynchronization therapy. Circulation 113: 960-968. [Crossref]
- Miyazaki C, Powell BD, Bruce CJ, Espinosa RE, Redfield MM, et al. (2008) Comparison of echocardiographic dyssynchrony assessment by tissue velocity and strain imaging in subjects with or without systolic dysfunction and with or without left bundle-branch block. Circulation 117: 2617-2625. [Crossref]
- Hayashi SY, Seeberger A, Lind B, et al. (2008) A single session of haemodialysis improves left ventricular synchronicity in patients with endstage renal disease: a pilot tissue synchronization imaging study. Nephrol Dial Transplant 23: 3622–3628.
- Bader H, Garrigue S, Lafitte S, Nowak J, do Nascimento MM, et al. (2004) Intra-left ventricular electromechanical asynchrony. A new independent predictor of severe cardiac events in heart failure patients. J Am Coll Cardiol 43: 248-256.
- Yu CM, Lin H, Zhang Q, Sanderson JE (2003) High prevalence of left ventricular systolic and diastolic asynchrony in patients with congestive heart failure and normal QRS duration. Heart 89: 54-60. [Crossref]
- Gorcsan J 3rd, Kanzaki H, Bazaz R, Dohi K, Schwartzman D (2004) Usefulness of echocardiographic tissue synchronization imaging to predict acute response to cardiac resynchronization therapy. Am J Cardiol 93: 1178-1181. [Crossref]
- Taggart P, Sutton P, Lab M, Runnalls M, O'Brien W, et al. (1992) Effect of abrupt changes in ventricular loading on repolarization induced by transient aortic occlusion in humans. Am J Physiol 263: H816-823. [Crossref]
- Zabel M, Portnoy S, Franz MR (1996) Effect of sustained load on dispersion of ventricular repolarization and conduction time in the isolated intact rabbit heart. J Cardiovasc Electrophysiol 7: 9-16. [Crossref]
- Reiter MJ, Landers M, Zetelaki Z, Kirchhof CJ, Allessie MA (1997) Electrophysiological effects of acute dilatation in the isolated rabbit heart: cycle length-dependent effects on ventricular refractoriness and conduction velocity. Circulation 96: 4050-4056. [Crossref]
- Bleeker GB, Bax JJ, Steendijk P, Schalij MJ, van der Wall EE (2006) Left ventricular dyssynchrony in patients with heart failure: pathophysiology, diagnosis and treatment. Nat Clin Pract Cardiovasc Med 3: 213-219. [Crossref]