Abstract
Neuropeptide Y (NPY) and NPY Y2 receptor (Y2R) is involved in the stress-induced visceral obesity in mice. We have previously reported the association between 5’-flanking region of Y2R gene SNPs and plasma HDL-cholesterol levels in healthy subjects. Plasma HDL-cholesterol levels were significantly different in subjects with each SNPs (rs6857530; GG<GA<AA or rs6857715; TT<TC<CC). The luciferase activity was detected in HepG2 but not in macrophage differentiated from THP-1 cells when used pGL3-Basic vector including 5’-flanking region of Y2R gene with rs6857530GG plus rs6857715TT. The aim of the study is to elucidate further the mechanism underlying the association between Y2R gene SNPs and plasma HDL-cholesterol levels. After confirming that the sequences of the 5’-flanking region of Y2R gene included heterozygous rs6857530 (G/A) and rs6857715 (T/C) in HepG2 cells, we compared the effect of NPY alone and NPY plus Y2R antagonist BIIE0246 on gene expression in cultured HepG2 cells using real-time reverse transcription PCR (real-time RT-PCR) and microarray. BIIE0246 addition to HepG2 cells failed to change the mRNA expression levels of representative HDL metabolic regulators such as apo-lipoprotein A1 by real-time RT-PCR. BIIE0246 up-regulated (>1.5-fold) 743 entities, and down-regulated (<0.67-fold) 492 entities of 54,675 probe sets. BIIE0246-upregulated genes significantly (P-value<0.001) related to gene ontology (GO) categories of 3 biological processes, 7 cellular components and 1 molecular function. Three biological processes were chylomicron remodeling, negative regulation of cholesterol and sterol transport. BIIE0246-downregulated genes significantly related to GO categories of 44 biological processes, 11 cellular components and 1 molecular function. Furthermore, BIIE0246-downregulated genes were significantly involved in 44 pathways (P<0.01), in which sterol responsive element binding protein signaling were included. BIIE0246-upregulated genes were significantly involved in 22 pathways including vitamin B12/lipoprotein metabolism (P=0.0048). These results suggest that Y2R blockade might inhibit cholesterol synthesis and raise plasma HDL-cholesterol levels, suggesting a new therapeutic drug for dyslipidemia in subjects with specific Y2R SNPs.
Key words
neuropeptide Y, Y2 receptor antagonist, BIIE0246, microarray, pathway, HDL-cholesterol, HepG2 cells
Introduction
Neuropeptide Y (NPY) is originally isolated from porcine brain [1] and generally known to stimulate appetite through hypothalamic NPY Y1 receptor as shown in our review [2]. Stress stimulates not only cortisol secretion from adrenal cortex but also NPY release from sympathetic nerve terminal, especially with concomitant excess food intake. NPY Y2 receptor (Y2R) is involved in visceral obesity induced by stress with high caloric diet in mice [3]. We have previously examined the association between 5’-flanking region of Y2R gene single nucleotide polymorphism (SNP) s and metabolic traits and reported the significant association between these SNPs and plasma HDL-cholesterol levels in healthy subjects [4]. Plasma HDL-cholesterol levels were significantly different in subjects with each SNPs (rs6857530; GG<GA<AA or rs6857715; TT<TC<CC).
Recently, the clinical trial of cholesterol ester transfer protein (CETP) inhibitor could raise plasma HDL-cholesterol levels but not improve cardiovascular events [5]. HDL has a variety of functions such as reverse transport of cholesterol to the liver, anti-oxidation, anti-inflammation and immune functions [6-10]. Not only quantity but also quality of HDL is thus being considered important. Despite these evidences, plasma low levels of HDL-cholesterol are still an important risk factor for cardiovascular disorders.
We have previously reported cell type- and SNP-dependent Y2R gene expression [11]. The luciferase activity was detected in human hepatoma cell line HepG2 when used pGL3-Basic vector inserted with 5’-flanking region of Y2R gene containing rs6857530GG plus rs6857715TT but not with rs6857530 AA plus rs6857715CC. The aim of the study is to elucidate further the mechanism underlying the association between Y2R gene SNPs and plasma HDL-cholesterol levels. The effect of potent and selective Y2R antagonist BIIE0246 [12] on the regulation of individual key gene and comprehensive gene in HepG2 cells were examined by using real-time reverse-transcription polymerase chain reaction (real-time RT-PCR) and cDNA microarray, respectively.
Materials and methods
Cell culture
HepG2 cells were purchased from Health Science Research Resources Bank (Osaka Japan) and cultured in DMEM with 5% fetal bovine serum at 37C under atmosphere of 5% CO2 as described previously [11].
SNP typing
DNA was extracted from cultured HepG2 cells by phenol-chloroform method. The 5’-flanking region of Y2R gene including rs6857530 and rs6857715 were amplified by PCR using primer sets (forward; ttcgtgtcccatagctttcc and reverse; tctagctgggcggtccctgtg) in thermal cycler (Techgene, Techne, St. Louis, Mo). PCR product was directly sequenced by Sanger method as described previously [4].
Real-time RT-PCR
HepG2 cells were cultured to compare 4 groups in real-time RT-PCR study; no addition, 100nM NPY (ABGENT) alone, 1µM BIIE0246 (TOCRIS bioscience) alone, and NPY plus BIIE0246 for 24 h. Cultured cells were lysed by real time ready cell lysis kit (Loche Applied Science). RNA lysates were used as template in the cDNA synthesis reaction using transcriptor universal cDNA master (Loche Applied Science). Real-time RT-PCR was performed in the reaction mixture of Faststart Essential DNA Green Master (Loche Applied Science), primer sets for test gene and reverse-transcribed cDNA using Light Cycler Nano (Loche Applied Science). Test genes are apo-lipoprotein A1 (ApoA1) (forward primer; cacggtggtgaagtacctgag, and reverse primer; cgctgaactggtattcgttaaa), ApoA1 binding protein (forward primer; cacggtggtgaagtacctgag, and reverse primer; cgctgaactggtattcgttaaa), CETP (forward primer; ccaaccaggaaatcttccaa, and reverse primer; ggcagtggacggtgactt), scavenger receptor-B1 (SR-B1) (forward primer; tttgtggttctgcgttgaag, and reverse primer; cttgctgaggggagtcactt), and hepatic lipase (forward primer; tacaggagtgcggcttcaa, and reverse primer; tgccagatccagttttctagc). Reference gene β-actin was used as an internal control for normalization. The comparative CT (∆∆CT) method was selected to determine the amount of target DNA sequence in each sample relative to the untreated sample. Analysis of variance was used for statistical significance of the difference of 4 groups (IBM SPSS, v. 22.0)
Microarray analysis
HepG2 cells were cultured to compare 2 groups in microarray study; 100nM NPY alone and 100nM NPY plus 1µM BIIE0246. RNA was isolated from 4 replicates of each cell group by total RNA purification kit (Biosynthesis). RNA integrity number (RIN), ideally higher than 7.0, was 10.0 in both control and BIIE0246-treated cells assessed by Bioanalyzer (Agilent Technologies). A260/A280 of isolated RNA was 2.00 in control cells and 1.99 in BIIE0246-treated cells assessed by spectrophotometer NanoDrop ND-1000 (NanoDrop Technologies).
Total RNA was reverse-transcribed to cDNA, and in vitro transcription reaction was then carried out to prepare biotin-labelled cRNA. Biotin-labelled cRNA 12.5 µg were hybridized to the array platform Human Genome U133 Plus 2.0 Array for 16 h. This microarray contains 54,675 probe sets that correspond to 47,400 transcripts or 38,500 genes. After washing by GeneChip Fluidics Station 450 and staining with phycoerythrin, array was scanned by GeneChip Scanner 3000 7G. Normalization and summarization was carried out by Affimetrix GeneChip Command Console Software (AGCC) and Affimetrix Expression Console Software using MAS5 statistical algorithm. Probe set for each transcript consists of 11 pairs of 25-mer perfect match (PM) and mismatch (MM) probe cell within 600 bases from 3’ end. The sequence for PM and MM are the same except for a change in the middle of the MM probe sequence. The signal was calculated from the combined, background-adjusted, PM minus MM values of the probe set. When the PM signal was significantly stronger than MM signal, the signal was considered present (one-sided Wilcoxon’s signal rank test; P<0.04). In order to correct chip variation, signal values were normalized to the value of upper 75 percent distribution of each chip as 1 (log2 1=0).
GeneSpring GX was used for scatter plots, hierarchical cluster, the analyses of gene ontology (GO) and pathway. Hierarchical clustering was performed by using clustering algorithm. The results were shown as dendrogram with heat map. AmiGO 2 database (http://amigo.geneontology.org/amigo) was used for GO analysis. The ratio of regulated genes vs. total genes in the GO term was considered statistically significant when P-value was less than 0.001. WikiPathways database (http://www. wikipathways.org/index.php/WikiPathways) was used for pathway analysis (Single Experiment Analysis). This database is an open, public platform dedicated to the analysis of biological pathways by and for the scientific community. The ratio of regulated genes vs. total genes involved in the pathway was considered statistically significant when P-value was less than 0.01.
Results
SNP typing
Direct sequencing the 5’-flanking region of Y2R gene from HepG2 cells resulted in heterozygous rs6857530 (G/A) and rs6857715 (T/C) (Figure 1).
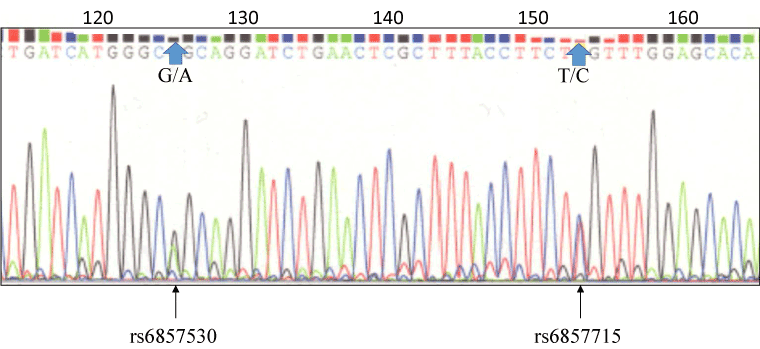
Figure 1. Direct sequencing of the 5’-flanking region of Y2R gene in HepG2 cells resulted in heterozygous rs6857530 (G/A) and rs6857715 (T/C).
Effect of BIIE0246 on mRNA levels of HDL metabolic regulators assessed by real-time RT-PCR
Effect of 1 µM BIIE0246 treatment on the mRNA levels of representative HDL metabolic regulators relative to β-actin in HepG2 cells was evaluated by real-time RT-PCR. BIIE0246 failed to change mRNA levels of APoA1 and ApoA1 binding protein. Although BIIE0246 appeared to decrease CETP, SR-B1 and hepatic lipase mRNA expression levels, the differences were not statistically significant among cells added by none, 100nM NPY alone, 1 µM BIIE0246 alone, and 100nM NPY plus 1 µM BIIE0246 (n=4, representative results of 3 repeated experiments) (Figure 2).
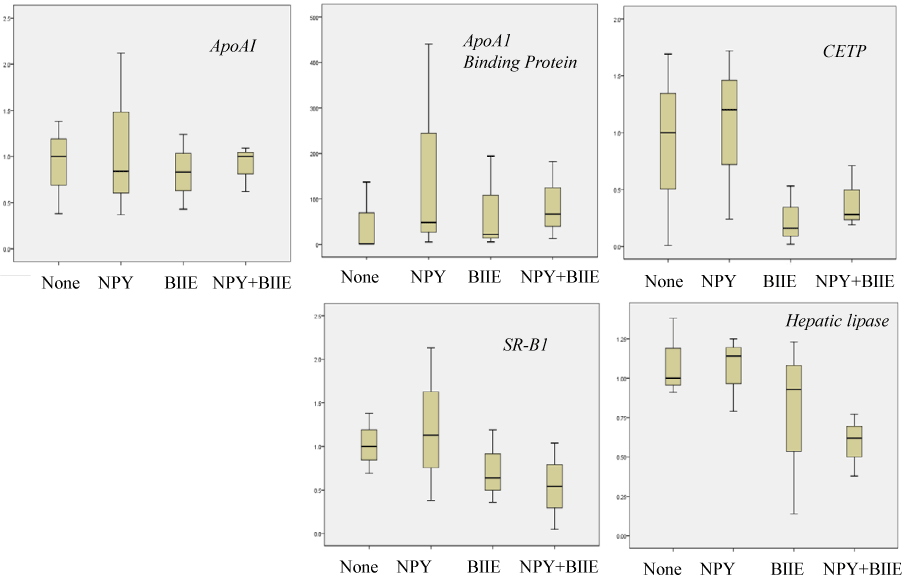
Figure 2. Effect of 100ng NPY and/or 1 µg BIIE0246 on ApoA1, ApoA1 binding protein, CETP, SR-B1 and hepatic lipase mRNA levels in HepG2 cells evaluated by real-time RT-PCR. mRNA levels were expressed as relative ratio to house keeping gene β-actin mRNA levels.
Microarray basic analysis
The effect of Y2R antagonist BIIE0246 on comprehensive gene expression in cultured HepG2 was examined using microarray. Signal ratio (3’/5’) of housekeeping gene GAPDH cRNA was 0.90 in control cells and 0.87 in BIIE0246-treated cells assessed by Affimetrix Expression Console. The result showed that the microarray method using 3’ probe was considered reliable, since the ideal signal ratio was less than 3.
Scatter plots visualized signal distribution of mRNA expression levels in NPY- vs. NPY plus BIIE0246-treated HepG2 cells (Figure 3-a.). In 54,675 probe sets, BIIE0246 up-regulated (>1.5-fold) 743 entities, and down-regulated (<0.67-fold) 492 entities.
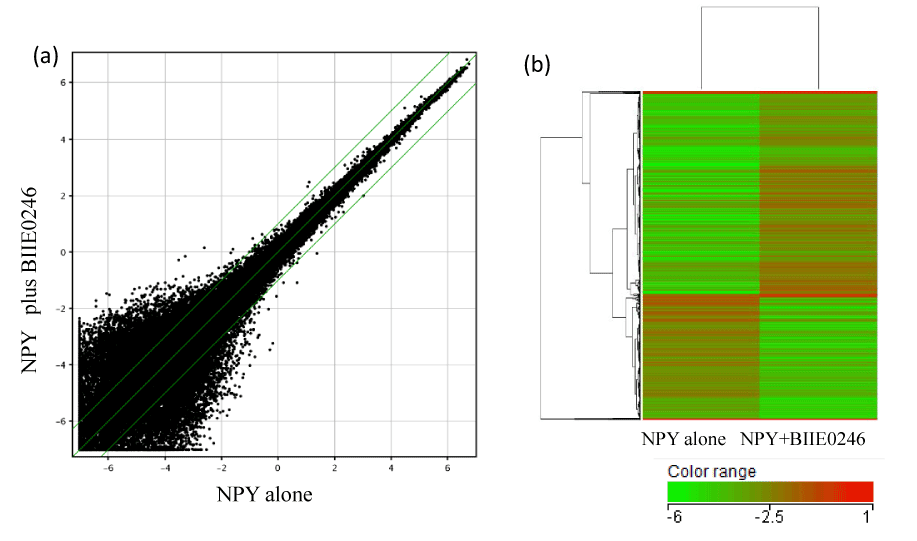
Figure 3. (a) Effect of Y2R antagonist BIIE0246 on gene expression in HepG2 cells was compared by scatter plots. Signal values are expressed as log2 after 75% shift normalization. Two-fold up-regulation, no change and 2-fold down-regulation are shown as upper, middle and lower diagonal green line, respectively. (b) Hierarchical clustering of top 1000 regulated genes were shown by dendrogram with heatmap. The grade of up- and down-regulation are shown by red and green color gradation, respectively, as indicated by color range (signal log ratio).
The top 10 up-regulated genes included MIOS (gene symbol) (fold-change; 4.7), LGLS8-AS1 (3.65), LOC100507477 (3.6), ITGB3 (3.5), and RASSF6 (3.25). ITGB3 (integrin β3) is related to negative regulation of lipoprotein metabolic process (GO; 0050748). The top 10 down-regulated genes were HMGA2 (0.246), LRRC14 (0.293), ZCCHC12 (0.314), PECAM1 (0.325), TMEM50B (0.346).
Fold change of ApoA1 and SR-B1 mRNA level were 0.99 and 1.21, respectively. The results were similar with the ratio measured by real-time RT-PCR.
Hierarchical clustering
Cluster analysis was performed among top 1000 entities regulated by BIIE0246. BIIE0246 up- and down-regulated entities that were grouped within a cluster which are co-regulated and functionally related (Figure 3-b.).
GO analysis
GO consists 3 categories of biological processes, cellular components, and molecular function. BIIE0246 up-regulated the genes significantly involved in 3 GO terms related to biological processes, 7 GO terms to cellular components and 1 GO term to molecular function (Fisher’s exact test; P-value<0.001). Three GO terms related to biological processes were chylomicron remodeling, negative regulation of cholesterol and negative regulation of sterol transport. GO term of chylomicron remodeling included 5 entities (GO; 0034371), in which 2 entities, ApoC2 and ApoA4, were up-regulated. GO term of negative regulation of cholesterol or sterol transport included 14 entities (GO; 0032375, 0032372), in which 3 entities ApoC2, EGF and SREBF2 were up-regulated. BIIE0246 down-regulated the genes significantly involved in 44 GO terms related to biological processes, 15 GO terms to cellular components and 1 GO term to molecular function.
Pathway analysis
Single experiment analysis (SEA) identified 44 pathways related to BIIE0246-regulated genes (>1.5-fold) (P<0.01) (Table 1). Three pathways of them were related to lipid metabolism. Sterol responsive element binding protein (SREBP) signaling pathway was related to 65 genes (WP 1982_7894), in which 4 genes, SAR1B, PI3K, PPARG and LSS, were down-regulated by BIIE0246 (P=0.0022) (Figure 4.). Vitamin B12 metabolic pathway (including lipoprotein metabolism) was related to 53 genes (WikiPathways online database; WP1533_70117), in which 4 genes, Megalin, NFkB2, PLG and INSR, were up-regulated by BIIE0246 (P=0.0048)(Figure 5.)Cholesterol biosynthetic pathway was related to 12 genes, (WP1795_72909), in which 2 genes, LSS and TM7SF2, were down-regulated by BIIE0-246 (P=0.0049).
Table 1. Pathways related to BIIE-regulated (> 1.5-fold) genes in HepG2 cells
Pathways related to up-regulated genes |
p-value |
Matched |
Pathway |
|
Entities |
Entities |
|
| |
|
|
|
|
|
Hs_Focal_Adhesion_WP306_71714 |
7.87E-06 |
12 |
188 |
|
Hs_EGF-EGFR_Signaling_Pathway_WP437_72106 |
3.37E-04 |
9 |
162 |
|
Hs_Interleukin-1_signaling_WP1839_44873 |
7.72E-04 |
3 |
15 |
|
Hs_Integrated_Cancer_pathway_WP1971_71249 |
0.001319208 |
4 |
36 |
|
Hs_G_Protein_Signaling_Pathways_WP35_71252 |
0.001492556 |
6 |
92 |
|
Hs_Insulin_Signaling_WP481_72080 |
0.001521681 |
8 |
161 |
|
Hs_B_Cell_Receptor_Signaling_Pathway_WP23_72101 |
0.001577781 |
6 |
94 |
|
Hs_AGE-RAGE_pathway_WP2324_71701 |
0.001906049 |
5 |
66 |
|
Hs_Signaling_by_EGFR_WP1910_45218 |
0.001954745 |
3 |
21 |
|
Hs_Glycerophospholipid_Biosynthetic_Pathway_WP2533_71989 |
0.00263036 |
3 |
34 |
|
Hs_Prostate_Cancer_WP2263_73838 |
0.003835746 |
6 |
115 |
|
Hs_Vitamin_B12_Metabolism_WP1533_70117 |
0.004782356 |
4 |
53 |
|
Hs_MicroRNAs_in_cardiomyocyte_hypertrophy_WP1544_73325 |
0.005416465 |
5 |
105 |
|
Hs_Integrated_Pancreatic_Cancer_Pathway_WP2377_71228 |
0.005547157 |
8 |
200 |
|
Hs_ErbB_Signaling_Pathway_WP673_69914 |
0.005865572 |
4 |
54 |
|
Pathways related to down-regulated genes |
|
|
|
|
Hs_Wnt_Signaling_Pathway_Netpath_WP363_70630 |
8.87E-05 |
5 |
51 |
|
Hs_Processing_of_Capped_Intron-Containing_Pre-mRNA_WP1889_42105 |
9.74E-05 |
5 |
52 |
|
Hs_Insulin_Signaling_WP481_72080 |
1.01E-04 |
8 |
161 |
|
Hs_Histone_Modifications_WP2369_69927 |
2.62E-04 |
5 |
67 |
|
Hs_BDNF_signaling_pathway_WP2380_71549 |
2.63E-04 |
7 |
141 |
|
Hs_Cell_Cycle_WP179_70629 |
3.20E-04 |
6 |
103 |
|
Hs_RIG-I-MDA5_mediated_induction_of_IFN-alpha-
beta_pathways_WP1904_45045 |
8.10E-04 |
3 |
21 |
|
| |
| |
Hs_mRNA_Processing_WP411_71369 |
8.93E-04 |
6 |
127 |
|
Hs_IL-4_Signaling_Pathway_WP395_70016 |
0.00116604 |
4 |
55 |
|
Hs_B_Cell_Receptor_Signaling_Pathway_WP23_72101 |
0.00144947 |
5 |
94 |
|
Hs_Gastric_cancer_network_1_WP2361_71382 |
0.00190663 |
3 |
28 |
|
Hs_SREBP_signalling_WP1982_71987 |
0.0022419 |
4 |
65 |
|
Hs_Asparagine_N-linked_glycosylation_WP1785_44964 |
0.00281227 |
3 |
32 |
|
Hs_p38_MAPK_Signaling_Pathway_WP400_72084 |
0.0033489 |
3 |
34 |
|
Hs_Parkin-Ubiquitin_Proteasomal_System_pathway_WP2359_72121 |
0.00366955 |
4 |
73 |
|
Hs_Prolactin_Signaling_Pathway_WP2037_67606 |
0.00468128 |
4 |
76 |
|
Hs_Cholesterol_biosynthesis_WP1795_72909 |
0.00485147 |
2 |
12 |
|
Hs_IL-5_Signaling_Pathway_WP127_70017 |
0.00531745 |
3 |
40 |
|
Hs_Regulation_of_Microtubule_Cytoskeleton_WP2038_70100 |
0.00651376 |
3 |
44 |
|
Hs_Irinotecan_Pathway_WP229_68389 |
0.00661149 |
2 |
14 |
|
Hs_RB_in_Cancer_WP2446_72248 |
0.00753037 |
4 |
87 |
|
Hs_Energy_Metabolism_WP1541_68947 |
0.00833931 |
3 |
47 |
|
Discussion
As reported in our previous report [5], the luciferase activity was detected in HepG2 cells when used pGL3-Basic vector inserted with 5’-flanking region of Y2R gene containing rs6857530GG plus rs6857715TT but not rs6857530AA plus rs6857715CC. We therefore directly sequenced the 5’-flanking region of Y2R gene in HepG2 cells. The sequence resulted in heterozygous rs6857530 (G/A) and rs6857715 (T/C). HepG2 cells were thus considered to express Y2R gene, although the amount of Y2R mRNA is expected to be higher in the other hepatic cells with homologous rs6857530 (G/G) and rs6857715 (T/T).
Hepatic representative HDL regulators are Apo-lipoprotein A1 (ApoA1), ApoA1 binding protein, CETP, SR-B1, and hepatic lipase [13-15]. We examined whether the mRNA expression of these regulators are influenced by Y2R antagonist. BIIE0246 failed to change these mRNA expression levels evaluated by real-time RT-PCR, despite the tendency of the decrease by BIIE0246 in CETP, SR-B1, and hepatic lipase mRNA expression.
Next, we analyzed the effect of BIIE0246 on comprehensive gene expression by using microarray. BIIE0246 also failed to change mRNA levels of representative HDL regulators, consistent with the results by real-time RT-PCR. On the other hand, BIIE0246-upregulated genes were included in 3 GO terms related to biological processes; chylomicron remodeling, negative regulation of cholesterol or sterol transport. These results suggest that BIIE0246 regulates gene expression related to lipid metabolism. However, GO tree view of chylomicron remodeling revealed positive and negative regulation of chylomicron remodeling (AmiGO2). GO tree view of negative regulation of cholesterol transport included cholesterol efflux, import, transporter activity, intestinal absorption, intracellular transport, and reverse transport (AmiGO2). GO tree view of negative regulation of sterol transport included cholesterol transport, intestinal phytosterol absorption, intracellular sterol transport and sterol import (AmiGO2). It is therefore likely that Y2R is involved in chylomicron remodeling and cholesterol/sterol transport, but it is still unclear how blockade of Y2R influences plasma HDL-cholesterol levels.
SEA was thus performed to identify pathways related to regulated genes. In pathway database, a flowchart or module of various genes is designed and integrated to achieve a specific biological function. It is of interest that BIIE0246-downregulated 4 genes were significantly related to SREBP signaling pathway. As shown in Figure 4, SREBP is a protein located on membranes of endoplasmic reticulum [16-18]. SREBP remains as a complex by connecting with SREBP cleavage-activating protein (SCAP) [19] and insulin inducing gene (INSIG) (20) during high intracellular cholesterol levels, and removes INSIG during low cholesterol levels. SREBP-SCAP dimer subsequently connect with Sec24 [21] and translocate to Golgi apparatus. While SREBP transfers from Golgi apparatus to nucleus, it is cleaved to N-terminal SREBP (nSREBP) by site 1 protease (S1P) [22] and subsequently by site 2 protease (S2P) [23]. nSREBP is a transcription factor that binds to the sterol responsive element (SRE) of lipogenic enzyme genes, SREBP, and INSIG. SREBP thus plays a pivotal role in control of cholesterol sysnthesis. SREBP signaling pathway included 65 genes consisting of key molecules stated above. Down-regulated 4 genes of this pathway were SAR1B, PI3K, PPARG, and LLS (Figure 4). SAR1B, secretion associated, Ras related GTPase 1B, is an enzyme that transport from the endoplasmic reticulum to the Golgi apparatus. PI3K, phosphoinositide-3-kinase, is a kinase that phosphorylates phosphatidylinositol 4, 5-bisphosphate to generate phosphatidylinositol 3, 4, 5-triphosphate. PPARG, peroxisome proliferator-activated receptor γ, is a nuclear receptor and transcription factor that targets genes like acyl-CoA oxidase to control β oxidation of fatty acids. LSS, lanosterol synthase, is an enzyme that catalyzes the cyclization of (S)-2, 3 oxidosqualene to lanosterol, a reaction that forms the sterol nucleus. Down-regulation of gene expression related to SREBP signaling by Y2R antagonist is consistent with the idea that NPY through hepatic Y2R stimulates SREBP signaling pathway, thereby causing increased cholesterol synthesis.
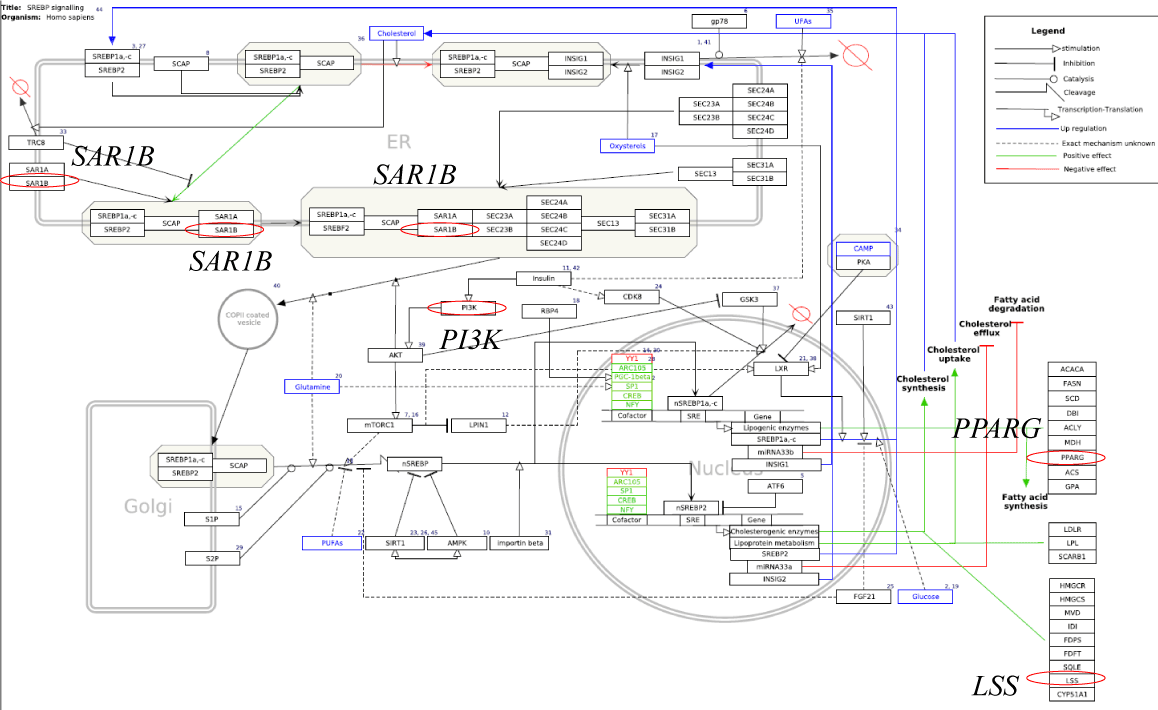
Figure 4. SREBP signaling pathway (by WikiPathways data base; WP1982). BIIE0246 down-regulated SAR1B, PI3K, PPARG, and LSS involved in this pathway (red circle).
2021 Copyright OAT. All rights reserv
Vitamin B12 metabolic pathway contained not only vitamin B12/cobalamin metabolism but protein tyrosine nitration, lipoprotein metabolism, DNA oxidation and lipid peroxidation. This pathway included 53 genes, in which BIIE0246 upregulated 4 genes, Megalin, NFkB2, PLG and INSR as shown in partial view of this pathway (Figure 5). Megalin acts together with cubilin to mediate HDL endocytosis by intracellular trafficking of cubilin [24]. Cubilin is a receptor not only for cobalamin but also for ApoA1, most abundant Apo-lipoprotein of HDL. Cubilin is positioned closely to megalin in this pathway. NFkB2 is a nuclear transcription factor targeting a variety of genes, including Apo CIII, one of Apo-lipoprotein of HDL. ApoCIII was not included in this pathway. PLG is plasminogen and closely linked to tissue plasminogen activator (tPA) and plasminogen activator inhibitor-1 (PAI-1) in this pathway. In the previous report, PAI-1 is negatively correlated with plasma HDL-cholesterol levels [25]. Thus plasminogen up-regulation may lead to higher plasma levels of HDL-cholesterol. INSR is insulin receptor and linked to TNFα in this pathway. TNFα is known to cause insulin resistance. Conversely, insulin receptor gene up-regulation may cause inhibition of TNFα gene expression. Anti-TNF treatment was reported to raise plasma HDL-cholesterol levels in patients with rheumatoid arthritis [26]. Although expression levels of ApoAI, a gene in this pathway, were not regulated by BIIE0246, these evidences suggest that Y2R is involved in HDL metabolism. Up-regulation of gene expression related to vitamin B12/lipoprotein metabolism by Y2R antagonist is consistent with the idea that NPY through hepatic Y2R inhibits HDL production from the liver, thereby causing decrease in plasma HDL-cholesterol levels.
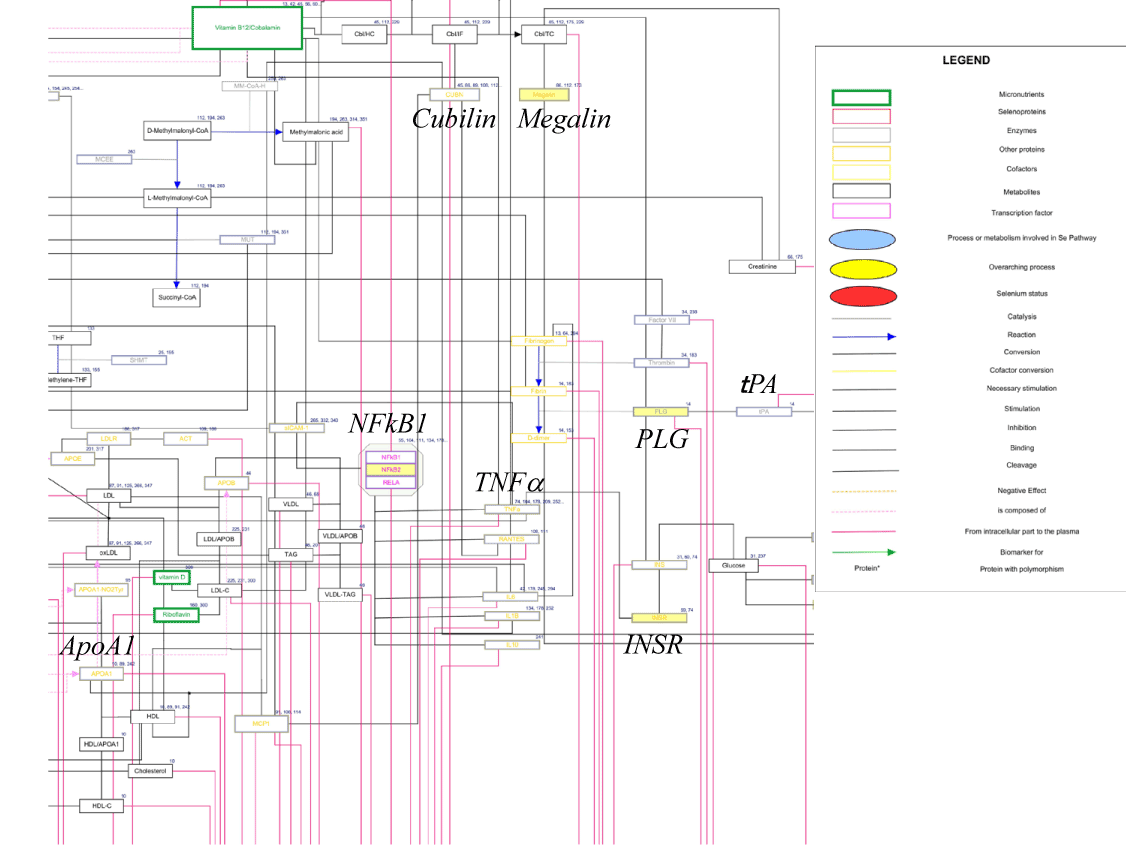
Figure 5. Vitamin B12 metabolic pathway (by WikiPathways data base; WP1533). BIIE0246 up-regulated Megalin, NFkB1, PLG and INSR involved in this pathway (yellow box).
These bioinformatics data are useful to understand the mechanism underlying the association between Y2R SNPs and plasma HDL-cholesterol levels. If Y2R blockade inhibits hepatic cholesterol synthesis or raises plasma HDL-cholesterol levels, potent and selective Y2R antagonist may be a prospective drug candidate for dyslipidemia in subjects with specific Y2R SNPs.
References
- Tatemoto K, Carlquist M, Mutt V (1982) Neuropeptide Y a novel brain peptide with structural similarities to peptide YY and pancreatic polypeptide. Nature 296: 659-660. [Crossref]
- Kaji H (2013) Neuropeptide Y and its receptors: molecular structure and pathophysiological role in food intake and energy homeostasis. In Neuropeptide Y ed. by Parker SL. Nova Science Publisher, 39-82.
- Kuo LE, Kitlinska JB, Tilan JU, Li L, Baker SB, et al. (2007) Neuropeptide Y acts directly in the periphery on fat tissue and mediates stress-induced obesity and metabolic syndrome. Nat Med 13: 803-811. [Crossref]
- Takiguchi E, Fukano C, Kimura Y, Tanaka M, Tanida K, et al. (2010) Variation in the 5'-flanking region of the neuropeptide Y2 receptor gene and metabolic parameters. Metabolism 59: 1591-1596. [Crossref]
- Schwartz GG, Olsson AG, Abt M, Ballantyne CM, Barter PJ, et al. (2012) Effects of dalcetrapib in patients with a recent acute coronary syndrome. N Engl J Med 367: 2089-2099. [Crossref]
- Draganov DI, La Du BN (2004) Pharmacogenetics of paraoxonases: a brief review. Naunyn Schmiedebergs Arch Pharmacol 369: 78-88. [Crossref]
- Lusis AJ (2000) Atherosclerosis. Nature 407: 233-241. [Crossref]
- Shih DM, Gu L, Xia YR, Navab M, Li WF, et al. (1998) Mice lacking serum paraoxonase are susceptible to organophosphate toxicity and atherosclerosis. Nature 394: 284-287. [Crossref]
- Navab M, Ananthramaiah GM, Reddy ST, Van Lenten BJ, Ansell BJ, et al. (2004) The oxidation hypothesis of atherogenesis: the role of oxidized phospholipids and HDL. J Lipid Res 45: 993-1007. [Crossref]
- Kaji H (2013) High-density lipoproteins and the immune system. J Lipids 2013: 684903. [Crossref]
- Okada M, Nagai M, Hamaue A, Mori M, Kaji H. (2015) Single nucleotide polymorphism- and cell type-dependent gene expression of neuropeptide Y2 receptor. Int Mol Med 2: 251-255.
- Doods H, Gaida W, Wieland HA, Dollinger H, Schnorrenberg G, et al. (1999) BIIE0246: a selective and high affinity neuropeptide Y Y(2) receptor antagonist. Eur J Pharmacol 384: R3-5. [Crossref]
- Kathiresan S, Melander O, Guiducci C, Surti A, Burtt NP, et al. (2008) Six new loci associated with blood low-density lipoprotein cholesterol, high-density lipoprotein cholesterol or triglycerides in humans. Nat Genet 40: 189-197. [Crossref]
- Wolfs MGM, Rensen SS, Bruin-Van Dijk EJ, Verdam FJ, Greve JW, et al. (2010) Co-expressed immune and metabolic genes in visceral and subcutaneous adipose tissue from severely obese individuals are associated with plasma HDL and glucose levels: a microarray study. BMC Med Genom 3:1-15. 10
- Willer CJ, Sanna S, Jackson AU, Scuteri A, Bonnycastle LL, et al. (2008) Newly identified loci that influence lipid concentrations and risk of coronary artery disease. Nat Genet 40: 161-169. [Crossref]
- Yokoyama C, Wang X, Briggs MR, Admon A, Wu J, et al. (1993) SREBP-1, a basic-helix-loop-helix-leucine zipper protein that controls transcription of the low density lipoprotein receptor gene. Cell 75:187-197.
- Sato R, Yang J, Wang X, Evans MJ, Ho YK, et al. (1994) Assignment of the membrane attachment, DNA binding, and transcriptional activation domains of sterol regulatory element-binding protein-1 (SREBP-1). J Biol Chem 269: 17267-17273. [Crossref]
- Hua X, Yokoyama C, Wu J, Briggs MR, Brown MS. Et al. (1993) SREBP-2. A second basic-helix-loop-helix-leucine zipper protein that stimulates transcription by binding to a sterol regulatory element. Proc Natl Acad Sci USA 90:11603-11607. [Crossref]
- Hua X, Nohturfft A, Goldstein JL, Brown MS (1996) Sterol resistance in CHO cells traced to point mutation in SREBP cleavage-activating protein. Cell 87: 415-426. [Crossref]
- Goldstein JL, DeBose-Boyd RA, Brown MS (2006) Protein sensors for membrane sterols. Cell 124: 35-46. [Crossref]
- Sun LP, Li L, Goldstein JL, Brown MS (2005) Insig required for sterol-mediated inhibition of Scap/SREBP binding to COPII proteins in vitro. J Biol Chem 280: 26483-26490. [Crossref]
- Sakai J, Rawson RB, Espenshade PJ, Cheng D, Seegmiller AC, et al. (1998) Molecular identification of the sterol-regulated luminal protease that cleaves SREBPs and control lipid composition of animal cells. Mol Cell 2:505-514. [Crossref]
- Rawson RB, Zelenski NG, Nijhawan D, Ye J, Sakai J, et al. (1997) Complementation cloning of S2P, a gene encoding a putative metalloprotease required for intramembrane cleavage of SREBPs. Mol Cell 1: 47-57. [Crossref]
- Hammad SH, Barth JL, Knaak C, Argraves WS. (2000) Megalin acts in concert with cubilin to mediate endocytosis of high density lipoproteins. J Biol Chem 275:12003-12008. [Crossref]
- Ihnken K, Speiser W, Ruf W, Thiel W, Schlepper M, et al. (1993) High PAI activity with correlation to triglyceride and HDL cholesterol values in patients with coronary artery disease with no difference in survivors of myocardial infarction. Ann Hematol 67: 237-244. [Crossref]
- Popa C, Netea MG, Radstake T, Van der Meer JW, Stalenhoef AF, et al. (2005) Influence of anti-tumour necrosis factor therapy on cardiovascular risk factors in patients with active rheumatoid arthritis. Ann Rheum Dis 64: 303-305. [Crossref]


