Abstract
Several recent studies suggest that diabetes mellitus is an underlying disease for secondary osteoporosis. Furthermore, the risk of fracture is increased in diabetic patients irrespective of their diabetic clinical type. The objective of this is study was to evaluate the bone mineral mass of children with Type 1 Diabetes Mellitus and compare them according to time of diagnosis, to observe the impact on bone mass gain.
We designed a prospective longitudinal study with 33 patients between 04 and 20 years of age with at least one year of diagnosis of type 1 diabetes mellitus (DM1). It was performed at Hospital Materno Infantil de Brasília from April to August of 2009. The bone mineral densitometry was measured on all patients by DXA. They were separated into two groups by the time of diagnosis. One group with less than four years of diagnosis of DM1 (<4) and the other group with more than four years of disease (+4). There was a statistical difference between groups: When Z -score was compared, the <4 group had a mean z -score of -0,39, and the 4+ group had a mean z -score of 0,17(p=0,099). The <4 group had a mean Bone Mineral Content of 1062,27grams, while the 4+ group had 1498,55 grams. (p=0,008). The diabetes metabolic control was worst in patients group with more recent diagnosis, with mean A1c of 9,11 mg/dL, and the group with the longer time of diagnosis presented a mean A1c of 8,51 mg/dL. This difference was not statistically significant (p=0,329)
Conclusions
Patients with a better metabolic control presented a better bone mineral content than those with worst metabolic control. According to the literature, the poor metabolic control may be the cause of poor bone mass acquisition. Both groups didn’t have low bone mass, but it was observed a higher bone mass content on the group with better metabolic control.
Introduction
Diabetes is a disease with a prevalence of 171 million people around the world in 2000, with a projection to rise to 366 million in 2030 [1]. Type 1 diabetes is increasing rapidly with an incidence, in 2009, 6666 of 3.4 million young people and a prevalence of 1.93 per 1000 in the United States [2]. It is characterized by destruction of beta cells and deregulation of alpha cells with micro and macrovascular complications. The pancreatic lesion is a very simplistic definition because this metabolic derangement can lead to repercussion in every single system, and most recently observed in the skeletal system.
Several recent studies suggest that diabetes mellitus is an underlying disease for secondary osteoporosis. Furthermore, the risk of fracture is increased in diabetic patients irrespective of their diabetic clinical type [3].
Forsén et al. showed a prospective study with people of 50 years of age and older, attending a Health screening in Norwegian county. They were followed for nine years, and the authors investigated the incidence of hip fractures in this population. The study demonstrated that women with DM1 have a greater relative risk of hip fractures than the control group [4].
Nicodemus K et al. in 2001 performed a prospective study in postmenopausal women between 55 to 69 years of age. All fractures were registered by year, for 11 years. It was observed that women with DM1 were 12.25 times more likely to report an incident hip fracture than women without diabetes [5].
A more recent meta-analysis published in 2007 showed that BMD Z-scores of hip and spine in DM1 patients was lower than those nondiabetic participants [6].
There are many theories to support the decreased bone quality in diabetic patients: 1) Poor control of diabetes, keeping an hyperglycemic state leading to an excessive glycation of type 1 collagen changing the material properties of bone collagen [7,8]; 2) Suppressed bone turnover [9] ; 3) Autoimmune inflammation [7]; 4) Hypoinsulinemia that leads to a suppression of osteoblast markers and a systemic or local Insulin Growth Factor-1 (IGF-1) deficiency [3,7,10]; 5) Action of other pancreatic hormones that plays a role in bone turnover [11].; 6) Low bone mass acquisition [12].
Studies showed that long-standing poor glycemic control was positively correlated with the presence of micro and macrovascular diabetic complications, and it might predict low BMD in patients with DM1. These include retinopathy, peripheral neuropathy, and nephropathy. Also, these complications may lead to a higher morbidity and limit physical activity, muscular and skeletal interactions and diminished visual acuity, enhancing the propensity of falls, as another risk factor for those patients [7,8].
Valério G, et al, analyzed 27 adolescents with DM1 for at least six years of diagnosing. They found that the poor metabolic control might expose those patients to a higher risk of developing osteopenia in adult life [13].
There are other pathways to impair the bone turnover with poor metabolic control. Type I collagen is the main constituent protein of bone matrix. Its main function is to absorb tension and bone deformation. Previous findings have shown that advanced glycation end products (AGEs) may not support bone resorption properly and reduces bone resorption. Patients with osteoporosis have AGEs accumulated in all their tissues, and consequently, those glycated products may decrease the mechanical properties of cortical and trabecular bones, increasing the risk of fractures [9].
The collagen products as well as the factors for mineralization, which are secreted from mature osteoblasts, and the collagen degradation products derived from bone tissue resorption by osteoclasts are indices of bone turnover. It was observed that bone formation, as well as reabsorption markers, are significantly lower in diabetic patients [3].
Hypoinsulinemia leads to a suppression of osteoblast markers and generates a systemic and local IGF-1 deficiency. IGF-1 is an important factor in the bone matrix for promoting proliferation and differentiation of osteoblasts [3,7,10]. It was observed a low serum IGF-1 in female type 2 diabetes. This finding is related to an increased risk of vertebral fractures independent of Bone mineral density. Also, IGF-1 serum levels were positively correlated with indices of bone formation, as procollagen type I, propeptides, alkaline phosphatase and osteocalcin, in subjects with DM1, but not in healthy controls. A study conducted in more than 100 children and young adults with DM1 showed that IGF-1 serum levels and biochemical markers of bone formation such as osteocalcin were lower in patients with DM1 compared with healthy subjects [7].
There is a hypothesis that the autoimmune process itself, characterized by the presence of activated T cells and associated with osteoclastogenic cytokine microenvironment, including increased RANKL, is involved in impaired bone metabolism in patients with DM1, even before clinical symptoms of the disease [7].
Pancreatic and enteric hormones have an important role in bone turnover regulation. Glucagon-like polypeptide 2 (GLP-2) receptors are located on osteoclasts, and it was demonstrated that administration of physiological doses of GLP-2 reduced bone resorption. Gastric Inhibitory Peptide (GIP) receptors are located on osteoblasts. Activation of GIP receptors was shown to enhance expression of alkaline phosphatase and the secretion of type I collagen. Therefore, both hormones seem to have osteotropic effects [11].
Almost 90% of bone mass is gained in the first 20 years of life. An important way of preventing osteoporosis and fractures later in life is to optimize peak bone mass and bone strength. Also, most of the DM1 patients have their onset of the disease before achieving their peak of bone mass. Consequently, the diabetic patient has a higher risk of low bone mass in youth, osteopenia and osteoporosis precociously in their lives [12].
Furthermore, because osteoporosis is a multifactorial skeletal disease, the link between BMD and the risk factors may be hardly understandable. The major point is to demonstrate when the bone metabolism starts to work deficiently on those patients [8].
Materials and Methods
The study is a prospective longitudinal study with 33 patients between 04 and 20 years of age with at least one year of diagnosis of DM1. They were chosen randomly in the Diabetes regular clinical appointments at Hospital Materno Infantil de Brasília between April of 2009 and August of the same year. The study was performed after approval by the ethical committee of the FEPECS, Brasilia. A written informed consent was obtained from all patients and their parents after the full discussion about the aim of the study.
The inclusion criteria were: patients with at least four years of age and with maximum 20 years of age, with at least one year of diagnosing of type 1 diabetes.
The exclusion criteria of the study were: Type 2 diabetes, any cancer, thyroid disorders, growth hormone deficiency, genetic syndromes, vitamin D deficiency, hypogonadism, chronic use of glucocorticoids, rheumatologic diseases, hepatic, renal and cardiologic diseases unrelated to diabetes, transplant patients, pregnant patients or patients with BMI greater than 95 percentiles.
They were submitted to complete physical exam: weight (kg), Height (m), BMI (kg/m2), arterial blood pressure (mmHg), pubertal evaluation (Tanner method), evaluation of neuropathies (sensibility tests) and research of lipodystrophies.
A questionnaire was made about the disease: time of diagnosis, insulin types and dosing, previous hospitalizations. And other questions involved assessment of bone mineral metabolism: calcium intake (considered suitable as more than 2 portions a day); sun exposure evaluated as minutes per day (considered as 30 minutes/day as suitable); physical activity according to hours per week (h/w) of exercise (as less than 3 h/w and 3h/w or more);
The bone mineral densitometry was performed on all patients by dual energy x-ray absorptiometry, DXA, pediatric software, GE-Lunar, Prodigy. They were evaluated by z-score, bone mineral content, body composition, according to gender, age, ethnic group, weight and height and body surface.
They were also submitted to biochemical tests: hemoglobin glycated (A1c), serum and 24-hour urinary calcium, phosphorus, magnesium, sodium, potassium, chlorine, 24 h microalbuminuria.
The patient’s medical history was assessed to evaluate the retrospective metabolic control of the subjects.
All statistical analyses were performed by comparison of means of two independent samples and by Pearson correlation coefficient. The software used was SPSS version 17.
Results
Patients were separated into two groups, by the time of diagnosis. One group with less than four years of diagnosis of DM1 (<4) and the other group with more than four years of disease. The purpose of this division was to evaluate the time effects of diabetes on bone mineral density.
The mean age of the diabetic patients were 9,8 years, with a predominance of 60% for the female sex. The mean age of the female percentage was 9,05 years and the mean age in the male patients was 11,15 years. The majority of them was on puberty (57.6%), and these patients had a mean time of disease of 3,5 years. There was no statistical difference in age between the groups, with a mean age of 8,61 years in the group of <4 years (<4) of diagnosis and the mean age of 11,4 years in the group of 4 years or more (4+).
The metabolic control was observed in both groups with the evaluation of the A1c. This test was made routinely on those patients. The diabetes control was worst in patients with more recent diagnosis, with mean A1c of 9,11 mg/dL, when compared with the group with the longer time of diagnosis, mean A1c of 8,51 mg/dL. This difference was not statistically significant (p=0,329).
Observing z -score of Bone Mineral Density, the <4 group had a mean z -score of -0,39, and the 4+ group had a mean z -score of 0,17(p=0,099). Evaluating the BMD separately in the lumbar spine, there was also a statistical difference. The group with the recent diagnosis had a mean BMD (lumbar) of 0,72g/cm2, while the group with more time of diagnosis had 0,850g/cm2. The same statistical difference was found on Total body BMD (p=0,005). (Table 1)
Table 1. Statistical analysis is comparing the mean of A1C, Z-score, Bone Mineral Content, Serum Calcium and other variables in both groups.
Variables |
Time of diagnosis |
No of patients |
Mean |
Standard-Deviation |
p-value |
A1C
|
< 4 years |
17 |
9,11 |
2,06 |
0,329
|
Four years + |
15 |
8,51 |
1,17 |
Microalbuminuria
|
< 4 years |
15 |
11,77 |
9,46 |
0,064 |
Four years + |
13 |
19,68 |
12,16 |
BMD z -score
|
< 4 years |
18 |
-0,39 |
0,88 |
0,099
|
Four years + |
15 |
0,17 |
1,02 |
Serum Calcium
|
< 4 years |
15 |
10,41 |
0,57 |
0,291
|
Four years + |
11 |
10,16 |
0,60 |
Bone Mineral Content |
< 4 years |
18 |
1062,27 |
428,44 |
0,008*
|
Four years + |
15 |
1498,55 |
459,25 |
BMD total
|
< 4 years |
18 |
0,86 |
0,10 |
0,005*
|
Four years + |
15 |
0,97 |
0,10 |
BMD column
|
< 4years |
18 |
0,72 |
0,10 |
0,003*
|
Four years + |
15 |
0,85 |
0,13 |
This difference was also found when the Bone Mineral Content of those groups were compared. The <4 group had a mean Bone Mineral Content of 1062,27grams, while the 4+ group had 1498,55 grams. (p=0,008). The study showed that the group with longer diabetes diagnosis had a better bone mass gain than the group with a recent diagnosis. Using the Graphical dispersion for bone mineral content versus time of diagnosis divided by gender, there was a significant difference between the female groups compared with the time of diagnosis (Figure 1). The girls with the recent diagnosis had a lower bone mineral content than girls with more time of diagnosis. (p=0,004).
2021 Copyright OAT. All rights reserv
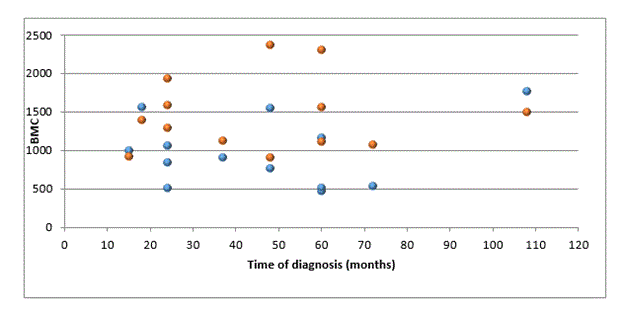
Figure 1: Graphical dispersion for bone mineral content versus time of diagnosis divided by gender.
With Pearson correlation, we evaluate the calcium intake and z -score of BMD. It was observed that a good calcium intake had a correlation with a better bone mineral density. (p=0,018). (Figure 2)
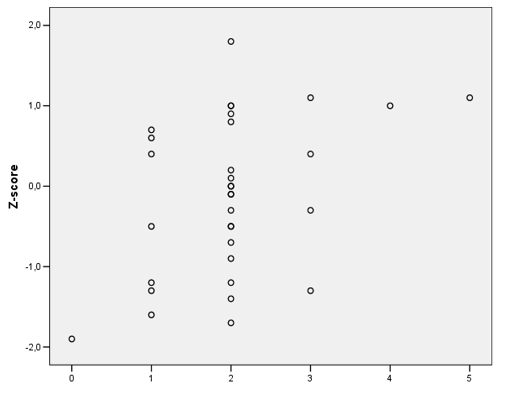
Figure 2: Pearson correlation between Calcium Intake and z -score of BMD. Brasilia, 2009.
Calcium Intake ( portions/day)
There was no statistical difference between the groups in other analyzes as the difference in height per age percentile, time of sun exposure, physical activity, BMD z -score, fat mass percentage, and microalbuminuria.
Conclusion
Studies observed that DM1 patients had abnormalities on bone mineral composition. This present study didn't observe low bone mineral mass on any of those patients. A possibility of disagreement might be because studies suggest that these bone alterations may happen when microvascular and macrovascular complications start. Those 33 children and adolescents did not present any diabetes complications until bone mineral density assessment. [4-6,10]
We observed difference between groups on bone mineral content. And also there was a difference between the A1c findings, although not statistically significant. Patients with a better metabolic control, with mean A1c of 8,51 mg/dL, presented a better Bone mineral content, than those with worst metabolic control - 9,11mg/dL. According to the literature, this poor metabolic control may be the answer to all bone complications. The study didn’t observe low bone mass on all patients, but it was observed a better quantity of bone mass on the group with better metabolic control [3,7,8].
The present study observed a positive relation between calcium intake and a better z-score of BMD. Other authors support these findings [12].
The literature shows that adult diabetic population has more risk of osteopenia, osteoporosis, and fractures along their lives [7]. It is important to understand what are the metabolic factors that implicate on a poor bone mineral metabolism and when osteoblastic and osteoclastic activity starts to be impaired.
The previous study of our group showed that in Diabetes Mellitus type 2 (DM2) the disease has a different relationship with bone mass [14].
Other studies are necessary to understand when those kids start to have a worse health bone and what are the factors that help to impair the bone metabolism. It is described for so many other complications a target to metabolic control, for example, for microvascular complications. Studies should be performed to elucidate a metabolic target to bone mineral density, to improve our incidence of fractures and osteoporosis in this adult population.
References
- Wild S, Roglic G, Green A, Sicree R, King H (2004) Global prevalence of diabetes: estimates for the year 2000 and projections for 2030. Diabetes Care 27: 1047-1053. [crossref]
- Dabelea D, Mayer-Davis EJ, Saydah S, Imperatore G, Linder B, et al. (2014) Prevalence of type 1 and type 2 diabetes among children and adolescents from 2001 to 2009. JAMA 311: 1778-1786. [crossref]
- Yamamoto M (2015) Insights into bone fragility in diabetes: the crucial role of bone quality on skeletal strength. Endocr J 62: 299-308. [crossref]
- Forsén L, Meyer HE, Midthjell K, Edna TH (1999) Diabetes mellitus and the incidence of hip fracture: results from the Nord-Trøndelag Health Survey. Diabetologia 42: 920-925. [crossref]
- Nicodemus KK, Folsom AR; Iowa Women's Health Study (2001) Type 1 and type 2 diabetes and incident hip fractures in postmenopausal women. Diabetes Care 24: 1192-1197. [crossref]
- Vestergaard P1 (2007) Discrepancies in bone mineral density and fracture risk in patients with type 1 and type 2 diabetes--a meta-analysis. Osteoporos Int 18: 427-444. [crossref]
- Hofbauer LC1, Brueck CC, Singh SK, Dobnig H (2007) Osteoporosis in patients with diabetes mellitus. J Bone Miner Res 22: 1317-1328. [crossref]
- Eller-Vainicher C, Zhukouskaya V V., Tolkachev Y V, Koritko SS, Cairoli E, et al. (2011) Low bone mineral density and its predictors in type 1 diabetic patients evaluated by the classic statistics and artificial neural network analysis. Diabetes Care 34: 2186-2191.
- Wang L, Teng X, Quan C, Cai S, Hu S (2016) Effect of advanced glycation end products, extracellular matrix metalloproteinase inducer and matrix metalloproteinases on type-I collagen metabolism. Biomed Reports 691-693.
- Mastrandrea LD, Wactawski-Wende J, Donahue RP, Hovey KM, Clark A, et al. (2008) Young women with type 1 diabetes have lower bone mineral density that persists over time. Diabetes Care 31: 1729-1735. [crossref]
- Clowes JA, Khosla S, Eastell R (2005) Potential role of pancreatic and enteric hormones in regulating bone turnover. J Bone Miner Res 20: 1497-1506. [crossref]
- Borges JL, Brandão CM (2006) Low bone mass in children and adolescents. Arq Bras Endocrinol Metabol 50: 775-782. [crossref]
- Valerio G1, del Puente A, Esposito-del Puente A, Buono P, Mozzillo E, et al. (2002) The lumbar bone mineral density is affected by long-term poor metabolic control in adolescents with type 1 diabetes mellitus. Horm Res 58: 266-272. [crossref]
- Borges JLC, Bilezikian JP, Jones-Leone AR, Acusta AP, Ambery PD, et al. (2011) A randomized, parallel group, double-blind, multicentre study comparing the efficacy and safety of Avandamet (rosiglitazone/metformin) and metformin on long-term glycaemic control and bone mineral density after 80 weeks of treatment in drug-naïve type 2 d. Diabetes, Obes Metab 13: 1036-1046.