Background: Direct laryngoscopy and intubation leads to elevated hemodynamic responses which should be attenuated by either by medication or by modifying technique by using alternative endotracheal tube guiding devices. Intubating Laryngeal Mask Airway (ILMA) can lessen the hemodynamic response of endotracheal intubation. The present study was designed to compare the hemodynamic responses during intubation by direct laryngoscopy and during ILMA.
Material methods: After Ethical Committee approval, eighty adult consented patients of ASA grade I/II aged 18-60 years of either sex, undergoing elective surgeries under general anaesthesia were randomized into two groups using sealed envelopes. Patients of Group I- were intubated by using ILMA and patients of Group M were intubated by using Macintosh laryngoscope. The general anaesthesia technique was standardized. Heart rate, systolic and diastolic blood pressure and any another complications were noted at various time intervals for statistical analysis, using one way ANOVA and chi square test. P value of <0.05 was considered statistically significant.
Results: Demographic profile was comparable. The mean time taken with the ILMA was 85.25 ± 13.19 seconds and was only 17.25 ± 9.74 seconds using the Macintosh laryngoscope with p=0.001. The baseline heart rate was comparable but post intubation till 5 minutes, it was statistically significant. Systolic blood pressure between Group I and Group M were also compared and the p-values were statistically highly significant after intubation at immediate post intubation. There was significant difference in rise in diastolic blood pressure between groups. No statistically significant difference between the two groups with regards to complications was observed.
Conclusion: ILMA is a safer alternative to Macintosh laryngoscope as ILMA attenuated the hemodynamic stress responses to tracheal intubation and may be preferred in hypertensive patients.
intubating laryngeal mask airway, macintosh laryngoscope, hemodynamic pressure response, propofol
Endotracheal intubation is usually carried out under direct vision by direct laryngoscopy, which in healthy patient may not lead to serious complications. The potential hazards of this technique are reflex increase in sympathetic activity that produces reflex cardiovascular responses mainly in the form of hypertension, tachycardia and dysarrhythmias.
Factors like degree and distortion or physical stimulus to oropharyngeal structures decide the extent of hemodynamic response to conventional laryngoscopy and endotracheal intubation and use of various other airway devices like laryngeal mask airway [1]. The pressor response to laryngoscopy and intubation can be reduced by either pharmacological methods or using alternative endotracheal tube guiding devices such as fibreoptic scope [2], light wand [3] or Laryngeal Mask Airway (LMA) [4].
Intubating laryngeal mask airway, is used to ventilate patients, as well as act as conduit for endotracheal intubation which may be accomplished either blindly or with fibreoptic assistance. Although a standard curved Polyvinyl Chloride (PVC) ETT can be used but alternatively a specialized wire reinforced ETT can be uninterruptedly passed through the ILMA into the trachea. The cuffed mask of the ILMA when seated over the glottis does not distort the pharyngeal wall structures. This lack of distortion of sensitive extra-glottic structures by the ILMA may be responsible for less oropharngeolaryngeal stimulation.
With favourable configuration of ILMA suggestive of less hemodynamic response during endotracheal intubation, the present study was designed to compare the hemodynamic responses during intubation by direct laryngoscopy and by ILMA.
The present randomized prospective study was carried out after institutional ethical committee approval and informed written consent on 80 ASA grade I/II patient aged 18-60 years of either sex, undergoing elective surgeries under general anaesthesia. After complete preanaesthetic check up patients with hypertension, severe hepatic, renal, endocrine and cardiac dysfunction was excluded from the present study. Other exclusion criteria were patients with expected difficult airway (Mallampatti grade III and IV).
All patients were randomly allocated to two groups using sealed envelopes but not blinded to the investigator. Patients of Group I were intubated by intubating laryngeal mask airway, patients of Group M were intubated with Macintosh laryngoscope.
All patients received oral alprazolam 0.5 mg night before and kept fasting 6 hours prior to surgery. After arrival in the operation theatre, standard monitoring of heart rate, blood pressure SPO2 and ECG was done using multipara monitor. Intravenous line with 18 gauge (18G) cannula was secured in the non-dominant forearm and ringer lactate was started at the rate of 10 ml/kg. Intravenous midazolam 0.015 mg/kg and glycopyrrolate 0.005 mg/kg i.v. were given as premedication before induction of anaesthesia. After preoxygenation for 3 min with 100% oxygen, anaesthesia was induced with intravenous propofol (2-3 mg/kg) followed by vecuronium bromide 0.1 mg/kg i.v. to facilitate tracheal intubation. The patients were manually ventilated by face mask with 100% oxygen till muscle relaxation was achieved (abolition of twitch response).
Patients of group I were intubated with proper size, cuffed, well lubricated endotracheal tube using Macintosh laryngoscope. In ILMA group, a size 3 or 4 well lubricated (posterior surface) intubating laryngeal mask (3 for female, 4 for male) was inserted with the head in neutral position and the cuff was inflated with 20-30 ml of air (size 3:20 ml, size 4:30 ml). The ILMA was then attached to the anaesthesia breathing system and adequate ventilation was judged by bilateral equal chest wall movement and capnography (waveform). After confirmation that ventilation with the ILMA was unobstructed, a size 7.0 or 7.5, well lubricated reinforced, cuffed, tracheal tube was passed through the intubating laryngeal mask until it reached 15 cm depth marker and then advanced gently into the trachea without applying undue forces. When no resistance was felt, the cuff was inflated and the circuit reconnected. The correct tube placement was confirmed by the presence of bilateral breath by auscultatory method and by capnography. If resistance was encountered or oesophageal intubation occurred, adjusting manoeuvres were applied.
Tracheal intubation attempt was considered to be failed if it could not be accomplished within 3 min or when all adjusting maneuvers have failed and such patients were excluded from the study. These patients were then intubated by direct laryngoscopy. After the tracheal intubation was successful, the ILMA device was removed using 25 cm stabilizing rod to maintain the tube in place to prevent accidental extubation. Maintenance of anaesthesia was achieved with isoflurane and 60% nitrous oxide in oxygen using closed circuit and controlled ventilation with vecuronium bromide 0.02 mg/kg.
The number of attempts, intubation time (the time from removal of the facemask to the time ventilation was established through the tracheal tube with CO2 confirmation) and problems encountered during intubation eg arrhythmias were recorded. Any episode of oxygen saturation <95% and mucosal or dental trauma were also noted.
The following haemodynamic parameters were noted:-
- Heart rate.
- Systolic, diastolic and mean blood pressure (NIBP).
- Any ECG changes
- SPO2
Parameters were recorded at following times:-
- Just before induction(baseline haemodynamic parameters)
- Just after induction but before tracheal intubation
- Just after tracheal intubation
- At regular interval of 1 minute for 5 minutes after tracheal intubation
All intubations were performed by a single experienced investigator. An experienced investigator was one who has already performed, in his/her clinical practice, at least 25 intubations via intubating laryngeal mask airway and more than 100 intubations via direct laryngoscopy.
The results obtained were presented in tabulated manner, statistical analysis was done using SPSS software and following tests were applied, that is, one way ANOVA, repeated measures ANOVA and chi square test. P value of <0.05 was considered statistically significant and value of <0.001 is considered statistically highly significant.
The demographic profile of the patients, were comparable between the groups in term of their age, weight and sex (Table 1). There was also no significant difference between both the groups in term of ASA physical status.
Table 1. Demographic profile of patients in the 2 study groups.
Demographic Parameter |
Group I |
Group M |
p-value* |
Sex distribution (females:males) |
33:7 |
35:5 |
0.531 |
Weight (kgs) |
57.05 ± 10.2556 |
54.62 ± 11.4459 |
0.675 |
Age(yrs) |
37.075 ± 12.462 |
35.4 ± 12.90 |
0.556
|
*(p-value < 0.05 considered statistically significant)
The mean time taken for intubation with the ILMA was 85.25 ± 13.19 seconds and the mean time taken for successful intubation using the Macintosh laryngoscope was only 17.25 ± 9.74 seconds. The difference in the meantime taken for successful intubation was significantly longer in patients of group I compared to the group M ( p value is 1.96425E-40) ( Table 2).
Table 2. ASA Grade.
ASA Grade |
Group I |
Group M |
p-value* |
ASA group (I/II) |
27/13 |
25/15 |
0.998
|
*(p-value < 0.05 considered statistically significant)
The heart rate in patients of Group Iincreased from the baselineto immediate post-intubation (Table 3),which increased till 2 minutes and thereafter showed decreasing trend during 3rd, 4rth and 5th minute post intubation. The heart rate similarly increased significantly in patients of Group M in immediate post intubation period. Thereafter the rate steadily decreased till 5 minutes post-intubation. The baseline HR was statistically insignificant for the Group I and Group M but in immediate post intubation till 5 minutes post intubation with statisticallysignificant difference (Graph 1).
Table 3. Time taken for intubation.
Group I |
Group M |
p-value* |
85.25 ± 13.19 |
17.25 ± 9.74 |
1.96425E-40 |
*(p-value < 0.05 considered statistically significant)
On Intra-group comparison in Group I the base line heart rate values were compared with heart rate at different time interval just after intubation and at every one min interval till 5 minutes respectively. There was no significant change in heart rate at the time of intubation and post intubation with ILMA (Table 4). Similarly on intra-group comparison in group M it was seen that the p-values were significant at immediate and 1 minute post intubation period and thereafter from 2nd minute to 5th minute it was not significant statistically (Table 5).
Table 4. Intra group heart rate changes (Group I).
Time Interval |
Mean HR ± SD(bpm) |
% change from baseline |
P value* |
Baseline |
85.55 ± 16.82 |
|
|
Immediate post intubation HR |
88.725 ± 17.426 |
+3.711 |
0.44 |
1 minute post intubation HR |
88.4 ± 16 |
+3.33 |
0.43 |
2 minute post intubation HR |
85.7 ± 14.939 |
+0.175 |
0.966 |
3 minute post intubation HR |
84.25 ± 14.91 |
-1.52 |
0.71 |
4 minute post intubation HR |
82.975 ± 14.46 |
-3.01 |
0.46 |
5 minute post intubation HR |
81.4 ± 14.75 |
-4.85 |
0.24 |
*(p-value < 0.05 considered statistically significant)
Table 5. Intra group heart rate changes (Group M).
Time Interval |
Mean HR ± SD(bpm) |
% change from baseline |
P value* |
Baseline |
89.35 ± 12.91 |
|
|
Immediate post intubation HR |
102.62 ± 20.71 |
+14.852 |
0.0009 |
1 minute post intubation HR |
99.85 ± 19.14 |
+11.75 |
0.005 |
2 minute post intubation HR |
95.38 ± 18.55 |
+6.74 |
0.09 |
3 minute post intubation HR |
93.225 ± 16.55 |
+4.33 |
0.247 |
4 minute post intubation HR |
91.27 ± 16.86 |
-2.14 |
0.583 |
5 minute post intubation HR |
91.47 ± 16.27 |
-2.37 |
0.519 |
*(p-value < 0.05 considered statistically significant)
On comparing the two groups it was observed that the maximum increase in heart rate for Group I was +3.711% and for Group M it was +14.852% from the baseline and within 1 minute post intubation in both the groups and thereafter there was decreasing trend in heart rate till 5 minutes in both the groups (Graph 1).
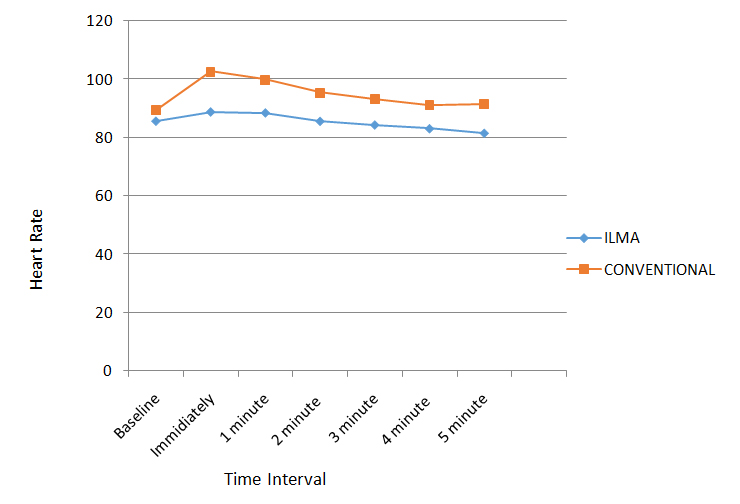
Graph 1. Changes in heart rate
When Systolic Blood Pressure (SBP) values were compared between Group I and Group M the p-values were statistically highly significant after intubation at immediate post intubation and statistically significant at 1 minute post intubation period. Values reached to below baseline at 2 minutes post intubation in Group M. P-value were significant immediately after intubation and also at 1 minute post intubation. The result indicates that there is a significant in rise in SBP between Group I and Group M (Graph 2). On Intra-group comparison in group I the p-values weresignificant at 2 minute to 5th minute post intubation period .There was continuous fall in SBP from immediate post intubation period till 5th minute and maximum fall was at 5th minute (11.57%) (Table 6). On Intra-group comparison in group M the p-values were significant at immediate post intubation period and from 3rd minute to 5th minute post intubation. So the present study infers that there was significant initial risein SBP at immediate post intubation period thereafter there was continuous fall and it reached below baseline value at 2 minute. The maximum fall was at 5th minute (8.69%) (Table 7).
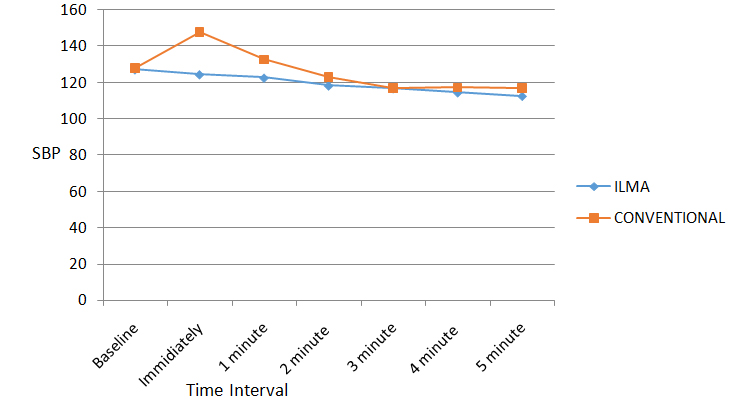
Graph 2. Comparison of the systolic blood pressure changes.
Table 6. Intra group systolic blood pressure changes (Group I).
Time Interval |
Mean of SBP ± SD
(mm Hg) |
% change from baseline |
P value* |
Baseline |
127 ± 13.72 |
|
|
Immediate post intubation SBP |
124.3 ± 14.2 |
-2.4 |
0.3814 |
1 minute post intubation SBP |
122.45 ± 13.09 |
-3.5 |
0.127 |
2 minute post intubation SBP |
118.07 ± 13.64 |
-7.03 |
0.004 |
3 minute post intubation SBP |
116.5 ± 13.34 |
-8.26 |
0.0007** |
4 minute post intubation SBP |
114.27 ± 12.78 |
-10.02 |
4.62E-05** |
5 minute post intubation SBP |
112.3 ± 10.3 |
-11.57 |
5.84E-07** |
*(p-value < 0.05 considered statistically significant)
**(p-value < 0.001 considered statistically highly significant)
Table 7. Intra group systolic blood pressure changes (Group M).
Time Interval |
Mean of SBP ± SD
(mm Hg) |
% change from baseline |
P value * |
Baseline |
127.9 ± 13.84 |
|
|
Immediate post intubation SBP |
147.87 ± 21.89 |
+15.6 |
5.57576E-06** |
1 minute post intubation SBP |
132.62 ± 27.78 |
+3.69 |
0.28 |
2 minute post intubation SBP |
122.92 ± 20.76 |
-3.89 |
0.211 |
3 minute post intubation SBP |
116.87 ± 19.7 |
-8.62 |
0.004 |
4 minute post intubation SBP |
117.22 ± 18.38 |
-8.35 |
0.004 |
5 minute post intubation SBP |
116.8 ± 18.71 |
-8.679 |
0.003 |
*(p-value < 0.05 considered statistically significant)
**(p-value < 0.001 considered statistically highly significant)
When Diastolic Blood Pressure (DBP) values were compared between Group I and Group M the p-values were significant after intubation till 5 minutes with significant difference (Graph 3). On intragroup comparision in group I the p-values weresignificant at 2 minute to 5th minute post intubation period .There was initial insignificant rise (2.5%) in DBP at immediate post intubations period and reached normal value at 1 minute thereafter there was continuous fall till 5th minute and maximum fall was at 5th minute (9.3%) (Table 8). Intra-group comparison in group M the p-values weresignificant at immediate and 1 minute post intubation period so we can infer that there was significant rise in DBP at immediate and 1 minute post intubation and DBP reached normal value at 4rth minute. The maximum increase in DBP for Group M was 19.61% at immediate post intubation period which was highly significant statistically (Table 9).
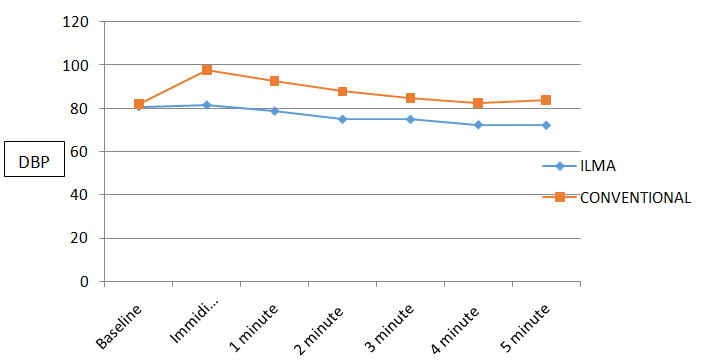
Graph 3. Comparison of the diastolic blood pressure changes.
Table 8. Intra group diastolic blood pressure changes (Group I).
Time Interval |
Mean of DBP ± SD
(mm Hg) |
% change from baseline |
P value* |
Baseline |
79.55 ± 8.69 |
|
|
Immediate post intubation DBP |
81.55 ± 10.45 |
+2.5 |
0.354 |
1 minute post intubation DBP |
78.27 ± 9.52 |
-1.609 |
0.686 |
2 minute post intubation DBP |
74.92 ± 11.17 |
-5.82 |
.042 |
3 minute post intubation DBP |
74.87 ± 12.24 |
-5.88 |
.050 |
4 minute post intubation DBP |
72.37 ± 10.6 |
-9.02 |
.001 |
5 minute post intubation DBP |
72.15 ± 11.9 |
-9.30 |
0.002 |
*(p-value < 0.05 considered statistically significant)
Table 9. Intra group diastolic blood pressure changes (Group M).
Time Interval |
Mean of DBP ± SD
(mm Hg) |
% change from baseline |
P value* |
Baseline |
81.82 ± 9.58 |
|
|
Immediate post intubation DBP |
97.87 ± 20.79 |
+19.61 |
2.91E-05** |
1 minute post intubation DBP |
92.52 ± 18.54 |
+16.74 |
0.00175 |
2 minute post intubation DBP |
87.82 ± 17.75 |
+7.33 |
0.063 |
3 minute post intubation DBP |
84.65 ± 17.05 |
+3.47 |
0.363 |
4 minute post intubation DBP |
82.52 ± 16.2 |
+0.856 |
0.814 |
5 minute post intubation DBP |
83.82 ± 16.61 |
+2.44 |
0..511 |
*(p-value < 0.05 considered statistically significant)
**(p-value < 0.001 considered statistically highly significant)
All patients were intubated in first attempt in group M whereas in group I 32(80%) patients were intubated in first attempt and remaining 20% in second attempt (Table 10). It was found that two patients (5%) in group I had mucosal injury during intubation and none of the patients had mucosal injury in group M. Group I had post-operative pharyngeal complications as sore throat in two patients (5%) whereas group M had incidence of sore throat in three patients (7.5%). There was no statistically significant difference between the two groups with regards to complications (Table 11).
Table 10. Number of attempts for successful intubation.
Attempts |
Group I |
Group M |
First attempt |
32(80 %) |
40(100 %) |
Second attempt |
8(20 %) |
|
Table 11:Complications during intubation and in postoperative period.
2021 Copyright OAT. All rights reserv
|
Group I |
Group M |
During Intubation |
|
|
ECG Changes |
0 |
0 |
Mucosal Injury |
2(5 %) |
0 |
Postoperative |
|
|
Hoarseness |
0 |
0 |
Sore throat |
2(5 %) |
3(7.5 %) |
Tracheal intubation provides excellent protection of the airway from aspiration allows positive pressure ventilation and is versatile in different kinds of surgery and positions. For tracheal intubation direct vision laryngoscopy is the most accurate and prompt method but laryngoscopy (without intubation) and intubation stimulate the pharyngeal tissues and lead to a hypertensive ‘pressor’ response. Although these hemodynamic changes are short lived, they may be undesirable in patients with pre-existing myocardial or cerebral insufficiency.
In the present study the mean intubation time in ILMA group was 85.25 ± 13.19 seconds and 17.25 ± 9.74 seconds in Macintosh Laryngoscopy group. The difference in intubation time between the two groups was statistically highly significant statistically.
S. Kihara et al. [5] found that intubation time with ILMA blind (57 seconds) is longer than direct laryngoscopic intubation (33 seconds). Similarly Dr. Neerja Bharti [6] found that intubation time with ILMA blind (59.8 seconds) was longer than Laryngoscopy group (35 seconds). P value was statistically significant (<0.05)
The intubation time in above mentioned studies had statistically significant difference whereas we found this difference to be highly significant. This difference in results may be due to less experience and expertise of the person performing the intubations and also that of the assistant who is helping him in the procedure which consist of two steps: 1st insertion of ILMA & 2nd intubation. An assistant is required to first inflate the ILMA cuff for checking the ventilation, and then deflate the ET tube cuff to make it mobile, and finally re-inflateit after it has entered into the trachea.
Naveed Tahir Siddiqui et al. [7] compared hemodynamic response to tracheal intubation via Intubating Laryngeal Mask Airway (ILMA) versus direct laryngoscopy. The rise in systolic blood pressure in direct laryngoscopy group was 26% and 13% when compared with the baseline for first two minutes, while in ILMA group the increase was 8-12%. When both groups were compared statistically significant difference (P<0.05) was observed. The rise in diastolic blood pressure was 23% and 7% in group - I and II respectively when compared with the baseline. Statistically significant difference in rise in mean arterial blood pressure (P<0.05) was observed at first two minutes following intubation between the two groups. The increase in heart rate was observed after intubation in both the groups but it was not statistically significant.
Kahl M et al. [8] studied the stress response to tracheal intubation in patients undergoing coronary artery surgery: direct laryngoscopy versus an intubating laryngeal mask airway and recorded Electrocardiogram with automatic ST-segment analysis and invasive measured blood pressure continuously and blood samples to analyze norepinephrine plasma levels were drawn at 4 times. Catecholamine concentrations and the pressure-rate product were analyzed by using an analysis of variance for repeated measures. In both groups, the pressure-rate product (p=0.003) and norepinephrine concentrations (p<0.0001) significantly decreased after induction of anesthesia. However, the fall was more marked in the patients intubated via the laryngeal mask (p=0.031) than in patients receiving direct laryngoscopy. There were neither signs of cardiac ischemia nor major adverse events during induction of anesthesia
Our results in relation to hemodynamic changes correlate well with the above mentioned studies. The possible cause attributed to less pressor response in ILMA group may be that ILMA neither require elevation of the epiglottis, nor does it stimulates the proprioceptors at the base of the tongue as during laryngoscopy. This reduced oropharyngeal stimulation at supraglottic level and also at subglottic level due to soft tip, well lubricated silicone tube, and probably leads to lesser adrenergic stimulation than laryngoscope guided intubation.
Zhang et al. [9] in their study concluded that sympathetic stimulation with the ILMA was comparable to direct Laryngoscopy.
S. Kihara et al. [10] compared the haemodynamics responses in normotensive and hypertensive anaesthetized paralysed patients among three intubation devices: Macintosh Laryngoscope (ML), the Trachlight (LW), and ILMA 75 normotensive and 75 hypertensive were randomly assigned to each intubation device (n=25). In all groups, HR increased, but there was no increase in SBP and DBP other than in DBP in the ML/hypertensive group after intubation compared to baseline values, in normotensive patients, there was no rise in haemodynamic variables among the three devices. In hypertensive patients, SBP and DBP in laryngoscopy group were significantly higher than the LMA and LW groups for 2 mins after intubation, but there were no differences in HR among the devices.
These inter-study differences may be related to the use IV Lignocaine at induction by some investigators [11], greater depth of anaesthesia or different sequence of adjusting manoeuvres, may also be due to the use of different type of endotracheal tubes (softer fastrach silicone wire-reinforced tube used in ILMA group and rigid Poly vinyl chloride tube in conventional laryngoscopy group which we used in our study) and due to factors such as the duration and force used during laryngoscopy and number of attempts taken. ILMA guided intubation is a lengthy process and the ILMA causes compression of the pharyngeal structures, which can even exceed the capillary perfusion pressure. Also the multiple manoeuvres associated with ILMA insertion along with the need to grasp the jaw and adjustment of patients head and neck make ILMA insertion a potent sympathetic stimulant.
Shribman et al. [12] found that the plasma catecholamine levels and haemodynamic stress response to 10 seconds Laryngoscopy were similar to layngoscopy followed by tracheal intubation.
The above study clearly suggests that it is the Laryngoscopy that is responsible for haemodynamic stress response rather than the intubation however study done by Bennet et al. [13] compared the haemodynamic responses with ventilation via the LMA and intubation via the ILMA and direct Laryngoscopy in 27 patients scheduled for coronary artery bypass grafting. They concluded that intubation with either of the devices causes an appreciable increase in sympathetic outflow which was not seen with the LMA. And they concluded that tracheal intubation is the stimulus that causes the sympathetic response.
The mechanism of sore throat consequent to placement of ILMA has been investigated by Keller and Brimacombe [14]. Pharyngeal mucosal pressure was measured in six different locations using Silicon microchip pressure sensors. In most of the sensor locations pressure exerted by ILMA on the Pharyngeal mucosa exceeded the pressure of mucosal capillary pressure (40 cm H20) many times. The highest pressure noted was 169 cm H20 in the distal oropharynx and corresponded with silicon coated steel airway tube resting against the posterior oropharynx over the cervical vertebrae. The pressure exerted there were unrelated to intracuff pressure and the author's recommendation to remove the ILMA post intubation should be noted.
In the present study incidence of post-operative sore throat was comparable in both the groups. Adequate precaution like adequate lubrication of ILMA has decreased the complications tremendously. The low incidence of complications coupled with good success rate profile makes them suitable for use in a wider patient profile as well.
Intubating Laryngeal Mask can maintain airway and oxygenation of the patient throughout the intubation procedure. Despite taking more time than DLS, ILMA offers advantage in attenuating the hemodynamic responses compared to DLS, though numbers of attempts required were more with ILMA as compared to ML. The incidences of postoperative complications were minimal and comparable with both the devices. Hence we conclude that ILMA is a safer alternative to direct laryngoscopy for intubation and offer advantage of being able to provide ventilation until intubation is achieved. The success rate of ILMA overall was similar to that of direct laryngoscopy and intubation.
- Barak M, Ziser A, Greenberg A, Lischinsky S, Rosenberg B (2003) Hemodynamic and catecholamine response to tracheal intubation: direct laryngoscopy compared with fiberoptic intubation. J Clin Anesth 15: 132-136. [Crossref]
- Imai M, Matsumura C, Hanaoka Y, Kemmotsu O (1995) Comparison of cardiovascular responses to airway management: fiberoptic intubation using a new adapter, laryngeal mask insertion, or conventional laryngoscopic intubation. J Clin Anesth 7: 14-18. [Crossref]
- Friedman PG, Rosenberg MK, Lebenbom-Mansour M (1997) A comparison of light wand and suspension laryngoscopic intubation techniques in outpatients. Anesth Analg 85: 578-582. [Crossref]
- Kaul TK, Valech V, Kathuria S, Chatrath R, Gautam PL (1999) Catecholamine responses to endotracheal intubation and laryngeal mask airway insertion. Ind. J.Anaesth 43: 30-35.
- Kihara S, Watanabe S, Taguchi N, Suga A, Brimacombe JR (2000) Tracheal intubation with the Macintosh laryngoscope versus intubating laryngeal mask airway in adults with normal airway. Anaesthesia Intensive Care 28: 281-286. [Crossref]
- Neerja Bharti, Asit Kumar Naik (2006) Ease of insertion and haemodynamic effect following tracheal intubation. Indian J Anaesth 50: 205-208.
- Siddiqui NT, Khan FH (2007) Haemodynamic response to tracheal intubation via intubating laryngeal mask airway versus direct laryngoscopic tracheal intubation. J Pak Med Assoc 57: 11-14. [Crossref]
- Kahl M, Feberhart LH, Behnke H, Sanger S, Schwarz U, et al. (2004) Stress response to tracheal intubation in patients undergoing coronary artery surgery: direct laryngoscopic verses ILMA. J Cardio thorac Vasc Anaesth 18: 275-280.
- Zhang, Guo- Hua, XUE, Fu- Shan, SUN, et al. (2006) Comparative study of haemodynamic responses to orotracheal intubation with intubating laryngeal mask airway and direct laryngoscope. Chinese Medical Journal 119: 899-904. [Crossref]
- Kihara S, Brimacombe J, Yaguchi Y, Watanabe S, Taguchi N, Komatsuzaki T (2003) Haemodynamic responses among three tracheal intubation devices in normotensive and hypertensive patients. Anaesth Analg 96: 890-895. [Crossref]
- Kihara S, Yaguchi Y, Brimacombe J, Watanabe S, Taguchi N (2001) Routine use of the intubating laryngeal mask airway results in increased upper airway morbidity. Can J Anaesth 48: 604-608. [Crossref]
- Shribman AJ, Smith G, Achola KJ (1987) Cardiovascular and catecholamine responses to laryngoscopy with and without tracheal intubation. Br J Anaesth 59: 295-299. [Crossref]
- Bennett SR, Grace D, Griffin SC (2004) Cardiovascular changes with the laryngeal mask airway in cardiac anaesthesia. Br J Anaesth 92: 885-887. [Crossref]
- Keller C, Brimacombe J (1999) Pharyngeal mucosal pressures, airway sealing pressures, and fibreoptic position with the intubating versus standard laryngeal mask airway. Anaesthesiology 90: 1001-1006. [Crossref]