In musculoskeletal medicine, advanced imaging like computed axial tomography (CT) scanning, has become invaluable to the evaluation and management of patients with musculoskeletal disease. Bone detail is much better visualized with 2D and 3D CT renderings of patients with problems like glenoid fracture, failed shoulder instability surgery, and meniscal root avulsions like shown in Figures 1-3 respectively.
Figure 1. 2D rendering of glenoid bone loss secondary to chronic shoulder instability.
Figure 2. 3D rendering of a shoulder following failed instability surgery.
Figure 3.3D rendering of a bony ossicle, representing a medial meniscal posterior horn root avulsion.
As illustrated, these high quality images provide multiplanar two and three-dimensional visualization for practitioners who think and work in three dimensions. These images make it easier for physicians to educate their patients, teach and train medical students, residents, and post graduate fellows. A significant limitation of current CT technology is that current technique forces image acquisition with the subject in a supine, relaxed position. Some have tried to simulated weight bearing in a CT scanner by custom designing a rig to apply longitudinal load thru the patient for imaging of the spine or lower extremity. These methods are at worst, a poor depiction of functional anatomy, and at best cumbersome and a less than accurate simulation of function. A new, prototype (not FDA approved) cone beam CT scanner is in development by Carestream Health (Rochester NY) to acquire weight bearing images of the extremities. In March, 2016 Carestream filed a 510(k) application, and subsequently received FDA clearance of the OnSight 3D Extremity System, designed to offer high-quality, portable, low-dose 3D point-of-care imaging by orthopaedic and sports medicine practices, hospitals, imaging centers, urgent care facilities and other healthcare providers (Figure 4).
Figure 4.Schematic of the OnSight 3D Extremity System.
John Marzo, M.D. and other researchers from the Jacobs School of Medicine and Biomedical Sciences, State University of New York, University at Buffalo are currently performing institutional IRB approved clinical trials and basic sciences studies with the prototype model. Based on early data, they are convinced that many imaging studies should be acquired with subjects in positions that represent true human function, such as weight bearing on the lower extremities.
In order to investigate Cone Beam Computed Tomography (CBCT) scanner,was compared to the predicate Carestream DRX-1 GOS detector (K090318) used with the Carestream DRX-Evolution (EVO) system. The 3D volumetric imaging performance of the scanner was compared to a multiple detector computed tomography (MDCT) scanner ("predicate device"), the Philips Brilliance 64 CT Scanner.The purpose of the study was to demonstrate equivalent diagnostic image quality between the investigational and predicate devices, using a RadLex subjective quality rating scale. The evaluation was performed on equal numbers of knees, ankles, feet, elbows, and hands from thirty-three cadaveric human specimens, and from thirteen living human subjects. Four independent, board certified radiologists of varying general reading experience performed an evaluation of the images/exams captured using both the investigational and predicate devices. In summary, the investigational CBCT system produced 2D images with equivalent diagnostic image quality to the predicate system for a range of exams, and 3D images were rated equal or better when compared to the predicate device for a range of exams on cadaveric specimens and human subjects. Over 80% of all the 2D images were rated diagnostic or exemplary, whereas approximately 98% of all 3D images were rated diagnostic or exemplary. More than 75% of all RadLex rating responses counted for all 2D images were rated equivalent or favored the investigational device. Approximately 85% of the RadLex rating responses counted for the 3D images were rated equivalent or favored the investigational device. Examples of representative scans are seen below (Figure 5).
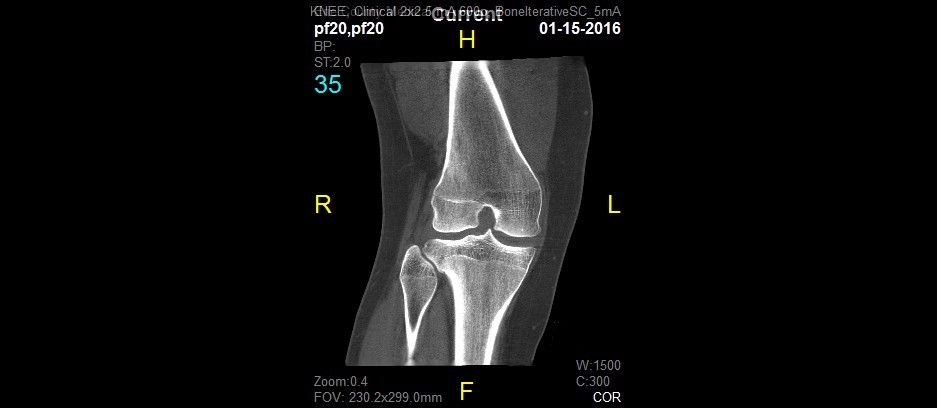
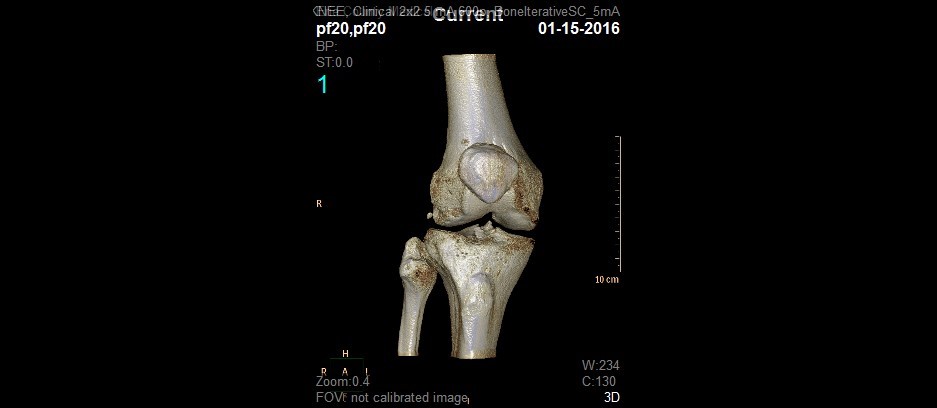
Figure 5. 2D and 3D renderings generated by the CBCT scanner.
Conventional CT measures of patellofemoral alignment include the congruence angle, patellar tilt angle, and tibial tubercle-trochlear groove offset distance (TT-TG offset). There are clearly defined limits of normal for each of these measures, and they are used by surgeons planning corrective operations on the patellofemoral joint. When obtained with conventional CT scan technique, the patient is lying supine on the examination table with the knee fully extended. The degree of knee flexion and activity of the quadriceps are known to influence patellar tracking on the trochlea, but these factors are removed when images are taken with the patient supine. The new investigational cone beam CT scanner has been designed to allow for acquisition of images while the patient is standing, weight bearing, and in various positions of knee joint flexion. An IRB approved clinical study was designed to compare several commonly used measures of patellofemoral alignment (tilt angle, congruence angle, and TT-TG offset) on a conventional CT scanner to the same measures on the prototype extremity cone beam CT scanner. Based on previous data, the primary hypothesis was that measures of patellofemoral alignment obtained from the prototype cone beam CT scanner will be less than those obtained by the conventional CT scanner. In a prospective case series, twenty patients with known patella instability were imaged on both a conventional CT scanner and on the prototype cone beam CT scanner. Objective assessment of patellofemoral alignment (tilt angle, congruence angle, TT-TG offset) were measured on images obtained from the conventional CT scans and from the prototype device by 2 independent reviewers. For both raters, tilt angle, congruence angle, and TT-TG offset were statistically significantly decreased on cone beam versus conventional CT scan (Table 1).
Table 1. Patella measurements for conventional versus cone beam CT scans by rater
|
Rater 1 |
Rater 2 |
Average for both raters |
Measurements |
Conventional CT |
Cone Beam CT |
P-Value |
Conventional CT |
Cone Beam CT |
P-Value |
Conventional CT |
Cone Beam CT |
P-Value |
Congruence Angle |
22.8 ± 17.3 |
0.15 ± 31.1 |
0.001 |
30.7 ± 20.1 |
5.8 ± 30.8 |
<0.0001 |
26.7 ± 18.1 |
3.0 ± 30.1 |
0.0002 |
Tilt Angle |
28.0 ± 7.3 |
18.1 ± 12.3 |
<0.0001 |
28.2 ± 7.3 |
18.2 ± 11.3 |
<0.0001 |
28.1 ± 7.1 |
18.2 ± 11.6 |
<0.0001 |
TT-TG Offset |
21.4 ± 4.2 |
12.8 ± 6.3 |
<0.0001 |
18.9 ± 4.3 |
11.8 ± 7.6 |
0.001 |
20.1 ± 4.2 |
12.3 ± 6.3 |
<0.0001 |
All values are mean ± SD.
CT, computed tomography, TT-TG, tibial tuberosity trochlear groove
Our conclusion from this study is that for cases of patella instability, it may be desirable to obtain images while the patient is weight bearing on a flexed knee with their quadriceps muscles active. Improvement in objective measures of patella alignment should lead to improved clinical and surgical care of patients with this condition
A second clinical study is currently underway to take advantage of the unit’s ability to obtain images in weight bearing, and will compare measures of ankle stability from the investigational weight bearing cone beam computed tomography scanner to the same measures on gravity stress X-ray in patients who have supination-external rotation ankle fractures. The primary hypothesis is that the mean medial clear space will be different for the investigational weight bearing cone beam CT scan versus the gravity stress X-ray. Supination-external rotation (SER) or Weber B type ankle fractures are considered the most common type of ankle fracture. An SER fracture is considered unstable when it is associated with deltoid ligament rupture. Clinical findings of medial tenderness, swelling, and ecchymosis were once thought to be reliable for correctly determining the stability of SER ankle fractures, but have since proven to be poor predictors of deltoid ligament disruption. Rupture of the deltoid ligament allows lateral talar shift, and can be identified by widening of the medial clear space on standard radiographs as well as stress radiographs. Many studies have shown that gravity stress radiographs are necessary and are currently considered to be the gold standard for diagnosis of SER fractures. Of all the methods that have been used to diagnose instability and investigate deltoid ligament integrity - clinical examination, weight bearing radiographs, stress radiography, magnetic resonance imaging (MRI), arthroscopy, ultrasound - none have been shown to be cost-effective, rapid, reliable, and easy to use. Gravity stress radiographs are performed without a uniform method, are known to lack sensitivity, and are very user dependent. Therefore, more research is needed to determine which method is most accurate and efficient for SER fracture diagnosis. Weight bearing on the extremity is thought to be more representative of the normal use of the ankle joint, and CT scan is known to deliver excellent bone detail for interpretation of images. The ability of weight bearing cone beam CT scanning to measure medial clear space may present a new opportunity to evaluate instability of SER ankle fractures.
These and future studies may validate the value of the OnSight 3D Extremity System. Potential benefits include better quality images with a lower radiation dose than conventional computed tomography. The unit is proposed for use in-office, but may have application to the operating room for orthopedic surgeons or at athletic competition sites. The unit is less expensive than a traditional in-hospital or radiology center CT scanner, and can be used with existing electrical systems (220V). Most important however, is the potential to acquire images while weight bearing and in more relevant functionally positions.