The purpose of this study was to compare and correlate the central corneal thickness (CCT) measurement obtained by ultrasound pachymetry, optical coherence tomography (OCT) pachymetry, and specular microscopy to better understand the importance of central corneal thickness in the evaluation and diagnosis of glaucoma. The study compared the central corneal thickness of 8 patients (16 eyes) with each modality.
The mean CCT was 531.47 ± 42.20 µm by ultrasound pachymetry. In comparison, CCT averaged 517.63 ± 43.29 µm by OCT, and 529.88 ± 57.02 µm by specular microscopy. Correlations (r2) of CCT were analyzed, whereby the three modalities were compared to one another. For ultrasound pachymetry vs. OCT pachymetry, r2=0.93 and P<0.0001. For ultrasound pachymetry vs. specular microscopy, r2=0.88 and P<0.0001. For OCT pachymetry vs. specular microscopy, r2=0.98 and P<0.0001.
In conclusion, OCT pachymetry, specular microscopy, and ultrasound pachymetry can be used in clinical settings to measure CCT. Our study showed statistically significant linear correlations among the three modalities of measurement. Accurate measurement of CCT aid ophthalmologists in managing glaucoma. The ultrasound pachymeter showed the least variance among the techniques and therefore, may be the most accurate method of measuring central corneal thickness.
central corneal thickness, optical coherence tomography, ultrasound pachymetry, specular microscopy
Glaucoma is defined as optic disc atrophy with characteristic thinning of the outer rim of the optic nerve head with increased intraocular pressure (IOP), usually greater than 21 mmHg. This disease is characterized by significant retinal ganglion cell death, which can lead to progressive peripheral visual field loss if untreated. By the time patients with glaucoma begin to experience visual loss, extensive optic nerve damage has already occurred. Glaucoma is diagnosed primarily by observing optic nerve cupping and retinal nerve fiber loss, along with increased intraocular pressure. Additionally, the importance of measuring the central corneal thickness (CCT) of both eyes in suspected glaucoma patients has been previously reported [1]. IOP readings obtained by non-contact applanation tonometry can be falsely decreased in individuals with thin corneas and falsely elevated in individuals with thick corneas [2]. Therefore, it is important to accurately assess the CCT in order to obtain correct IOP values to aid in the diagnosis and management of glaucoma.
The most common technique used to measure CCT is ultrasound pachymetry, which involves the direct apposition of an ultrasound probe to the anterior corneal surface [3]. There are a few disadvantages to this method. First, the ultrasound probe must make physical contact with the patient’s cornea. Additionally, the probe must be perpendicular to the corneal surface to obtain an accurate reading. Two additional non-contact techniques for measuring CCT are specular microscopy and optical coherence tomography (OCT). Specular microscopy uses reflections of light from the anterior and posterior corneal surface as a means to distinguish corneal layers and measure central corneal thickness [3]. OCT uses interference patterns of reflected laser light to measure the layers of the cornea [4]. In this study, all three modalities were utilized to obtain CCT measurements for each eye from every participant.
Subjects
In this study, the CCT of 16 eyes from 8 individuals were measured by each modality. The inclusion criteria were patients with glaucoma. The exclusion criteria were patients with normal, healthy eyes (Table 1).
Table 1. Demographics.
Number of subjects |
8 |
Mean/median age (years) |
57.25/53 |
Age range |
34-85 |
Sex ratio (male:female) |
3:5 |
Techniques and instrumentation
“The Kerasonix KSX-1000 ultrasound pachymeter (DGH Technology, Exton, PA, USA) utilizes ultrasound energy to measure CCT. When ultrasound energy is emitted from the probe tip, some of the energy is reflected back in the form of an echo. Based on velocity and time for the energy to travel back to the receiver, a measurement of the corneal thickness is obtained” [3].
“The Konan Noncon Robo Pachy (Konan Medical Corporation, Fairlawn, NJ, USA) is comprised of a non-contact microscope and camera. This device obtains a specular image of the corneal endothelium and measures the central corneal thickness. Subjects were positioned to focus on fixation target, and the corneal image was captured using the Noncon Robo specular microscope. The KSS-300 Image Storage System was used to acquire and save the image and subsequently analyze the CCT” [3].
“The Optical Coherence Tomography device is a non-contact, non-invasive imaging technique that reveals layers of the cornea by analyzing the interference patterns of reflected laser light. OCT provides a true structural measure of the actual tissue thickness. Scans were saved and analyzed for CCT via the Heidelberg Eye Explorer (HEYEX) OCT viewing software” [4].
Procedure
Using the three modalities, measurements were performed on each eye of all the participants by the same examiner during a single visit. The order of testing was randomized. For ultrasound pachymetry, every participant was given drops of 0.5% proparacaine for anesthetic purposes. After the anesthetic took effect, the ultrasound probe tip was gently applied to the central cornea overlying the pupil. This was performed three times to each eye. For the other two non-contact modalities, guidelines were followed and images were analyzed with the respective software of the respective machines without use of any medication.
Statistical analysis
The mean and standard deviation were calculated for CCT measurements acquired by the three measurement devices. Bland–Altman plots were constructed to determine the agreements between the CCT measurements acquired by different equipment, and the P-value was obtained. Pearson’s correlation coefficient (r2) was calculated for CCT, comparing one modality to another.
Measurements by each technique were obtained from all subjects (8 patients and 16 eyes). The mean CCT measured by ultrasound pachymetry from the 8 subjects was 531.47 ± 42.2 μm. In comparison, the mean CCT was 517.63 ± 43.29 μm by OCT pachymetry and 529.88 ± 57.02 μm by specular microscopy (Table 2).
Table 2. Descriptive statistics for the central corneal thickness, as measured by the three different modalities.
|
US Pachymetry |
OCT |
Specular Microscopy |
|
OD |
OD |
OD |
Mean CCT (μm) |
531.47 |
517.63 |
529.88 |
Standard Deviation (SD) |
42.20 |
43.29 |
57.02 |
P-value (paired with US pachymetry) |
N/A |
0.55 |
0.95 |
P-value (OCT paired with Specular Microscopy) |
N/A |
N/A |
0.66 |
Mean ± (SD) CCT difference from US pachymetry (μm) |
N/A |
13.84 (±1.09) |
1.59 (±14.82) |
Mean ± (SD) CCT difference from OCT (μm) |
N/A |
N/A |
12.25 (±13.73) |
Maximum |
593.00 |
588.00 |
634.00 |
Minimum |
469.33 |
444.00 |
429.00 |
Median |
533.50 |
512.00 |
522.50 |
Abbreviations: US pachymetry, ultrasound pachymetry; OCT, optical coherence tomography; CCT, central corneal thickness.
The first Bland-Altman plot shows that the measurements acquired via ultrasound pachymetry were greater than those obtained by OCT pachymetry for all mean CCT values, except for one patient (Figure 1). The mean (± SD) CCT measurement difference between the two methods was 13.84 (± 1.09) μm.
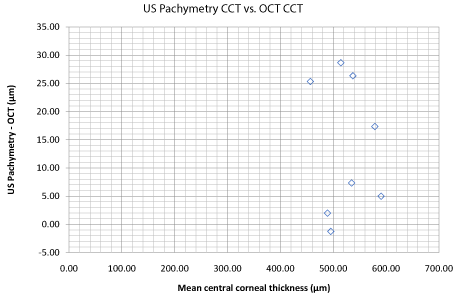
Figure 1. Bland–Altman plot illustrates the difference in central corneal thickness measurements (y-axis) between values obtained by ultrasound pachymetry vs. values obtained by optical coherence tomography (OCT) against the average CCT measurements of the two methods (x-axis). Abbreviations: US pachymetry, ultrasound pachymetry; CCT, central corneal thickness.
The second Bland-Altman plot shows that 4 patients had higher ultrasound pachymetry measurements compared to specular microscopy measurements, while the opposite finding occurred in the other 4 patients (Figure 2). For ultrasound pachymetry vs. specular microscopy, the mean (± SD) difference was 1.59 (± 14.82) μm.
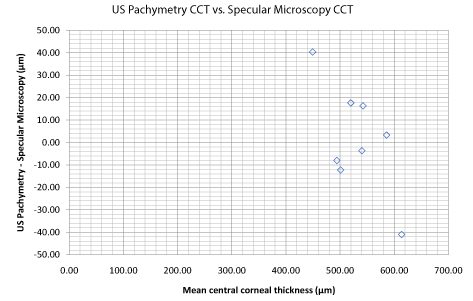
Figure 2. Bland–Altman plot illustrates the difference in central corneal thickness measurements (y-axis) between values obtained by ultrasound pachymetry vs. values obtained by specular microscopy against the average CCT measurements of the two methods (x-axis). Abbreviations: US pachymetry, ultrasound pachymetry; CCT, central corneal thickness.
The third Bland-Altman plot shows that measurements acquired via specular microscopy were greater than those obtained by OCT for all mean CCT values (Figure 3). Table 2 shows that the mean (± SD) difference was 12.25 (± 13.73) μm.
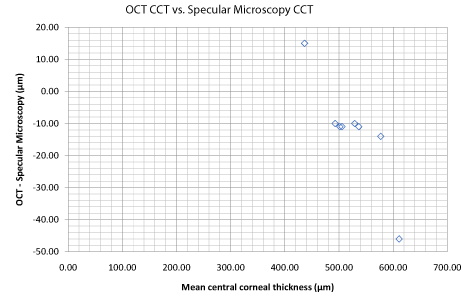
Figure 3. Bland–Altman plot illustrates the difference in central corneal thickness measurements (y-axis) between values obtained by optical coherence tomography (OCT) vs. values obtained by specular microscopy against the average CCT measurements of the two methods (x-axis). Abbreviations: CCT, central corneal thickness.
Among the three methods utilized for measuring CCT, specular microscopy had the best agreement with ultrasound pachymetry, since the mean difference between the two modalities was the smallest (Table 2). Among the three methods, ultrasound pachymetry and OCT had the least agreement, since the mean difference between the two modalities was the largest (Table 2).
The correlation (r2) of CCT measurements obtained via ultrasound pachymetry and OCT was r2=0.93, P<0.0001 (Figure 4). For CCT measurements obtained via ultrasound pachymetry and specular microscopy, r2=0.88, P<0.0001 (Figure 5), and for CCT measurements obtained via OCT and specular microscopy, r2=0.98, P<0.0001 (Figure 6). We found strong correlations between the CCT measurements acquired through these three techniques.
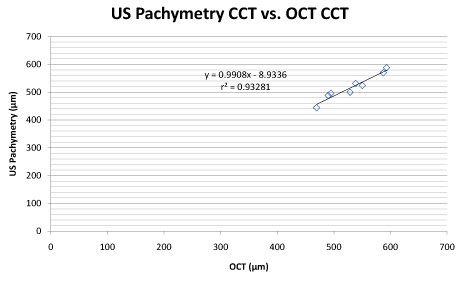
Figure 4. Scatter plot display of ultrasound pachymetry with OCT measurement of CCT (r2=0.93281). Linear equation: y=0.9908x–8.9336. Abbreviations: US pachymetry, ultrasound pachymetry; CCT, central corneal thickness; OCT, optical coherence tomography.
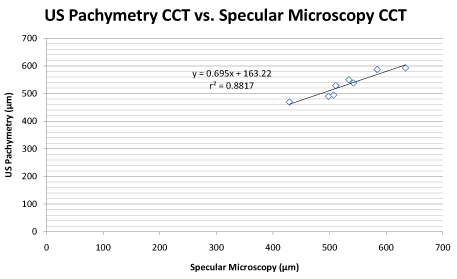
Figure 5. Scatter plot display of ultrasound pachymetry with specular microscopy measurement of CCT (r2=0.8817). Linear equation: y=0.695x+163.22. Abbreviations: US pachymetry, ultrasound pachymetry; CCT, central corneal thickness.
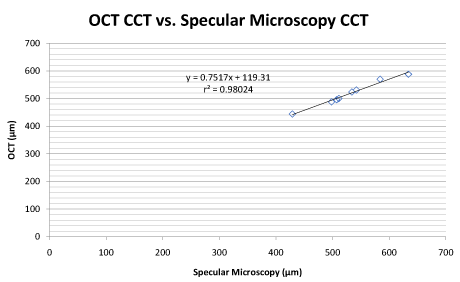
Figure 6. Scatter plot display of OCT with specular microscopy measurement of CCT (r2=0.98024). Linear equation: y=0.7517x+119.31. Abbreviations: OCT, optical coherence tomography; CCT, central corneal thickness.
Identification of glaucoma in patients may be difficult in certain circumstances. Correctly diagnosing glaucoma requires analysis of various parameters such as visual field, IOP, cup-to-disc ratios, retinal nerve fiber layer thickness, blood flow around the optic nerve, and central corneal thickness.
2021 Copyright OAT. All rights reserv
Measuring CCT is necessary for glaucoma patients since CCT influences IOP readings. Schuster has shown the utility of adjusting IOP with a known CCT [2]. Our study compared different techniques for evaluating CCT. The mean CCT measured by ultrasound pachymetry from the 8 subjects was 531.47 ± 42.2 μm. In comparison, the mean CCT measured by OCT was 517.63 ± 43.29 μm, and the mean CCT measured by specular microscopy was 529.88 ± 57.02 μm.
Khaja et al. [3] and Shetgar et al. [1] calculated the mean CCT values from these modalities using subjects with normal, healthy eyes and subjects with glaucoma, respectively. Shetgar et al. [1] found the mean CCT for glaucoma patients to be 503.91 ± 11.31 μm using ultrasound pachymetry. Ayala et al. [5] looked at glaucoma patients with elevated IOPs and obtained a mean CCT value from OCT of 536 ± 29 μm and a mean CCT value from ultrasound pachymetry of 532 ± 32 μm.
Additionally, there was a strong correlation between each of the three techniques, especially between OCT and specular microscopy, where r2=0.98. Among the various comparisons, the weakest correlation was found between ultrasound pachymetry and specular microscopy (r2=0.88), but this correlation was statistically significant.
A limitation of our study was the small sample size. In the future, it would be best to repeat this experiment with a larger sample size.
The authors declare that they have no competing interests. No financial support was received for this submission.
- Shetgar AC, Mulimani MB (2013) The central corneal thickness in normal tension glaucoma, primary open angle glaucoma, and ocular hypertension. J Clin Diagn Res 7: 1063-1067. [Crossref]
- Schuster AK, Fischer JE, Vossmerbaeumer U (2016) Central corneal thickness in Spectral-Domain OCT and associations with ocular and systemic parameters. J Ophthalmol 2596956.
- Khaja WA, Grover S, Kelmenson AT, Ferguson LR, Sambhav K, et al. (2015) Comparison of central corneal thickness: ultrasound pachymetry versus slit-lamp optical coherence tomography, specular microscopy, and Orbscan. Clin Ophthalmol 9: 1065-1070. [Crossref]
- Aref AA, Budenz DL (2010) Spectral domain optical coherence tomography in the diagnosis and management of glaucoma. Ophthalmic Surg Lasers Imaging 41: S15-S27. [Crossref]
- Ayala M, Strandås R (2015) Accuracy of optical coherence tomography (OCT) in pachymetry for glaucoma patients. BMC Ophthalmol 15: 124.


