By the modern molecular biological approaches that exploit the availability of high quality gene expression data, it is made clear that flexible and robust responses of cellular programs are encoded in the relations between gene expression values. These relations naturally define a network where they stand for edges between the nodes that stand for the genes. The wiring of these networks often found to be dysregulated in cancer. Different system biological approaches that rely on correlations, differential equations and logical analysis are used to probe these relations in gene expression data especially. In our work we investigated selected biological functions in aggressive germinal center B-cell lymphoma in terms of a logical analysis of gene-regulation in Boolean space and a signal propagation algorithm considering network topology based on gene expression data. We especially aimed at studying the activity of the MYC gene as a key player. It is shown that the functional output of a gene network is affected by the states of the genes and also by the wirings between them. Our results support the key function of MYC in lymphoma biology. In addition, we showed that genes can alter functional output of the network by alternative mechanisms like reducing the variance in propagating signal and locking it to a certain level.
gene expression analysis, gene regulation, boolean implications, gene regulatory networks, pathway signal flow (PSF), MYC, self organizing maps (SOM)
Abbreviations:
BL: Burkitt’s lymphoma; EQV: Equivalent; GL: Gene level; HH: High-High; HL: High-Low; IN: Implication network; LH: Low-High; LL: Low-Low; MGL: Metagene level; OPP: Opposite; PSF: Pathway signal flow; RN: reference network; SOMs: Self organizing maps and SL: spot level
Organisms have a great variety of biological responses on molecular level to continuously changing intra/inter-cellular and environmental signals. These flexible yet robust response mechanisms to ever changing signals are rendered possible by different organizational levels and by complex gene networks [1-4]. They are found to be dysregulated in many diseases, especially and particularly in cancer. Thus, understanding the biological functions entails constructing the links between genetic entities, gene regulatory networks and cellular responses and understanding the disease mechanisms requires investigating the wirings in the networks.
In eukaryotes each component of the genetic network is often regulated by 4-5 other components of the network that results in a highly integrated regulatory control [5]. These regulatory relations are manifested in the expression of the genes that can be considered as continuous real variables in an interval bounded by min/max expression values of the respective gene. This kind of formalism is used in differential equation related analysis [6,7]. However differential equation methods suffer heavily from the need to a great number of kinetic parameters that usually are not known to a satisfying degree of precision. On the other hand, gene regulatory relations are based on simple building blocks such as promoters, transcription factors and transcription factor binding sites on DNA. These basic components are essentially molecular switches that either turn genes ON or OFF and result in switching modes of the groups of genes in the gene regulatory machinery [8]. Consequently, these modes and the essence of regulatory relations can be captured by Boolean variables and binary logic functions [5]. Apart from its use in various fields like electrical circuits, systems biology approach to whole genome gene expression data, binary logic is a distinguished recent technique that stands due to its simplicity and robustness. Logical analysis methods for biology are pioneered firstly by S.A.Kauffman [9-12]. In general sense logic based methods aim to describe sigmoidal functions as a Boolean step function. Since then logical formalism and methods are used effectively in biology in addition to differential equation methods, correlation based methods and stochastic models (see for a review [13]). The base, formalism and biological reasoning for the method used in this work was developed and applied first by Sahoo et al. [14]. We supplied this method with a machine learning algorithm (SOM) and a pathway signal flow algorithm (PSF) to analyze gene expression networks [15]. The method predicts logical relations between pairs of genes from their expression profiles.
Since years one of the most visited diseases by modern molecular biology and medicine is cancer. Transcriptional regulation is heterogeneous and associates typically to a series of molecular subtypes [16-18]. Understanding of the molecular mechanisms of subtypes of a cancer is particularly of great interest since it has a significant impact on diagnosis and prognosis [19-22].
In this study we address the biology of aggressive germinal center B-cell lymphoma with the focus of Burkitt’s lymphoma (BL) which is probed in relation to MYC and other highly mutated key players (Table 1) with regards to gene expression, gene-regulation, network topology and network organization using a Boolean approach. Our aim is to study the activity of MYC in connection to the other key players of the network and their manifestation onto the significant biological functions. Using gene-gene relations in previous studies on aggressive B-cell lymphomas (referred to as ‘Reference Network’ - RN) [23-25], we identified the genes of the network that act in concert or contrary fashion compared to a data-driven implication network (Implication Network - IN) of B-cell lymphomas. Furthermore we use PSF algorithm to calculate signal flow through two networks and finally we employ previous biological knowledge using biological function nodes in the network. Throughout the study we made use of subtype classification of Hummel et al. that consists of three classes called mBL, non-mBL and intermediate to discuss the results [26].
Our study organizes in three levels. Firstly we analyze gene expression data using a unsupervised machine learning method called SOMs to identify, organize and cluster similarly behaving genes and to reveal the general organization of the data. Then comes the main step of the study that sets the base for network level analysis: we identify logical relations between clusters of genes by using so called Boolean Implication method, which is convenient for our purpose since it provides six different relation classes and also does not assume co-expresion of the genes. These logical relations give us the wirings between the key players of lymphoma and thus constitute an implication network. At this point we carry out a comparison between identified wirings from the data and expected wirings from the literature (topological comparison). The differences in wirings were investigated considering mutations of MYC, TCF3 and some other potential key players [23-25] (Table 1). Lastly we investigate the effect of changing wirings in the network over signal propagation and biological functions such as cell proliferation, cell survival, apoptosis and cell cycle control. These biological functions are required for the formation of Germinal centers and proper maturation of B-cells (Figure 1).
The reference network of MYC regulation in B-cells
We constructed a network that consists of genes that have significant roles and that are frequently dysregulated in aggressive B-cell lymhphomas. Key connections in the gene regulatory network were investigated using mutations in critical actors like MYC and TCF3 [23-25]. MYC encodes a transcription factor that is estimated to have the ability to bind a very significant proportion of genomic sites (~25,000 sites), which gives a clue of its master role [27,28]. In lymphoma studies, and in cancer studies in general, a special attention is given to MYC gene for its “master regulator” properties [29-31]. MYC is noted as an exclusive effector both due to the number of targets that are in relation with MYC and due to the crucial pathways and processes that encapsulates nearly all hallmarks of cancer (cell cycle control [32], cellular transformation [33], proliferation and apoptosis [34], vasculogenesis and angiogenesis [35], cell adhesion [36], metastasis [31], genetic instability [37] and tumorigenesis through miRNAs [38,39]) and that are affected by MCY. Consequently dysfunctional state of this non-linear hub is prevalently associated with bad prognosis of cancer. In addition to MYC, some other key genes are found frequently mutated in B-cell lymphomas; pro-survival associated TCF3, ID3 and cell progression associated CCND3 (Table 1).
Table 1. Mutation rates of highly mutated genes in aggressive B-cell lymphomas [23,40]
percentage of mutated cases |
MYC |
ID3 |
TCF3 |
CCND3 |
BCL6 |
BCL2 |
PTEN |
R.Schmitz,R.Young,M.Ceribelli et al. |
70.7 |
58.5 |
29.2 |
14,6 |
- |
- |
- |
C.Love,Z.Sun,D.Jima et al. |
40.7 |
33.9 |
- |
- |
6.8 |
6.8 |
5.1 |
The constructed a network from relevant literature ([23,24,40]) where MCY constitutes a highly variant network in aggressive B-cell lymphomas is given in Figure 1.
Figure 1. Gene network associated with B-cell function. The network was derived from refs. [23-25] with MYC as the central hub. The dashed line between MYC and PTEN indicates an indirect connection via MIR17HG and mir-19. BCR is known to form complexes with CD79A and CD79B however to indicate and analyze different regulation paths they are shown distinctly in the figure.
Clusters of coregulated genes in lymphoma reflect alterations of the MYC network
We used SOM machine learning algorithm to cluster, visualize and profile gene expression data of a cohort of 220 lymphoma patients previously classified as mBL, non-mBL and intermediate cases [26]. This ‘SOM space’ visualizes the data landscape under study. It is an important property of the SOM clustering method that it ‘self-organizes’ meta-genes (and genes) with similar profiles together into neighboring positions. In consequence, the SOM expression landscape can be segmented into spot-like areas that represent clusters of co-variant meta-genes. These spot-clusters can be interpreted as intrinsic regulatory modes in the multidimensional expression data [41].
Figure 2a shows this map together with the genes considered in the ‘MYC’-network shown in Figure 1. The genes of interest are grouped into three main clusters according to their degree of co-expression. Figure 2b-d shows the representative spot profiles that fall into the clusters. Genes from cluster 1 in the top-right corner are upregulated in BL and downregulated in non-mBL (Red dashed and solid rectangles in Figure 2a,b respectively). Genes in cluster 2 are antagonistically regulated compared with cluster 1 (Figure 2a,c). Cluster 3 shows somewhat intermediate behavior and a moderate expression amplitudes compared with that of cluster 1 and cluster 2 (Green dashed and solid rectangles in Figure 2a,d respectively).
Figure 2. a) Localization of the genes of the MYC-network taken from Fig. 1 in the SOM expression landscape of lymphoma. Most genes are located within or close to the spots identified. Every pixel in the map represents a metagene and encloses a set of genes that show similar expression profiles. Light grey areas represents the spots that enclose a set of metagenes that have similar expression profiles. There are two additional genes shown: p53 and BIM owing to their possible regulatory effect on key genes of the network in some special cases and they will be discussed separately in the text. The genes can be grouped into three clusters colored in red, blue and green, respectively. b)- d) Boxplots of selected spot profiles taken from each of the three clusters (selected spot profiles are the light grey pixel groups that lie in dashed rectangles in figure part a). Note that cluster 1 and 2 collect genes up-regulated in BL and DLBCL, respectively. Consequently Cluster1 genes are in an opposite type relationship with cluster2 genes (Table 2). There are some outliers like and having a probe located close to bottom right corner and , and that seem to be located in between three clusters.
We applied a simple graph-coloring algorithm on reference network to find the nodes that are expected to act in concerted (group 1) or anticoncerted (group 2) with MYC fashion (See Suppl. Section and Suppl.Figure). When we compare these groups with the clusters in the SOM map we see that green colored genes mostly overlap with cluster 1 genes and red colored genes enclose mostly cluster 2 genes. We also identified genes that behave different than expected: BCL2 and STAT3 are found in cluster 2 whereas the scheme predicts their location in cluster 1 (compare Suppl. Figure 1 and Figure 2). Moreover, p16, PTEN and BCL6 are found in cluster 2 instead of cluster 1, as expected (compare Suppl.Figure 1 and Figure 2). The genes PI3K, CD79A and AKT are located in cluster 3 while CDK6 and ALK do not fall in any cluster (compare Suppl.Figure 1 and Figure 2). Hence, the genes of reference network already show a more heterogeneous behavior than expected based on the simple scheme.
Implication analysis identifies
Next, we carried out Boolean implication analysis for the 19 genes that are assumed to be crucial regarding B-cell function collected in Figure 1 to judge the type of mutual interactions between them as described in the methodical section. One of six possible Boolean implications has been assigned to each of the pairwise combination of genes of our network. We used alternatively gene (GL), metagene (MGL) and spot-level (SL) expression profiles as provided by the SOM analysis. In our analysis we primarily used metagene level results since they are more stable, less noisy compared to gene level data and more diverse compared to spot level data. The comparison between different levels of data aggregation and their properties are discussed in a previous publication [15]. Both implications and correlation coefficients for the set of genes are given in Table 2. Pairwise scatter plots of interactions are shown in figures Figure 3 and Figure 4.
Figure 3. Boolean implication analysis results of the metagene couples for expected positive relations in reference network. Blue, red and green dots in the scatterplots represent non-mBL, mBL and intermediate cases, respectively.
Figure 4. Boolean implication analysis results of the metagene couples for expected negative relations in reference network. Blue, red and green dots in the scatterplots represent non-mBL, mBL and intermediate cases, respectively.
Comparison with correlation Analysis
Figure 5 compares gene clustering of the network considered using either Boolean implications or Pearsons correlation coefficients between their expression profiles. Both heatmaps split into two main clusters 1 and 2 that were identified also in the SOM map (Compare Figure 2 and Figure 5). Cluster 3 genes are found at intermediate positions between clusters 1 and 2 in the heatmaps (genes with green font in Figure 5). It turned out that implications provide a better contrast for the different types of interactions compared with correlations. It is also clearly seen that the two clusters in the implication heatmap perfectly match cluster 1 and cluster 2 on SOM map. Moreover, the relations between the genes within the clusters are resolved in terms of HH, LL, EQV, HL, LH and OPP implications (Figure 5b).
Figure 5. Correlation (a) and implication heatmaps (b) of network genes. For reference network correlation analysis and implication analysis yield similar results. All significant correlations are covered by implications in its six different implication classes (b) (Compare with Table 2 metagene level correlation and implication results). Furthermore a better contrast is presented by implication analysis. Additionally one must be aware of the fact that poorly correlated genes can exhibit significant implications. This advantage of Boolean implication analysis is discussed in [15,54].
Topological comparison between reference net and implication net
In our analysis we consider two variants of the network shown in Figure 1 and Figure 6, respectively: (i) The reference network (RN) assumes the interactions between the genes in its ‘canonical’ form. It describes a collection of regulatory paths in healthy B-cells. (ii) The ‘data-driven’ implication network (IN) considers the implications derived from the expression data. Hence, the IN describes the dysfunctional state identified from the lymphoma data, and particularly the differential interactions observed between the lymphoma subtypes. The IN thus describes B-cell lymphoma with potentially differentially dysregulated interactions between the genes. Topological comparison identified two possible differences: (i) A link that is present between two genes in RN is absent in the other network (broken link) or (ii) A link that is present in both networks can change the type of regulations it implies to another type in one network compared to other (type changing).
Five interactions (one activating and four repressing) changed their sign compared with the expected interactions between RN and IN. For instance, MYC is expected to be up-regulated indirectly by the oncogenic effect of STAT3. However, we identified the opposite STAT3 OPP MYC implication between them (Table 2, Figure 3g, Figure 6). Other type changing regulations include BCL6 and MYC, PTEN and CCND3 (Table 2, Figure 4d,e,g).
Table 2. Boolean implications and Pearson correlation coefficients of the network genes. Genes of reported positive and negative relations are listed in the left and the right panel, respectively. Bold font is used for correlation coefficients with absolute values over 0.5. Red font indicates correlations/implications that are found to be different from the RN. Gene names that are possible centers for mutation in lymphoma are shown by underlined text.
|
Positive Relations |
|
Negative Relations |
|
Correlations |
Implications |
|
Correlations |
Implications |
TCF3ÞCCND3 |
0.83 |
HH |
TCF3´SHP1 |
-0.93 |
OPP |
TCF3ÞID3 |
0.99 |
EQV |
SHP1´CD79B |
-0.82 |
LH |
TCF3ÞBCR |
0.99 |
EQV |
SHP1´CD79A |
0.31 |
- |
TCF3ÞPI3K |
0.49 |
HH |
BCL6´BCL2 |
-0.72 |
HL |
CD79AÞPI3K |
0.14 |
- |
BCL6´MYC |
0.55 |
LL |
CD79BÞPI3K |
0.23 |
- |
MYC´PTEN |
0.83 |
HH |
PI3KÞAKT |
0.49 |
- |
PTEN´PI3K |
-0.57 |
HL |
AKTÞMTOR |
0.23 |
- |
BLIMP1´MYC |
-0.15 |
- |
BCRÞPI3K |
0.40 |
HH |
P16´CCND3 |
0.78 |
HH |
MYCÞID3 |
0.98 |
EQV |
P16´CDK6 |
0.33 |
- |
ALKÞSTAT3 |
-0.17 |
- |
|
|
|
STAT3ÞMYC |
-0.90 |
OPP |
|
|
|
Signal flow in the MYC network
We calculated pathway signal flows (PSF) through the MYC-network for RN and for IN versions separately to estimate the effect of altered interactions on selected biological functions as described in the methodical section. We considered five functional biological sink nodes, related to germinal center formation, plasma cell differentiation, cell survival, proliferation, and cell growth (Figure 1, Figure 6).
Figure 6. Gene network obtained from the data by implication analysis. Activating and repressive interactions of the genes to functional outputs are shown by blue links (In the signal analysis CCND3/CDK6 and CD79A/CD79B are considered as single nodes since they behave as complexes. The edges between them and the edge between TCF3/PI3K are given as supporting information).
The collection of metagene level signal results for RN and IN for the biological sink nodes are given in (Figure 7). The greatest differences between both networks are found for germinal center formation and survival signals for mBL subtype. Signal values for non-mBL subtype seem to stay almost unchanged between RN and IN except slightly increased plasma cell differentiation signal and slightly decreased proliferation and cell growth signals. On the other hand signals for intermediate cases seem to always decrease slightly from RN to IN.
In addition one finds that proliferation and cell growth signals show similar mean signal in RN and IN however the distribution is much narrower IN (Figure 7d,e). Another interesting effect is observed when we remove the survival repressing effect of MYC, which implies its apoptosis. This change is simulated by simply removing the MYC/Survival negative connection in the network (Figure 1). Surprisingly after applying this change we have the slightest change in the results – a slight increase in mBL subtype, a widening of distribution in intermediate subtype and a slight decrease in non-mBL subtype – that underlines the cooperative role of the genes on the sink signals. We conclude that changing a single edge sole is not sufficient to change the signal significantly in this regime (Figure 7c, f).
Figure 7. Boxplots of signals at the sinks germinal center formation, plasma cell differentiation, survival, proliferation and cell growth for lymphoma and implication network.
In this study we examined a gene regulation network composed of selected key genes of lymphoma biology directly related to MYC. We constructed a data driven network via Boolean implication analysis (IN) using gene expression data and compared it to a reference network (RN) that is constructed by using the literature knowledge. For network synthesis we used Boolean implications and we compared them to correlations. One of the fundamental advantages of Boolean implications is that implications have the ability to capture relations between genes that have poor correlation and consequently cover a greater range of possible relations between the genes. Another benefit of implications is the better contrast that they provide by classifying relations. The consequences of network-wirings are examined in terms of network activity using the signal flow approach, which assesses the signal propagation through the network towards functional sink nodes. The examined network is composed of 20genes and 5 functional outputs.
Sink-related alterations of network activity can be characterized as follows:
Germinal Center Formation
The germinal centers (GCs) are the main sites for antigen-driven somatic hypermutation (SHM) of the genes encoding the immunoglobulin variable region (IgV) and they hold clue regarding the immunological state of the cells. BCL6 and BCL2 are two of the actors of this process. The distribution of the reference and implication network signals at the sink node GCF is shown in Figure 7. Firstly it is clearly visible that there is a sharp increase in GCF signal of mBL subtype in IN compared to RN. On the other hand, for non-mBL and IML subtypes there is essentially no change between RN and IN. There are two crucial aspects to be discussed: the difference of the signals between subtypes and the difference of the signals between reference and implication networks. Regarding subtype differences with respect to GCF signals, mBL subtype is enriched in high expression zones of BCL6 and TCF3, which results in amplification of the GCF signal compared to intermediate and non-mBL subtype (Figure 4c,a, Figure 7a). For the second point, by comparing Figure 1 and Figure 6 it can be seen that the increase in GCF signal in IN compared to RN is particularly caused by absence of negative control of ID3 over TCF3. This fact is shown to be very common in BL and consistent with our results.
Plasma cell differentiation
Plasma cells (PCs) are one of the key players in adaptive immunity as final moderators of primary and secondary humoral response that are dedicated to supply soluble immunoglobulin (Ig). Molecular characteristics of plasma cells in comparison with B-cell (BC) characteristics are discussed extensively in the review by Kathryn L.Calame [42]. Before discussing plasma cell differentiation signal we should denote that in our restricted networks plasma cell differentiation signal is merely controlled by BLIMP1 gene that is not highly informative and that does not provide different results comparing different subtypes and RN and IN. Thus depending on the negative relation between MYC and BLIMP1 it is assumed that plasma cell differentiation signal is also directly and negatively regulated by MYC. This assumption implicitly incorporates BLIMP1 and BCL6 into the signal results by their control over MYC. It is seen in Figure 7b that IML and non-mBL subtypes have higher signal values than mBL in both RN and IN. On the other hand when we compare the signals between two networks it is seen that mBL and IML signals decrease while non-mBL signal increases from RN to IN. Lower signal for mBL subtype is basically due to the negative regulating effect of MYC over plasma differentiation signal (note that MYC is highly expressed in mBL subtype). On the other hand, the difference between RN and IN is due to the BCL6/MYC positive relation in IN as opposed to RN. So the state of MYC plays an important role for the outcome of this signal.
Survival
There are two crucial paths controlling the survival in BL designated by two genes: MYC and PI3K. Cell fate regarding survival is basically controlled by the cross-talk between MYC and PI3K/AKT/mTOR pathway i.e. pro-apoptotic properties of MYC is being counterbalanced by deliverance of survival signals via PI3K. The most prominent change in survival signal appears as a sharp increase for mBL subtype while there is a slight decrease for IML and almost no change for non-mBL (Figure 7c). This is caused by escape of TCF3 from the negative control of ID3 and its support on PI3K path to survival. The differences between the subtypes are caused by the differential expression of the genes of PI3K path. This is supported by the survival signal distribution when we remove the link between MYC and survival sink node to simulate the BL cases where MYC-mediated apoptosis is suppressed [43]. In this case the signal does not change significantly for any subtype, which emphasizes the prominence of PI3K path and also the cooperative activity on survival (Figure 7f).
Proliferation
Proliferation essentially involves the similar paths as in survival: ID3/TCF3 and PI3K/AKT/MTOR path regulated by BCR and PTEN [44], [45] (Figure 6). However additionally it incorporates another important effector CCND3, which pairs with CDK6. Considering the signal distributions in two networks there is no dramatic difference between the median values. However we observe another interesting property, in IN the signal distribution seems to be locked to a narrower region enabling a smaller variance in the signal. This is caused by removal of variance in the signal by the missing links PI3K/AKT/MTOR in IN. Regarding the subtype differences, the higher signal in IN for mBL signature is basically due to the positive relations between TCF3/ID3 and p16/CCND3 as opposed to RN (Figure 7). The signal difference between the subtypes is basically caused by the differential expression of mentioned key players; e.g. CCND3, TCF3.
Cell Growth
As it is the case for most of the sink nodes, MYC stands out as a critical component together with PI3K/AKT/mTOR regulation via PTEN in cell growth (Figure 7). In a broad biological sense MYC controls cell size and proliferation through amino acid/protein synthesis, lipid metabolism, protein turnover/folding, nucleotide/DNA synthesis, transport, nucleolus function/RNA binding, transcription and splicing, oxidative stress and signal transduction [46]. Additionally MYC regulates cell growth related metabolic pathways such as glucose and iron homeostasis [47]. Comparing subtype and network differences, cell growth signal has a similar profile to that of proliferation (decrease in the signal from mBL to non-mBL and loss in variance in IN), which is logical since cell growth is controlled by similar set of genes and in cells cell growth and proliferation is carefully orchestrated. The slight decrease in signal in IN is caused by the negative regulation of STAT3 on MYC in IN (Figure 6). The positive connection between MYC and STAT3 in RN is replaced by a negative one in IN and consequently the overall signal for all subtypes is decreased slightly depending on the expression of STAT3.
The biological/functional output of the gene networks are not only composed of the states of the genes but also composed of the wirings between them. Furthermore altered wirings in the network reflect the basic dysfunctional modes of the network. It is shown in our analysis using five biological outputs of a network and the change in their activity with respect to altered wirings (broken links, and wirings whose activity is reversed, i.e. from activating/repressive to repressive/activating). It is also shown that genes act cooperatively and it is possible that change in a single gene state is not enough to alter the macroscopic behavior of the network. Thus it is vital to incorporate the dynamics and topology of the network in modern -omics analysis.
Regarding lymphoma biology (in particular BL) the central hub behavior of MYC is supported by our analysis; the expression state of MYC and its wirings to surrounding key paths are responsible for changes in major biological responses like survival, proliferation and germinal center formation. Despite its major significance, it is discussed that to be effective the activity of MYC must be orchestrated by other pathways and key players (as shown in survival). In addition, the behavior of the system is not simply characterized by its activity level, there can be other effects like lost of variance in activity i.e. locking down of the activity to a tight interval (measured as signal in the respective sink node in our analysis of cell growth and proliferation).
Data
We analyzed a microarray data on mature aggressive B-cell lymphomas available under the GEO accession number GSE4475 [26]. In the study authors used Affymetrix HG-U133A microarrays to assess biopsy specimens from 220 patients by assessing the expression level of 22,283 gene-related probesets are. A transcriptional signature is defined by Hummel et al. to distinguish the subtypes molecular Burkitt’s lymphoma (mBL) and non–molecular Burkitt’s lymphoma (non-mBL) [26]. In the data set 44 cases are assigned to the mBL, 128 are assigned to the non-mBL signature and 48 cases could not be assigned unambiguously to one of the two groups and flagged as intermediate [26], [48]–[51].
Preprocessing
Raw probe intensity values collected from each of the 221 arrays are calibrated and summarized by hook method into expression values in logarithmic scale and subsequently quantile normalized [52], [53]. The expression data is represented as numerical matrix of dimension N×M such that rows of the matrix, e_(i,j) with i=const, will be termed ‘expression profile’ of the respective gene i while columns, e_(i,j) with j=const will be termed ‘states’ referring to sample j under consideration.
SOM analysis
Machine learning using self-organizing maps (SOMs) is applied to the expression data to cluster genes of similar profiles on so-called metagene and spot levels. We used SOM portraying method that visualizes the expression state of each sample by a color-coded two-dimensional map of 50x50 pixels, called metagenes according to their expression values in the respective sample. Spot modules were defined as clusters of neighboring over- (red) or under- (blue) expressed metagenes as described in [41]. Each spot represents an expression mode of a group of metagenes showing concerted expression.
The SOM pipeline is publicly available as R-package ‘oposSOM’ on Bioconductor (http://www.bioconductor.org/packages/release/bioc/html/oposSOM.html).
Boolean implication and correlation analysis
Boolean implication analysis method transfers genes’ expression profiles into binary data space according to their high and low expression values by applying to each gene’s expression a threshold. It then identifies logical implications between pairwise combinations of these dichotomized values. Details of the method and of its application to SOM data are presented in the previous publication [15]. Originally the algorithm to identify Boolean relations for gene expression is proposed by Sahoo et al. [54]. Detection of Boolean implications between pairs of gene clusters, i.e. metagenes and spot modules, is performed similarly as described for the genes using expression profiles of metagenes or spot modules instead of those of single genes [15]. Identified implications correspond either of the six Boolean implication classes, High-High (HH), Low-Low (LL), High-Low (HL), Low-High (LH), Equivalent (EQV) and Opposite (OPP).
In correlation analysis, Pearson correlation coefficients for all probe expression couples are calculated and represented as a hierarchically clustered heatmap in comparison with the corresponding implication heatmap. Implication analysis provides six different type of relation classes where three correspond to positive (HH, LL, and EQV) and negative (HL, LH and OPP) correlations each.
If a gene is not located within any spot, we use the profiles of the closest spot in the map for spot level correlation and implication analysis. For the genes with multiple probesets the best scoring correlation and implication is taken into account.Generating implication networks from reference networks
Starting with an interaction network as shown in Figure 1, first, a graph object is created from this network using the R package igraph with nodes representing either genes or functional outputs (Plasma cell differentiation, survival, proliferation, germinal center formation, cell growth), and edges representing relations between nodes [55]. The network was taken from literature and referred to as ‘reference’ network [23]–[25]. Then the relations between the nodes in the reference network were compared with the Boolean implications extracted from the data. Implication types HL, LH, OPP in the Boolean implication network are considered as inhibitory interaction while implication types HH, LL and EQV are considered as activating interaction. Then, a modified ‘implication’ network is generated from the reference network by applying the following rule: if an implication differs from the interaction rule then the latter one is corrected accordingly.
Three different implication networks are created by using gene-level, metagene-level and spot-level data, respectively. Finally, gene expression values are assigned to nodes occupied by the respective genes/metagenes/spots. In case of multiple microarray probes covering the same gene, average expression value of the probes is used.
The Pathway Signal Flow (PSF) algorithm evaluates how a signal from inputs of a network spreads downstream from source nodes to sink nodes considering the interactions between the nodes [56]. The more changes in the pathway flow are observed, the more it is likely that the given pathway will be involved in biological processes underlying phenotypic differences between the studied conditions.
Calculation of PSF starts with topological sorting of pathway graphs for identification of source (input) and sink (output) nodes. Feedback loop are sorted partially. Then an initial unity signal is applied to the pathway source nodes. The signal flow at the outgoing edge is set equal to the product of input signal and relative expression of source node,

where  is relative expression of node
  ;
;  is signal flow at the incoming edges of the node and k assigns the type of interaction with
  if node
  activates node and if node inhibits node .
If a node has two or more inputs, its relative expression is partitioned based on the value of input signals and then is summarized, i.e. if node has a set of inputs I than the outgoing signal from this node will be
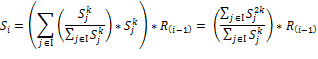
Signal flow at the sink nodes of a pathway is considered as pathway signal flow (Figure PSF) (Figure 8).
Figure 8. Schematic representation of PSF algorithm workflow on hypothetic pathway graph. Mapping of relative expressions R_i on to the pathway nodes and calculation of pathway signal flow for the outcome of the network. Green arrows stands for activation relations and red lines with round ends stands for inhibition relations respectively. S_i ,i=1,2,…6 represents the signal flows at corresponding nodes.
Significance of pathway flow perturbation is estimated by bootstrapping using 1000 iterations for calculating node’s relative expressions. PSF of multi-branched links to pathway sinks are averaged and significance is calculated as log-average of the single sink significances.
Authors declare no competing interest.
This work is supported by the Federal Ministry of Education and Research (BMBF), project grant No. FKZ 031 6166 (MMML-MYC-SYS), No. FFE-0034 (oBIG) and WTZ ARM II-010 (PathwayMaps).
- Hartwell LH, Hopfield JJ, Leibler S, Murray AW (1999) From molecular to modular cell biology. Nature 402: C47-C52. [Crossref]
- Kitano H (2002) Systems biology: a brief overview. Science 295: 1662-1664. [Crossref]
- Oltvai ZN, Barabási AL (2002) Systems biology. Life's complexity pyramid. Science 298: 763-764. [Crossref]
- Barabási AL, Oltvai ZN (2004) Network biology: understanding the cell's functional organization. Nat Rev Genet 5: 101-113. [Crossref]
- Buchler NE, Gerland U, Hwa T (2003) On schemes of combinatorial transcription logic. Proc Natl Acad Sci U S A 100: 5136-5141. [Crossref]
- Tyson JJ, Chen KC, Novak B (2003) Sniffers, buzzers, toggles and blinkers: dynamics of regulatory and signaling pathways in the cell. Curr Opin Cell Biol 15: 221-231. [Crossref]
- Cao J, Qi X, and Zhao H. (2012) Modeling Gene Regulation Networks Using Ordinary Differential Equations, in Next Generation Microarray Bioinformatics: Methods and Protocols, Methods Mol Biol 802: 185-197. [Crossref]
- Wynn ML, Consul N, Merajver SD, Schnell S (2012) Logic-based models in systems biology: a predictive and parameter-free network analysis method. Integr Biol (Camb) 4: 1323-1337. [Crossref]
- Kauffman SA. (1969) Metabolic stability and epigenesis in randomly constructed genetic nets, J. Theor. Biol., 22: 437–467. [Crossref]
- Glass L and Kauffman SA. (1973) The logical analysis of continuous, non-linear biochemical control networks, J. Theor. Biol., 39: 103–129. [Crossref]
- Kauffman SA. (1973) Control Circuits for Determination and Transdetermination, Science (80-. ) 181:310-318. [Crossref]
- Kauffman S (1974) The large scale structure and dynamics of gene control circuits: an ensemble approach. J Theor Biol 44: 167-190. [Crossref]
- Le Novère N (2015) Quantitative and logic modelling of molecular and gene networks. Nat Rev Genet 16: 146-158. [Crossref]
- Sahoo D, Dill DL, Gentles AJ, Tibshirani R, and Plevritis SK. (2008) Boolean implication networks derived from large scale, whole genome microarray datasets., Genome Biol. 9: R157. [Crossref]
- Çakir MV, Binder H, and Wirth H. (2014) Profiling of genetic switches using boolean implications in expression data., J. Integr. Bioinform., 11: 246.
- Alon U, Barkai N, Notterman DA, Gish K, Ybarra S, Mack D, and Levine AJ. (1999) Broad patterns of gene expression revealed by clustering analysis of tumor and normal colon tissues probed by oligonucleotide arrays, Proc. Natl. Acad. Sci. U. S. A., 96: 6745–6750. [Crossref]
- Golub TR, Slonim DK, Tamayo P, Huard C, Gaasenbeek M, Mesirov JP, Coller H, Loh ML, Downing JR, Caligiuri MA, Bloomfield CD, and Lander ES. (1999) Molecular Classification of Cancer: Class Discovery and Class Prediction by Gene Expression Monitoring, Science. 286: 531-537.
- Dumur CI, Dechsukhum C, Ware JL, Cofield SS, Best AM et.al. (2003) Genome-wide detection of LOH in prostate cancer using human SNP microarray technology, Genomics, 81:260–269. [Crossref]
- Parker JS, Mullins M, Cheang MCU, Leung S, Voduc D et.al. (2009) Supervised Risk Predictor of Breast Cancer Based on Intrinsic Subtypes, J. Clin. Oncol., 27:1160–1167. [Crossref]
- Turcan S, Rohle D, Goenka A, Walsh LA, Fang F et.al. (2012) IDH1 mutation is sufficient to establish the glioma hypermethylator phenotype, Nature, 483:479–483. [Crossref]
- Hu Y, Chen HY, Yu CY, Xu J, Wang JL, et al. (2014) A long non-coding RNA signature to improve prognosis prediction of colorectal cancer. Oncotarget 5: 2230-2242. [Crossref]
- Sparano JA, Gray RJ, Makower DF, Pritchard KI, Albain KS. et.al. (2015) Prospective Validation of a 21-Gene Expression Assay in Breast Cancer, N. Engl. J. Med., 373: 2005–2014. [Crossref]
- Schmitz R, Young RM, Ceribelli M, Jhavar S, Xiao W, Zhang M, et.al. (2012) Burkitt lymphoma pathogenesis and therapeutic targets from structural and functional genomics., Nature, 490:116–20. [Crossref]
- Ott G1, Rosenwald A, Campo E (2013) Understanding MYC-driven aggressive B-cell lymphomas: pathogenesis and classification. Hematology Am Soc Hematol Educ Program 2013: 575-583. [Crossref]
- Campo E1 (2012) New pathogenic mechanisms in Burkitt lymphoma. Nat Genet 44: 1288-1289. [Crossref]
- Hummel M, Bentink S, Berger H, Klapper W, Wessendorf S, Barth TFE, et.al. (2006) A biologic definition of Burkitt’s lymphoma from transcriptional and genomic profiling., N. Engl. J. Med., 354: 2419–30. [Crossref]
- Li Z, Van Calcar S, Qu C, Cavenee WK, Zhang MQ, et al. (2003) A global transcriptional regulatory role for c-Myc in Burkitt's lymphoma cells. Proc Natl Acad Sci U S A 100: 8164-8169. [Crossref]
- Fernandez PC, Frank SR, Wang L, Schroeder M, Liu S, et al. (2003) Genomic targets of the human c-Myc protein. Genes Dev 17: 1115-1129. [Crossref]
- Boxer LM, Dang CV (2001) Translocations involving c-myc and c-myc function. Oncogene 20: 5595-5610. [Crossref]
- Miller DM, Thomas SD, Islam A, Muench D, Sedoris K (2012) c-Myc and cancer metabolism. Clin Cancer Res 18: 5546-5553. [Crossref]
- Wolfer A, Ramaswamy S (2011) MYC and metastasis. Cancer Res 71: 2034-2037. [Crossref]
- Bretones G, Delgado MD1, León J2 (2015) Myc and cell cycle control. Biochim Biophys Acta 1849: 506-516. [Crossref]
- Sheen JH, Dickson RB, Gossen M. et.al. (2004) c-Myc in Cellular Transformation and Cancer, in Transcription Factors, Springer-Verlag Berlin Heidelberg, 166: 309–323.
- Dang CV, O'Donnell KA, Zeller KI, Nguyen T, Osthus RC, et al. (2006) The c-Myc target gene network. Semin Cancer Biol 16: 253-264. [Crossref]
- Baudino TA, McKay C, Pendeville-Samain H, Nilsson JA, Maclean KH et.al. (2002) c-Myc is essential for vasculogenesis and angiogenesis during development and tumor progression, Genes Dev., 16:2530–2543. [Crossref]
- Liu H, Radisky DC, Yang D, Xu R, Radisky ES, Bissell MJ et.al. (2012) MYC suppresses cancer metastasis by direct transcriptional silencing of [alpha]v and [beta]3 integrin subunits, Nat Cell Biol, 14:567–574. [Crossref]
- Vafa O, Wade M, Kern S, Beeche M, Pandita TK et.al. (2002) G. M. Hampton, and G. M. Wahl. c-Myc Can Induce DNA Damage, Increase Reactive Oxygen Species, and Mitigate p53 Function: A Mechanism for Oncogene-Induced Genetic Instability, Mol. Cell, 9:1031–1044. [Crossref]
- Chang TC, Yu D, Lee YS, Wentzel EA et.al., (2008) Widespread microRNA repression by Myc contributes to tumorigenesis, Nat Genet, 40:43–50. [Crossref]
- O'Donnell KA, Wentzel EA, Zeller KI, Dang CV, Mendell JT (2005) c-Myc-regulated microRNAs modulate E2F1 expression. Nature 435: 839-843. [Crossref]
- Love C, Sun Z, Jima D, Li G et.al. (2012) The genetic landscape of mutations in Burkitt lymphoma, Nat. Genet., 44: 1321–1325. [Crossref]
- Wirth H, von Bergen M, and H. Binder. (2012) Mining SOM expression portraits: feature selection and integrating concepts of molecular function., BioData Min., 5:18. [Crossref]
- Calame KL. (2001) Plasma cells: finding new light at the end of B cell development, Nat Immunol, 2:1103–1108. [Crossref]
- Kuttler F, Amé P, Clark H, Haughey C, Mougin C, Cahn JY et.al. c-myc box II mutations in Burkitt’s lymphoma-derived alleles reduce cell-transformation activity and lower response to broad apoptotic stimuli., Oncogene, 20:6084–6094. [Crossref]
- Curnock AP and Knox KA. (1998) LY294002-Mediated Inhibition of Phosphatidylinositol 3-Kinase Activity Triggers Growth Inhibition and Apoptosis in CD40-Triggered Ramos–Burkitt Lymphoma B Cells, Cell. Immunol., 187: 77–87. [Crossref]
- Spender LC and Inman GJ. Phosphoinositide 3-kinase/AKT/mTORC1/2 Signaling Determines Sensitivity of Burkitt’s Lymphoma Cells to BH3 mimetics, Mol. Cancer Res. , 10:347–359. [Crossref]
- Schuhmacher M, Kohlhuber F, Hölzel M, Kaiser C, et.al. (2001) The transcriptional program of a human B cell line in response to Myc, Nucleic Acids Res., 29: 397–406. [Crossref]
- Adhikary S, Eilers M (2005) Transcriptional regulation and transformation by Myc proteins. Nat Rev Mol Cell Biol 6: 635-645. [Crossref]
- Wirth H, Loffler M, von Bergen M, and H. Binder. Expression cartography of human tissues using self organizing maps, BMC Bioinformatics, 12:306, 2011. [Crossref]
- Hopp L, Wirth H, Fasold M, and Binder H. (2013) Portraying the expression landscapes of cancer subtypes: a glioblastoma multiforme and prostate cancer case study., Syst. Biomed.1:99-121.
- Binder H, Fasold M, Hopp L, Cakir V, von Bergen M, and H. Wirth. (2011) Portraiting high-dimensional OMICs data with individual resolution, CAMDA 2011 Proc.
- Binder H, Hopp L, Cakir V, Fasold M, von Bergen M, and Wirth H. (2011) Molecular phenotypic portraits - Exploring the ‘OMES’ with individual resolution, in Health Informatics and Bioinformatics (HIBIT), 6th International Symposium 99–107.
- Binder H and Preibisch S. (2008) “Hook”-calibration of GeneChip-microarrays: theory and algorithm., Algorithms Mol. Biol., 3:12.
- Binder H, Krohn K, Preibisch S (2008) "Hook"-calibration of GeneChip-microarrays: chip characteristics and expression measures. Algorithms Mol Biol 3: 11. [Crossref]
- Sahoo D, Dill DL, Gentles AJ, Tibshirani R, and Plevritis SK. (2008) Boolean implication networks derived from large scale, whole genome microarray datasets., Genome Biol., 9: R157. [Crossref]
- Csardi G and Nepusz T. (2006) The igraph Software Package for Complex Network Research, Inter Journal Complex Systems, 1695.
- Isik Z, Ersahin T, Atalay V, Aykanat C, and Cetin-Atalay R. (2012) A signal transduction score flow algorithm for cyclic cellular pathway analysis, which combines transcriptome and ChIP-seq data., Mol. Biosyst., 8:3224–3231. [Crossref]