Electrical impedance spectroscopy (EIS) is a type of non-invasive and cost-effective technique used for bio-impedance evaluation. The EIS method can assist the clinical diagnosis of breast cancer in its early stages. This paper will present two innovative instruments’ setups for early detection of breast cancer. These devices, the EIS-Probe and the EIS-Hand-Breast (EIS-HB), were used to measure the bio-impedance of 10 subjects who have been diagnosed with breast cancer. The aim of this study was to prove that the use of these devices as an adjunct method, in conjunction with a mammogram can increase the chance of cancer detection in its early stages. In addition, improved derivations of the Cole-Cole features from the computed bio-impedance data, has major importance in determining the physiological or pathological condition of in-vivo tissue. Thus, the gathered information is then analyzed by the least square method (LSM), and least absolute deviation (LAD) method. Complementary simulation is performed to identify the sensitivity of the probes under realistic clinical circumstances. The proposed EIS-Probe and EIS-HB method expose promising validity in comparison to other breast cancer detection tools.
breast cancer detection, electrical impedance spectroscopy, cole-cole model, least square method, least absolute deviation
Cancers are caused by serial mutations that occur due to genetic instability and/or environmental factors [1,2]. The uncontrollable production of breast cells in the body is known as breast cancer [3]. In 2015, more than 25,000 people were expected to suffer from breast cancer in Canada. This represented 26% of all new cancer cases in women in the same year. Although breast cancer-related deaths have been decreasing since the 1980s, because of the novel screening tools and developments in treatments [4], it was known as the second leading cause of women’s cancer-induced death in 2015 [5]. Therefore, there is a growing demand for cost-effective, accurate and easy-to-use devices which can assist healthcare professionals detect breast cancer in its early stages. Through all the available breast screening methods, the clinical breast exam (CBE) and mammography are the two most extensively applied techniques [6]. X-ray mammography has been the main screening method which has the highest compliance with the standard of breast cancer screening at the present time. However, it has a high false negative ratio which varies from 4% to 34% [7]. Mammography can also cause cancer growth due to the ionizing X-ray [7,8].
Multi-frequency electrical impedance spectroscopy (EIS) is one of the medical strategies used to identify cancer in its early stages. This technique is based on evaluating the conductivity of body tissue. The EIS method functions by distinguishing the differences in the electrical impedance of the tissue. Measuring the tissues’ impedances helps us to compute the differences in the electrical impedances of various tissues. The body impedance is calculated at 50 sample frequencies from 300Hz to 1MHz. It is expected that the current will pass through extracellular water (ECW) at low frequencies, due to the conducting properties of tissue interfaces and cell walls. As there is no capacitance trace at higher frequencies, the current will go through all the material. Both ECW and intracellular water (ICW) can be determined by using the EIS method [9].
In this paper, the authors present the non-invasive and low-cost instrumentations of EIS (EIS-Probe and EIS-HB method) to distinguish cancerous breast tissues from the healthy ones in the early stages of breast cancer and will assess the devices’ levels of sensitivity. The characteristics, methods and results of the devices will be explained in the following sections. This experiment expands upon previous studies done by Grewal and Moghadam [10-12]. As the devices are already tested on healthy subjects, this phase of the study focuses on patients with breast cancer. The clinical procedure and its results are fully explained in this paper.
In this study, we used the same methodology as our previous studies performed on skin cancer by Grewal and Moghadam [10,11]. The promising results of this technique on skin cancer impelled us to investigate the probe sensitivity on subjects who have been known to have breast cancer too. This study was accomplished on cancerous breast tissues and their contralateral healthy sites. This collaborative research was done with Fraser Health Authority and Jim Pattison Outpatient Care and Surgery Centre (JPOCSC). The Fraser Health Research Ethics Board’s study number and the Simon Fraser University Ethic Board’s study number of this clinical experiment are FHREB2014-065 and 2015s0156, respectively. The principals of this study were Dr. Farid Golnaraghi (Simon Fraser University) and Dr. Rhonda Janzen (JPOCSC). Our devices have the Class II investigational testing authorization of the Health Canada.
Theory
In this research, all data was gathered in the limited frequency range of 300Hz to 1MHz. Thus, the living tissue’s admittance of the EIS method is defined by the following Eq. 1 [13].
|
|
Eq. 1
|
where Y is the admittance of tissue. Therefore, G and B are conductance and susceptance of tissue, respectively. G0 is the admittance of the lowest frequency (f0); G∞ is the admittance of the highest frequency (f∞). In equation 1, fyc is the peak frequency of the Cole-Cole arc. The deriving frequency and dispersion parameters are shown by f and α, respectively [13,14]. By plotting B (susceptance of the tissue) versus G (conductance of the tissue), a circular arc is obtained as depicted in figure 1.
Figure 1. Cole-Cole model circular arc
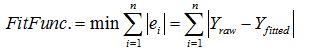
As proposed by Yang et al. in 2008, one of the well-established data fitting techniques is the least absolute deviation (LAD). This optimization method reduces each fitted data from the data points and minimizes the sum of all these amounts to determine the best-fitted data set by the following Eq. 2 [15]:
|
|
Eq. 2
|
When the best set of fitted data is established, the four parameters of the Cole-Cole model, G0, G∞, α and fyc are derived.
Liu et al. presented another curve-fitting method to extract the four Cole-Cole parameters, which is the least square method (LSM) [13]. By using the LSM method, we can find the best set of fitted values, due to the various techniques of weighting the error function [16] (Figure 2).
Figure 2. The Cole-Cole model circuit
As figure 2 depicts, the Cole-Cole model is built based on an intracellular resistance in series with a membrane capacitance which both are parallel with an extracellular resistance. In this model, α = 1 means that the membrane capacitance is ideal and the former plot will be a complete semi-circle in the positive section of the complex plane. Whenever α is not equal to 1, a circular arc with its center is below the real axis is gained. Three main Cole-Cole parameters are computed as it is demonstrated in Eq. 3
|
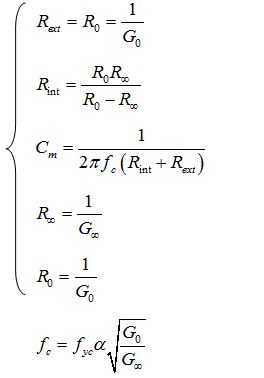
|
Eq. 3
|
The aim of this study is to compare the level of sensitivity between the EIS-Probe and the EIS-HB technique while using two different fitting methods (the LAD and the LSM error functions) (Figure 3).
Figure 3. Photograph of the instrument setup (EIS-Probe)
Instrument setups
In this study, two different electrical impedance setups have been utilized for assessing electrical properties of the living tissue. The first setup, the EIS-HB device, includes two pre-gelled sensing electrodes from Covidien (conductive adhesive hydrogel), impedance spectroscope HF2IS and trans-impedance amplifier HF2TA (TA), both made by Zurich Instruments. In the range of 1µHz to 50 MHz, the HF2IS affords two outputs (high-frequency outputs) regarding the linear mixture of up to eight sinusoidal. The sampling rate of HF2IS is 210 M sample/s. The multi-frequency mapping is acquired by using frequency sweep. The complex conductivity and permittivity can be captured as a result of the frequency sweep. This device is able to evaluate multiple frequencies and has great sensitivity and accurate impedance measurement. The four features of accurate phase shift, high dynamic reserve, zero drift and orthogonality make this device a good choice over the other valid analog devices. The frequency response can also be derived from noisy and low voltage sets by using this setup.
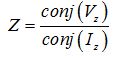
The common methods to measure the electrical properties of biological tissue are two-point and four-point measurement techniques. In this study, the two-point measurement method is used to extract impedances of breast tissues. The output signal of 1 volt amplitude (Vz) is generated by the HF2IS. In this setup, one of the electrodes (reference electrode) is fastened to the HF2IS output and located on the palm of patient while the other one (measuring electrode) is connected to the HF2IS input and adhered to the patient’s breast. The Cole-Cole model is used to define the characterization of the tissue by assessing the output signal via the measuring electrode which is in contact with the tissue. The reference electrode employs the impedance spectroscope's input voltage (1 volt) to the tissue. For achieving the impedance spectrum of the tissue in the range of 300Hz – 1MHz, the input voltage has been swept in this range. Iz is the current flow through the tissue which is measured by the measuring electrode. By having both Vz and Iz, the impedance spectrum can be achieved by the following formula:
|

|
Eq. 4
|
The conductive pectoral muscle is deemed as an iso-potential panel [17]. The current (Iz) passes through the patient’s palm to arm and reaches the pectoral muscle. Thus, by attaching the measuring electrode over the breast, the incoming current (Iz) can be sensed. Cancerous and healthy breasts do not have the same functions. The complex impedance formula is computed as below:
|
|
Eq. 5
|
The magnitude and phase of tissue’s electrical impedance are evaluated by the device to use them for illustrating the tissue’s impedance. MATLAB software is brought up as a receiver of data from the microcontroller and the HF2IS.
The second setup (EIS-Probe) hardware design is close to the first one, but its electrodes and their location of installation are different. In this device, two E206 Ag/AgCl Electrode Pellets (2.0mm electrodes) are used as the reference and measuring electrodes. Figure 3 presents a photograph of the probe. The reference and measuring electrodes separation on this probe is 3 cm. For measuring the electrical impedance of the breast, the reference electrode applies sinusoidal wave with one volt amplitude to the breast tissue and the measuring electrode (3 cm away from the reference electrode) captures the current (Iz) which is passing through the breast tissue. The frequency of the input voltage is swapping from 300Hz to 1 MHz. Before starting each test, the Spectra 360 electrode gel is applied to the reference and measuring electrodes as a connector between the electrodes and skin to reduce the effect of connection impedance between them.
Test procedure and patient information
The patients were asked to lie down in the supine position and be relaxed. The skin of the tests’ locations was cleaned using alcohol prep pads. For the first probe, the pre-gelled electrodes were installed on the surface of the breast and then the data was gathered by the technician. For the second setup (EIS-Probe), the conductive gel was placed on the EIS electrodes of the probe before being used. A constant pressure, similar to ultrasound tests was applied by the technician on each breast. To prevent measurement errors, each test was repeated between three to five times. The same procedure was also done on the healthy contralateral sites of each patient for comparison purposes.
Figure 4 illustrates the tumors’ locations of the patients (subject number 2 to 10) who voluntarily took part in the experiment. All of patients consented before taking part in this research.
Figure 4. The location of each patient's tumor who took part in the experiment
Table 1 shows the patients’ information who voluntarily took part in the experiment. The data of patient number one could not be used in this experiment due to her oversized breasts and various past biopsy experiences.
Table 1. The information of 10 patients who took part in the experiment
Patients |
Tumor Position |
Tumor Type |
Tumor Size |
Age |
Sex |
1 |
Inconclusive |
Inconclusive |
Inconclusive |
53 |
Female |
2 |
Left Breast, 3-4 O’clock |
Lobulated mass |
2.2*1.7*1.7 cm |
62 |
Female |
3 |
Left Breast, 1 O’clock |
Ductal carcinoma |
- |
84 |
Female |
4 |
Right Breast, 9 O’clock |
Mammary carcinoma |
7 mm |
79 |
Female |
5 |
Left Breast, 2 O’clock |
BIRADS |
2.5*1.7*3.5 cm |
44 |
Female |
6 |
Right Breast, 1’ O’clock |
Solid mass |
2.4 cm |
42 |
Female |
7 |
Right Breast, 10-11 O’clock |
BI-RADS 4C |
23*22*15 mm |
59 |
Female |
8 |
Left Breast, 12 O’clock |
Lobulated lesion |
1.6 cm in maximal dim. |
56 |
Female |
9 |
Left Breast, 2-3 O’clock |
Solid lesion |
11*7*5 mm |
63 |
Female |
10 |
Left Breast, 5 O’clock |
Invasive ductal carcinoma |
1.7*1.2*2.4 cm |
53 |
Female |
The study has been done using the LAD and the LSM methods for the feature extraction from the collected data. The approaches’ results are completely explained in the following section.
In this study, each device’s data are analyzed by two error functions: LAD and LSM. The error-functions are studied to extract the Cole-Cole parameters and based on these parameters we define the sensitivity of the EIS-Probe and the EIS-HB method for the in-vivo experiment on cancerous subjects.
In figure 5, the calculated conductance of each subject is plotted versus its susceptance for both the EIS-HB method and the EIS-Probe.
Figure 5. The Nyquist plots of cancerous and healthy sites for 9 patients a) using EIS-HB method b) using EIS Probe
2021 Copyright OAT. All rights reserv
Plots of the EIS-HB method and the EIS-Probe, using two kinds of evaluating methods for each of them, are provided in this section, as well. For the two setups, we plotted the bar charts of Rint, Rext and Cm (three elements of the Cole-Cole circuit) which were extracted from the multi-frequency measured data using the LAD and the LSM evaluation methods. These data are reconstructed by using fifty samples of frequency in the range of 300Hz-1MHz for each patient.
EIS-HB/LAD technique
The x-axis of the Figure 6 to Figure 9 denote the patient number and the y-axis denote ratios of the cancerous tissues’ Cole-Cole parameters (Rin, Rext and Cm) per the healthy tissues’ Cole-Cole parameters of each subject. The tests were tried three to five times depending on each person to prevent further errors.
Figure 6. Rin, Rext and Cm bar graphs for 9 patients using EIS-HB method and LAD error function
Figure 7. Rin, Rext and Cm bar graphs for 9 patients using EIS-HB method and LSM error function
Figure 8. Rin, Rext and Cm bar graphs for 9 patients using EIS-Probe and LAD error function
Figure 9. Rin, Rext and Cm bar graphs for 9 patients using EIS-Probe and LSM error function
The ratio of cancerous internal resistances, external resistances and membrane capacitances to the healthy internal resistances, external resistances and membrane capacitances, respectively, are shown in the Figure 6. This figure demonstrates the data of EIS-HB device that had been analyzed based on the LAD error function.
Figure 6 shows that on seven subjects (patients #1, #4, #5, #6, #7, #8 and #10) healthy tissues have higher internal resistances in comparison to the cancerous tissues while this number decreases to five subjects for the external resistances.
The cancerous sites’ membrane capacitances of seven subjects are higher than their healthy sites’ membrane capacitances.
EIS-HB/LSM technique
The Rin, Rext and Cm of cancerous breasts divided by their healthy breasts’ values for all patients are demonstrated in figure 7; the comparison has been done over nine patients by using the EIS-HB method and the LSM evaluation technique.
The trend of Rin was consistent for seven patients out of nine (healthy>cancerous). The healthy sites’ external resistances (Rext) of 5 patients are also higher than their cancerous sites’ external resistances. In addition, the cancerous membrane capacitances in seven patients are lower than their healthy sites’ membrane capacitances.
EIS-probe/LAD technique
The bar charts of the first device show the existence of tumors and consistent trend over the Cole-Cole parameters. For better feature extraction and easier test procedure, we used the EIS-Probe to capture three Cole-Cole circuit elements (Rin, Rext and Cm). Figure 8 depicts the cancerous intracellular resistances, extracellular resistances and membrane capacitances per the healthy ones of the previous patients, which were evaluated by the LAD method over the same frequency range (300Hz-1MHz).
The cancerous sites’ Rin of seven patients are lower than their Rin of contralateral healthy sites. The Rext and Cm follow the same trend for six patients and five patients (out of nine in total), respectively.
EIS-probe/LSM technique
Figure 6 shows the ratios of cancerous breasts’ Cole-Cole parameters per healthy breasts’ Rin, Rext and Cm of 9 patients (evaluated by the LSM). Through the in-vivo experiment, the results of the LSM have been promising and have a great consistency over the same patients. In the last part of the experiment, we present the results of tests in a manner identical to the previous test procedure. In this case, Rin, Rext and Cm (cancerous sites/healthy sites) are extracted by the LSM and they are demonstrated in figure 9.
The Rin of the cancerous sites are lower in value in comparison to its contralateral healthy sites for eight subjects. The Cm shows the same trend as Rint for seven subjects (patient number 2 to 8). However, the Rext of six patients’ cancerous sites are higher than their healthy contralateral sites.
In this paper we utilized EIS probes to measure the electrical impedance properties of human subject breast tissues. The probes, by using integrated software, have been successfully used on a group of cancerous patients to characterize tissue properties.
Overall, using setups, the EIS-Probe and the EIS-HB method, in conjunction with the LSM error function increases the chance of cancer detection. As figure 6 to figure 9 demonstrate there are notable differences between cancerous breasts data and their contralateral sites.
In this experiment, the membrane capacitances of cancerous breasts are lower than healthy breasts. Both devices show the same trend and have a sensitivity of 77.8%, which is a high percentage of sensitivity in comparison to the current valid cancer detection techniques.
The intracellular resistances are higher in values for healthy breasts, which is in line with the literature [18]. The EIS-HB device follows this trend with a sensitivity of 77.8%, while the EIS-probe has higher sensitivity than the first setup (88.9%).
The sensitivity of the extracellular resistance is 66.7% and 55.6% for the EIS-Probe and the EIS-HB method, respectively. The extracellular resistances have higher values in cancerous tissues when using the EIS-Probe. In contrast, the values of extracellular resistances are lower in cancerous tissues when using the EIS-HB method.
Hence, the membrane capacitance and intracellular resistance are the most reliable features among all three Cole-Cole parameters (while using the EIS-Probe or the EIS-HB method with the LSM). Their consistent trend and high sensitivity make them viable options for cancer diagnosis in this study. In addition, the two developed setups can be used as adjunct devices in conjunction with mammograms and ultrasound to increase the chance of cancer detection in its early stages.
The total performances of both devices decreased when their data was analyzed by the LAD method. The sensitivity of the EIS probe for Cm, Rext and Rin were 55.6%, 66.7% and 77.8%, respectively. By using the LAD error function, the EIS-HB setup depicts an overall higher sensitivity than the EIS-Probe. In this case, the membrane capacitance and the intracellular resistance have the same sensitivity of 77.8%, while the extracellular resistance has a lower sensitivity (55.6%). Although the results of the LAD method were not quite satisfying, the Cole-Cole parameters follow the same trend from cancerous breasts to healthy ones in both of the devices.
The setups (The EIS-Probe and the EIS-HB method) have higher sensitivity, while using the LSM error function to extract their three main Cole-Cole features. Thus, it is highly recommended to use the LSM function for evaluating the bio-impedance of the breast’s tissue.
The EIS-probe needs to be improved in further studies. The issue is that the EIS-Probe is pressure-sensitive. This issue is not a valid problem for the EIS-HB method as the electrodes stick to the surface of the breast, and therefore, no human contact is involved in the data collection process. However, the EIS-Probe requires constant pressure to be applied during the test, which leaves room for human error. By attaching a suitable pressure indicator on the handle of the EIS-Probe, we can overcome this matter.
The EIS-Probe and the EIS-HB method are proposed to be inexpensive and non-invasive screening devices, which can detect the malignant tissue. The overall goals were to ensure early diagnosis, easier prognosis and lower death rates.
The performance of the EIS-Probe and the EIS-HB method had been verified by testing the devices on healthy subjects. Therefore, the next phase of the study was to test the devices on cancerous patients. In the current experiment, the electrical impedances of breasts are used to extract their electrical properties (Cole-Cole parameters). The test has been done on ten patients who were diagnosed with breast cancer; however the data of patient number 1 was unreliable due to the patient’s large breasts and multiple past biopsy experiences.
As the data illustrates, the EIS-Probe and the EIS-HB method performed their best when their data was analyzed by using the LSM error function. Using the LAD technique to examine the collected data was not as successful as the LSM in detecting malignant breasts from their contralateral sites.
In conclusion, The LSM error function is our choice for future experiments due to its higher sensitivity. The EIS-Probe and the EIS-HB method are capable of assessing the tissue’s electrical properties including its intracellular resistance, extracellular resistance and membrane capacitance. In addition, they are able to detect cancerous tissues from healthy ones by determining the changes of these parameters of the tissue. To develop the setups, an automated classifier is needed to classify malignant and healthy tissues without human interaction.
The EIS-Probe and the EIS-HB method can be used as adjunct tools for mammograms and ultrasound to detect various kinds of breast cancer in their early stages. As it was shown, these techniques are applicable to the clinical environment and are ready to be tested over a larger population of cancerous patients.
The authors are thankful to all the participants in this research. The authors wish to thank Jana Park of the Jim Pattison Clinic, Sara O’Shaughnessy, Susan Chunick and Parveen Sangha of the Fraser Health for their kind assistance. Financial support for this project was provided in-part by the Natural Sciences and Engineering Research Council of Canada (NSERC).
- Aubele M, Werner M (1999) Heterogeneity in breast cancer and the problem of relevance of findings. Anal Cell Pathol 19: 53-58. [Crossref]
- Ryu H, Lee J, Olofsson BA, Mwidau A, Dedeoglu A, et al. (2003) Histone deacetylase inhibitors prevent oxidative neuronal death independent of expanded polyglutamine repeats via an Sp1-dependent pathway. Proc Natl Acad Sci U S A 100: 4281-4286. [Crossref]
- Shokoufi M, Golnaraghi F (2015) Development of a Handheld Diffuse Optical Breast Cancer Assessment Probe. J Innov Opt Health Sci 9: 1–10.
- “Breast cancer statistics - Canadian Cancer Society.” [Online]. [http://www.cancer.ca/en/cancer-information/cancer-type/breast/statistics/?region=bc].
- Siegel RL, Miller KD, Jemal A (2016) Cancer statistics, 2016. CA Cancer J Clin 66: 7–30. [Crossref]
- Kennedy DA, Lee T, Seely D (2009) A comparative review of thermography as a breast cancer screening technique. Integr Cancer Ther 8: 9-16. [Crossref]
- Hassan AM, El-Shenawee M (2011) Review of electromagnetic techniques for breast cancer detection. IEEE Rev Biomed Eng 4: 103-118. [Crossref]
- Shokoufi M, Grewal PK, MacAulay C, Golnaraghi1 F (2016) Periodic Dynamic Thermography for Breast Cancer Assessment. J Bioeng Biomed Sci 6: 6-10. [Crossref]
- Alzurq E, Almaktari A, Aldin BS, Hamoud M, Othman S, et al. (2016) New system for early breast cancer detection by Electrical impedance spectroscopy. Recent Advances in Environmental Science and Biomedicine 4: 142-150.
- Grewal PK (2014) Multimodality based Tissue Classification Technique for Malignant Anomaly Detection.
- Moqadam SM (2015) Tissue Characterization and Cancer Detection Based on Bioimpedance Spectroscopy.
- Golnaraghi F, Grewal PK (2014) Pilot study: electrical impedance based tissue classification using support vector machine classifier. IET Sci Meas Technol 9: 579-587.
- Liu R, Dong X, Fu F, You F, Shi X, et al. (2007) Multi-frequency parameter mapping of electrical impedance scanning using two kinds of circuit model. Physiol Meas 28: S85-100.
- Moqadam SM, Grewal P, Shokoufi M, Golnaraghi F (2015) Compression-dependency of soft tissue bioimpedance for in-vivo and in-vitro tissue testing. J Electr Bioimpedance 6: 22.
- Chen K, Ying Z, Zhang H, Zhao L (2008) Analysis of least absolute deviation. Biometrika 95: 107-122.
- Miller SJ (1992) The Method of Least Squares and Signal Analysis. 1-7.
- Assenheimer M, Laver-Moskovitz O, Malonek D, Manor D, Nahaliel U, et al. (2001) The T-SCAN technology: electrical impedance as a diagnostic tool for breast cancer detection. Physiol Meas 22: 1-8. [Crossref]
- Stojadinovic A, Nissan A, Gallimidi Z, Lenington S, Logan W, et al. (2005) Electrical impedance scanning for the early detection of breast cancer in young women: Preliminary results of a multicenter prospective clinical trial. J Clin Oncol 23: 2703-2715. [Crossref]