Abstract
Regardless of the success of Genome Wide Association Studies (GWAS) to identify genetic variants associated with human diseases, investigating the molecular mechanisms and disease-associated genes linked to those genetic variants, is a very complex task. Specifically, where intergenic genetic variants are linked to the adjacent neighbouring genes. Consequently, the inference for the mechanistic connection between diseases and its susceptible genetic variants becomes more challenging.
Functional genomics studies can support to reveal the significance of variants via intermediate molecular traits. Moreover, approaches like computational and bioinformatics predictions based on the variants location and its sequence attributes can assist to propose the candidate genes. As, the spectrum of potential functional consequences of variants is much broader; it still requires new methodologies to predict any molecular level perturbation. Thus, specialized algorithms and computable modelling approaches are essential, for the modelling and simulation of genetic regulatory networks.
In this review, we are briefly summarizing all the existing methodologies for genome wide association studies, currently available algorithms and computable modelling approaches; moreover also emphasizing the required new approaches for modelling and simulations of genetic regulatory networks to predict the functional consequences of disease-associated genetic variants.
Key words
GWAS, genetic variants, SNP, network biology, variant’s functional consequences, Alzheimer’s disease genetics
Introduction
Genome-wide association studies (GWAS) are well established in human genetics. In total, GWAS are possibly the largest molecular biology investigations of human beings ever conducted. The total number of people, who have been genotyped in GWAS studies, exceeds 1 Million. Major insights have been possible based on GWAS studies:
- Many common diseases have a polygenic architecture,
- The genetic effect sizes of common Single nucleotide polymorphism (SNP) variants are small,
- The identification of the involvement of genes and biological processes not previously suspected, and
- The association of some loci with different diseases.
GWAS have identified thousands of SNPs, known as lead-SNPs, which are associated with hundreds of human traits and diseases [1,2]. These lead-SNPs capture the variation present at risk-associated loci, but do not necessarily represent causal genetic variants that underlie the molecular mechanism of the association [1]. With the original lead-SNP, a collection of genetic variants at each risk-associated locus, all putatively causal, are in linkage disequilibrium (LD) according to the initial design of the GWAS studies [3,4]. Those genetic variants, which are within a risk-associated locus and in strong LD with the lead-SNP could account for the observed difference in phenotype associated with that locus.
The ultimate goal for the post-GWAS era is to highlight those specific genetic variants identified within a risk-associated locus that account for phenotypic differences based on the functional biology they modulate. However, more than 88% of disease-associated variants fall into non-coding regions of the genome [1], which makes it extremely challenging to generate testable hypotheses about the functional involvement of neighbouring genes. Even for SNPs in genic regions, it remains often unclear, whether they are functional due to the presence of several closely linked variants. A variety of statistical methods have been proposed to prioritize GWAS signals by incorporating diverse functional evidence [5]. GWAS identified variants can be prioritized at both, the SNP level and gene level, depending on the biological features considered and the input signals available.
Until recently, the functional characterization of risk-associated loci was limited by the incomplete annotation of non-coding sequences in the human genome. Population-based studies have revealed that non-coding genetic variants are linked with gene expression [6–9], RNA splicing [10], transcription factor binding [11], chromatin openness measured by DNase I hypersensitivity [12], DNA methylation [13], and histone modifications [14–16]. Additionally, SNPs are more commonly linked with a particular phenotype if they fall within a DNase I hypersensitive region from a disease relevant cell type [17].
Likewise, with the integration of other data informative about trait association (like gene expression, expression quantitative trait loci (eQTL) and others), the prioritized genes/loci are more likely to be truly associated with a trait. For instance, there is accumulating evidence that trait-associated loci are more intense in regions with certain genomic features, such as protein coding regions and eQTL [5].
A series of large-scale genomics projects, including the Encyclopedia of DNA Elements (ENCODE) [18,19], the International Human Epigenome Consortium (IHEC) [20], the Roadmap Epigenomics [21] and the Functional Annotation of the Mammalian Genome (FANTOM) [22] projects, as well as independent labs have undertaken significant effort to systematically annotate non-coding regions of the human genome in several different cell and tissue types and across several developmental stages.
These large-scale studies have profited from advances in next generation sequencing technologies to generate genome-wide maps of functional elements, such as origins of replication, transcripts and regulatory elements. RNA-sequencing (RNA-seq) and cap analysis of gene expression sequencing (CAGE-seq) approaches led to the identification and annotation of known as well as novel transcripts such as long non-coding RNA (lncRNA) and enhancer RNA (eRNA) [23–25]. Whole-genome epigenetic mapping (WGEM) for histone modifications through chromatin immune-precipitation sequencing (ChIP-seq) identifies regulatory elements including promoters, enhancers, and insulators [26–30].
Moreover, inter-species evolutionarily conserved DNA sequences can complement these maps by predicting potential functional DNA elements [31,32]. Taken together, such biological information, across the human genome, assist as the foundation for post-GWAS functional studies.
Genetic Variants and their detection Power
Genome wide association studies (GWAS): Over the last years, GWAS have established as popular approaches for the identification of genetic variants that are associated with disease risk loci. In a standard GWAS study design; a case control comparison to assess the association between each individual genotyped SNP and disease risk is performed. Very often, a discovery phase in which an initial set of promising susceptibility loci is identified, is followed by a confirmation stage in which the SNPs identified in the initial stage are replicated in a separate study cohort [33]. The standard methodology for analyzing GWAS in the discovery phase consist of individual SNP analysis, then SNPs are ranked on the basis of their individual p-values and a threshold is set such that all SNPs with p-value less than that threshold will be validated further.
However, with this individual-SNP analysis, reproducibility is very limited, since multiple high-ranked SNPs in the discovery phases are false positives and cannot be verified [34]. Besides, the true causal SNP (if it exists at all) is rarely genotyped; instead, other typed SNPs which are in linkage disequilibrium (LD) with the causal SNP, are being measured and these “related SNPs” may show only moderate effects at mechanistic level and – as a consequence – moderate association with the disease phenotype. Therefore, a locus-centric analysis could be beneficial to consider the joint effect of multiple SNPs in analysis as it is likely that several of these markers are in LD with the causal SNP and could show the true effect more effectively [35]. Additionally, individual SNP analysis only considers the marginal effect of each SNP and cannot detect epistatic effects. Epistatic interactions between SNPs can contribute to disease susceptibility [36].
The statistical power of a GWAS is a function of sample size, effect size, causal allele frequency, and marker allele frequency and its correlation with the causal variant [37]. Because GWASs are underpowered to detect associations of modest effect sizes (odds ratio (OR) = 1.1–1.5) [38-40], large population samples are required to detect variants of even moderate effect (OR = 1.5–2). Meta-analyses of independent GWASs for a trait reap the full benefit of GWASs that have already been performed, greatly increasing sample size and statistical power. When different GWASs use different genotyping platforms, only a minority of the SNPs are in common to all platforms. Imputation methods have been developed to infer genotypes at un-typed SNPs using a reference panel of more densely genotyped samples [41]. After imputation, GWAS results can be combined across multiple studies [42].
For meta-analysis, it would be ideal to include the raw data as a covariate for all studies contributing to the analysis, but meta-analysis could also be done without the use of the raw genotypes. It calculates the effect size that each study attributes to the genetic variant and weighted according to the relevant study size. In such analysis, small studies contribute less than large studies because they are likely to give less accurate effect-size estimates [43]. The significance of any given effect size can be determined by the size of the sample studied. The simple equation is: Significance Test = Effect Size x Study Size
As an alternative, a natural grouping strategy has been proposed. This approach is based on the grouping of SNPs into SNP sets based on proximity to genomic features such as genes or haplotype blocks; it can significantly reduce the number of multiple comparisons [34]. An extension of gene-based SNP set analysis is to group SNPs based on whether they are located within a pathway represented in Kyoto Encyclopedia of Genes and Genomes (KEGG) [44] or a Gene Ontology Consortium functional category [45]. Even though, making inference on a pathway further reduces the number of multiple comparisons, but it still allows inference on a biologically meaningful unit [34]. It is noteworthy in this context, that the functional context represented by pathways (e.g. in KEGG) can be expanded towards entire computable disease models (e.g. in Biological Expression Language (BEL) [46].
Functional impact of Genetic Variants at Molecular level
The functional impact of SNPs should be closely linked to their interference with (or modulation of) normal physiological functions. As, some SNPs are very likely to directly interfere with bio-molecular functions of genes and genomic regions whereas other SNPs can only convey susceptibility of human diseases by yet unknown mechanisms [47].
Following section describes the different functional categories that can be articulated as “mode-of-SNP-action” classes.
Genetic variants on coding regions
Protein Coding SNPs have been most extensively studied due to their direct effect on the function of that encoded protein.
- Non-synonymous genetic variants: Proteins have a unique sequence of amino acids specified by the coding DNA, and a modification to its sequence can significantly impact its function [48]. The risk associated with non-synonymous genetic variants (nonsense or missense) can easily be translated into a change in protein structure or function due to change in amino acid sequence. Non-synonymous SNPs can modify amino acid composition, or truncate the protein sequence by causing an early codon [49]. Indels (insertion or deletion of nucleotide base(s)) can also alter protein sequence with varying consequence depending on whether the indel is in-frame or frame-shifting, and this substitution may affect protein folding, proper activity of binding or interaction sites, structure, stability or solubility of the protein. For example, the rs1990760 SNP associated with type 1 diabetes (T1D), is an example of a non-synonymous genetic risk variant of IFIH1 (interferon induced with helicase C domain 1) gene, causing an alanine to threonine substitution at position 946 (A946T) of the IFIH1/MDA5 protein [49].
- Synonymous genetic variants: Synonymous genetic variants do not alter the codon sequence and consequently cannot encode any change in protein sequences. However, synonymous genetic risk variants can still impact protein function by modulating translation rates with direct consequences to protein folding [50]. As an example, we will discuss here the rs1045642 SNP that maps to the MDR1 (Multidrug Resistant-1) gene [51,52]. The MDR1 gene (ABCB1 - relevant human gene) encodes a cell membrane transporter protein involved in drug trafficking [53] and the rs1045642 SNP changes the drug substrate specificity of MDR1 but does not influence the sequence or the expression of the MDR1 protein [52]. Due to the rs1045642 SNP, the frequent isoleucine (Ile) codon ATC replaces by the rare Ile codon ATT [52]. It has been suggested that this alteration slows down the rate of translation of the MDR1 mRNA, and this impacts protein folding [54], and that the subsequent altered MDR1 conformation decreases its drug substrate specificity [51–53]. It has also been shown that a fraction of codons specify not only an amino acid, but a transcription factor binding site, providing an additional avenue through which synonymous polymorphisms may impart a functional effect [55].
- Splice Site Genetic Variants: Splicing is a process, in which introns are excised and exons are joined, at RNA sequence level [56]. Exonic splicing enhancers (ESEs) comprise specific hexamer sequences and an AG sequence at the intron-exon borderline that instruct for the recruitment of the splicing complex to immature RNA (pre-mRNA) and lead for intron excision and exon joining. SNPs may also present within exon splicing enhancers or silencers (ESEs/ESSs). ESEs and ESSs are typically 6 to 8 consecutive nucleotide sequences in an exon region. Similar to the SNPs occurring in splice sites, SNPs within ESEs or ESSs can also result in deleterious intron retention or exon skipping [56–59]. SNPs and indels can also interrupt splicing sites to translate the protein isoform. A mechanistic insight, how a SNP can affect splicing, is provided through the rs1800693 SNP example. This SNP is located at the edge of exon/intron of the TNFRSF1A (tumour necrosis factor receptor superfamily member 1A) gene and is associated with multiple sclerosis. The SNP affects the splicing of the TNFRSF1A mRNA and leading to translate an isoform [60].
Genetic Variants on Non-coding regions
Mammalian regulatory interactions can take place over significant chromosomal distances up to an entire megabase (1MB) [61]. Genetic risk variants are very frequent on non-coding sequences [62]. Post-GWAS studies have revealed the capacity of these genetic risk variants to regulate gene expression by modulating cis-regulatory machineries through mechanisms involving DNA methylation [63], transcription factor binding [64], chromatin looping [65], or miRNA recruitment [66]. Databases that provide information of experimentally verified transcriptional regulatory regions can be used to identify SNPs that can alter gene expression like HTRIdb [67].
- DNA methylation and Genetic variants at promoters: DNA methylation means addition of methyl groups to a cytosine nucleotide, which is basically part of a CpG dinucleotide. This DNA methylation is a heritable epigenetic event, which is involved in transcriptional regulation [68]. DNA hyper-methylation near transcription start sites (TSS) of tumour suppressor genes associates with their silencing [68]. For instance, the HNF1B (hepatocyte nuclear factor 1 homeo-box B) gene is silenced by DNA methylation in serous ovarian tumours. The rs7405776 SNP defines a risk locus for intrusive serous ovarian cancer that is located within the promoter region of the HNF1B gene. This risk-associated locus, at the HNF1B gene promoter region, is located in a CpG island and is associated with higher DNA methylation levels [10].
- Transcription factor binding to the chromatin and Genetic variants: Across the genome, transcription factors bind to thousands of regulatory elements, including promoters directly upstream of their target genes and cis-regulatory elements such as enhancers, insulators and silencers [69]. ChIP-seq assays for transcription factors effectively annotate these cis-regulatory elements genome-wide. Analysis of these annotations reveals that genetic risk variants commonly target cis-regulatory elements, mainly enhancers, in a disease- and tissue-specific manner [17,27,70-73]. For example, loci associated with erythrocyte phenotypes commonly harbour enhancers that are functional in K562 erythrocyte leukemia cells, but not enhancers that are functional in other cell types [27].
Genetic risk variants located within promoter regions can also change transcription factor binding to DNA, leading to differential target gene expression [74,75]. For example, expression of the a-globin gene locus is affected by a genetic variant associated with the a-thalassemia blood disorder [74]. That genetic variant creates a GATA1 motif at a promoter-like region that down-regulates the expression of the downstream a-globin genes [74]. Down-regulation of a-globin genes promotes a-thalassemia [76].
Enhancers are commonly targeted by those genetic variants of risk-associated loci that map to DNA recognition motifs, bound by transcription factors. These genetic variants can modulate the chromatin affinity for transcription factors and consequently gene expression [77–82]. One example for this type of functional impact is the rs1427407 SNP, which is associated with fetal hemoglobin level. It decreases the recruitment of the GATA1 (GATA binding protein 1)/TAL1 (T cell acute lymphocytic leukemia 1) nuclear complex to the enhancer region, and results in lower levels of expression for the BCL11A (B cell CLL/lymphoma 11A) gene, a repressor of the fetal hemoglobin level [78]. Likewise, the rs12740374 SNP, which is associated with a lower level of plasma low-density lipoprotein cholesterol (LDL-C), shows higher expression level of the SORT1 (sortilin 1) gene by increasing the binding affinity of the C/EBP (CCAAT enhancer-binding protein) transcription factor to chromatin [79]. Over-expression of SORT1 leads to a lower LDL-C level in livers [79]. Moreover, functional variants within a single risk locus can modulate multiple different enhancers. This multi-enhancer variant phenomenon was found to be a fundamental feature of many risk loci [83].
- Chromatin loop formation bridging enhancers and promoters and Genetic variants: Genetic risk variant can modulate chromatin loop formation, it can alter the DNA affinity for looping factors, which can also result in allele-specific chromatin loop formation. The human genome is structured in a three dimensional architecture which is thought to regulate a diverse set of DNA-templated processes [84–88]. This facilitates regulatory elements, like promoters and enhancers, to interact physically through long-range chromatin loops, or chromatin interactions, to regulate gene expression [89,90]. This has been shown for the rs12913832 SNP, which resides in an enhancer 21 kb upstream of the OCA2 (Oculocutaneous albinism II) pigment gene. This particular SNP is a human pigmentation-associated SNP, which interferes with (modulates) allele-specific chromatin loop formation [91].
Recent studies have analyzed CTCF (CCCTC binding factor) [92] and cohesin [93,94] binding sites, DNase-hypersensitive sites [95] and putative enhancers [96] on a genome-wide scale. If a minor fraction of these potential regulatory elements participate in chromatin looping, then most of the genomic interactions have yet to be characterized again, because many such loops appear to be tissue-specific [97-99], which makes their comprehensive analysis appear even more disconcerting [100].
- Genetic variants and miRNAs: MicroRNAs (miRNAs) target mRNAs by recognizing their complementary sequences mainly in 3’ untranslated regions (3’UTRs). miRNAs largely function as post-transcriptional repressors. They recruit RNA-induced silencing complex (RISC) to their target mRNAs, leading to mRNA degradation or translation repression [101]. They can regulate the translation of hundreds of genes through sequence-specific binding to mRNA [102]. Abelson et al. showed that SNPs linked to miRNA can affect disease phenotype, they identified a mutation, residing in the ‘miR-189’ binding site of gene SLITRK1 (SLIT and NTRK-like protein 1) that was associated with Tourette’s syndrome [103].
SNP variants, linked with miRNAs, can affect gene functionality with three different ways: 1) by transcription of primary transcript, 2) by pri-microRNA and pre-microRNA processing and 3) by effecting the microRNA- microRNA interaction [104]. For instance, SNPs, reside in the pri regions of let-7e and mir-16, reduce the levels of mature micRNA [105,106]. Thus, SNPs located in miRNA binding site of target mRNAs can interrupt miRNA-dependent regulation and eventually effect gene expression in cancer, like a miRNA from let-7 family binds to 3’UTR region of the gene RAS and regulates its expression level [107]. For example, the rs100672, a Crohn’s disease-associated SNP, lies within the 3’ UTR of the IRGM (immunity-related GTPase M) gene and this risk allele alters the complementary target sequence of miRNA-196 [78]. This reduces miRNA-196 binding to the IRGM mRNA increasing the stability of the IRGM mRNA and protein levels [78,108].
Tools such as RegRNA 2.0 and miRBase (the microRNA database) can predict how genetic variants impact miRNA target specificity [78,109].
- Genetic variants and Long non-coding RNAs (lncRNAs): lncRNAs are non-protein-coding transcripts which could be longer than 200 nucleotides in length. lncRNAs are found across intergenic regions of the human genome [23]. They can interact with chromatin regulators for their recruitment by chromatin [110,111], a process, which relies on a highly conserved lncRNA tertiary structure. Though, lncRNA tertiary structures can be changed by genetic risk variants [112]. The 9q21.3 (coronary artery disease) and 22q12.1 (myocardial infarction) risk loci have SNPs associated with the ANRIL and MIAT (myocardial infarction associated transcript) lncRNAs, respectively [113,114]. The risk SNP rs35955962 is located in the MIAT lncRNA, that increases its affinity for nuclear proteins [114].
The fundamental question about the effective distance between influential regulatory elements and target genes has not yet been answered. However, regulatory elements (like enhancers) necessary for tissue-specific gene expression have been identified at megabase (1MB) distances from their target genes, and have been shown to physically interact with them [115,116].
Integrative functional post-GWAS methodologies
Bioinformatics tools/methodologies and integrative functional genomics that combine GWAS data, linkage disequilibrium, and whole-genome functional annotations can provide a means to identify the targets of risk-associated loci [17,27,70,71]. Such tools can be employed to predict the biological impact of genetic risk variants and identify putative causal genetic variant responsible for risk loci.
- Protein Deleteriousness Predictions: Many computational tools have been developed to predict “deleteriousness” of SNPs and indels [117,118]. These methods generally take features like biochemical property of the altered amino acid, conservation and sequence homology as input, and use machine-learning technique to train a classifier. The most extreme case of protein function interruption is the loss of function mutation. However, genome-sequencing studies found that all human carry loss of function mutations without obvious phenotypic effect, and such common loss of function variants were depleted in polymorphisms associated with complex disease like Crohn’s disease and rheumatoid arthritis [119]. The results indicate that the “deleteriousness” feature should be interpreted with caution, since disruption of protein function does not necessarily have a phenotypic effect. In this regard, the “residual variance intolerance score” has been defined quantitatively measure the tolerance of a protein to mutations [120]. Numerous tools have been developed to predict the putative deleterious effects of non-synonymous SNPs that cause an amino acid change in a translated protein including SIFT [110], PolyPhen-2 (Polymorphism Phenotyping v2) [111]. Tools like, PolyPhen and MuTIP predict changes in protein structure imposed by genetic risk variants mapping to coding regions [118,121].
- DNA recognition motifs to modulate transcription factor binding: Motif-prediction tools, such as HaploReg, RegulomeDB, FunSeq, and SnpEff, identify genetic variants that significantly alter DNA recognition motifs to modulate transcription factor binding [122–125]. The intra-genomic replicates (IGR) method provides an alternative and can predict changes in chromatin-binding affinity of transcription factors caused by risk variants without the use of position-weighted matrices (PWM) [71].
- DNase I Hypersensitive Sites: DNase I hypersensitive sites (DHSs) are markers of accessible chromatin, which indicate regulatory roles in the transcription process. DHS have been mapped in 349 cell and tissue samples genome-wide by next-generation sequencing [126]. Enrichment analysis showed that trait-associated SNPs are more concentrated within DHS regions, excluding confounding factors such as allele frequency and distance from the nearest transcriptional start site [17].
- DNA methylation: Epigenome data in disease states are valuable for understanding disease and prioritize disease susceptible loci. However, more efforts are needed in disease-specific epigenome mapping studies and the implementation of databases to make such data publicly available. For DNA methylation alone, one database exists, (DiseaseMeth), which has incorporated methylation data for 72 human diseases [127].
- Gene expression: Studying the association between genetic variation and gene expression offers a straightforward way to begin the complicated task of connecting risk variants to their putative target genes. Networks created using gene expression data from patient samples can also model the underlying molecular machinery [128] and can be exploited to bridge GWAS results with an underlying disease mechanism, as exemplified in the autism spectrum disorder [129]. Chen R [130] analysed 476 expression datasets available from Gene Expression Omnibus (GEO), and calculated the frequency that a gene was differentially expressed in these datasets, which they called “differential expression ratio.” They found that differential expression ratio is positively correlated with the likelihood that a gene harbours disease-associated variants, where the list of disease-associated genes was created by combining information from the Genetic Association Database (GAD; [131] and Human Gene Mutation Database (HGMD; [132]). In addition, they found that among the genes discovered in the initial scan of the WTCCC type 1 diabetes mellitus GWAS dataset, the differential expression ratio was higher in genes that were replicable than those not replicable in follow-up studies. These authors have developed an online server, FitSNPs, to incorporate this feature (http://fitsnps.stanford.edu/index.php).
- The Encyclopedia of DNA Elements: There are many more genomic features collected and annotated in large community projects, such as the Encyclopedia of DNA Elements (ENCODE) [47], which are potentially valuable for SNP prioritization. Kindt [133] examined enrichment or depletion of trait-associated SNPs in 58 genomic features. The features investigated covered genic and regulatory features, conservation features, and chromatin state features [133]. Among those features, genomic regions annotated as “heterochromatin” and “low expression signals” are depleted of trait-associated SNPs, while eQTLs and “strong enhancer” showed the highest level of enrichment [70].
Genetic Risk Variants’ Analyses
- Expression Quantitative Trait Loci: Genetic variation associated with gene expression, known as expression quantitative trait loci (eQTL), can identify the target genes of risk loci [6–9,134]. Polymorphism situated in DNA regulatory elements can alter the gene transcript frequency. Thus, as a quantitative trait locus, gene transcript frequency can be determined with substantial power [135,136]. Brem et al. [137] published the first genome-wide study of gene expression in 2002. eQTLs that link locally to adjacent genes, are denoted as cis-eQTLs. Whereas, those that are connected to genes at a distance either on the same or different non-homologous chromosome, are denoted as trans-eQTLs [138]. In most studies, ‘cis’ (local) has often been defined as being within 1 Mb of the variant under consideration [139]. Typically, cis-eQTLs are more abundant near transcription start sites (TSS) and transcription end sites (TES), and may map with low frequency more than 20kb away from gene [140]. Sometimes, exonic SNPs can also act as cis-eQTLs [140]. Even though, some cis-eQTLs are identified as shared or common eQTLs in different tissue types, trans-eQTLs are mostly dynamic and tissue-dependent [141]. In humans, the effects of cis-eQTLs are usually stronger than those of trans-eQTLs [125,126].
An analysis of Lymphoblastic Cell Line (LCL) eQTLs has revealed that GWAS identified SNPs, strongly associated with Crohen’s disease and these variants have been demonstrated to impact on PTGER4 (prostaglandin receptor 4) expression; a gene located around 270 kb away from the variant region [142].
In recent years, a number of eQTL studies have been executed, to explore the effects of cis and trans-acting variants in human tissues of liver [143], adipose fat [144,145] and brain [146]. The Genotype-Tissue expression (GTex) project (http://gtexportal.org), proposed and initiated by National Institutes of Health (NIH) (http://www.nih.gov/), promises to make available eQTL information derived from 30 sets of 1000 samples each, representing 30 different tissues for disease genetics [147].
Online tools such as SCAN and the eQTL browser are publicly available to query eQTL data [12,134] and several reviews regarding the application of eQTL studies are available [148,149]. VarySysDB is a public eQTL database that covers around 36,000 loci holding 190,000 annotated mRNA transcripts. Besides SNPs, VarySysDB also includes indel (deletion/insertion) variants from dbSNP, copy number variants (CNVs) from Genomic Variants Database, short tandem repeats and single amino acid repeats from H-InvDB and linkage disequilibrium regions from D-HaploDB [150].
eQTL analysis can also complement pathway-based association approaches that apply prior biological knowledge of genes and pathways to the interpretation of GWAS data [151–155]. Pathway-based tools, such as ‘Gene Relationships Among Implicated Loci’ (GRAIL), can also identify candidate target genes by identifying genes that are part of a pathway(s) that is enriched within multiple risk-associated loci identified for the same disease [156]. However, pathways are constantly evolving and adapting in parallel with our knowledge of them.
- Variant Set Enrichment (VSE) Analysis: The variant set enrichment (VSE) approach is among a set of first-generation integrative tools that have been developed [71]. It is a permutation-based method that compares the enrichment of genetic risk variant sets within any functional genomic element to randomly generated matched genetic risk variant sets [71,157]. In essence, it is a statistical test that assays for non-randomness. Similar methodologies have associated genetic risk variants from various diseases with specific chromatin states defined by WGEM [27] and regions of open chromatin [17,70]. However, Weng et al. [158] is suggested a SNP Set Enrichment Analysis (SSEA), based on ‘Adaptive rank truncated product method’, to assign at least one indicative SNP for each gene [158].
- Gene Set Enrichment (GSE) Analysis: In order to prioritize the set of genes mapped with selected SNPs, a Gene set Enrichment analysis could be implemented either on the bases of a gene relevant SNP count or functional scores associated with SNPs or with their connotation with Gene Ontology (GO) biological process [159]. GSE analysis needs multiple data sources, like gene expression, association and linkage studies, literature search, and biological pathways for a list of genes.
WebGestalt is gene prioritization methods, which visualizes and categorizes gene sets in multiple biological contexts, like chromosome distribution, GO tissue expression pattern, protein domain information, signaling and metabolic pathways and research literature [131]. Another method, Bayesian gene-set analysis (BGSA), is suggested by Shahbaba et al. [160], to evaluate the statistical significance of a specific pathway, based on the posterior distribution of its parallel hyper-parameter. It is a hierarchical Bayesian model, which combines data at the gene level by merging significance measures of SNPs linked with each gene, as well as at the pathway level by linking significance measures of genes relevant to each pathway [161].
- Pathway Enrichment Analysis: Likewise, various methods are implemented to evaluate pathway-based analyses for GWAS data, by taking gene set enrichment from transcriptomic studies into account [162-164], which have been extensively reviewed in the literature [151,155,158,165-172]. These methods could be used to test whether a group of genes in a biological pathway are jointly linked with a disease and different from selective statistics of genes and pathways. For instance, while using the GSEA framework, to evaluate the statistical significance for permutation and correction in multiple testing, Wang et al. allocated the highest statistic value as the statistic value of the gene, among all SNPs linked to a gene [155]. Another, related method, GSEA-SNP is recommended by Holden et al. [173], which computes all SNPs annotated to a pathway without evaluation of summary statistic at gene-level. While, Chen et al. [168] proposed another approach based on principal component, to identify ‘‘eigenSNPs’’ for each gene to measure their joint association of multiple SNPs. Segre et al. proposed another protocol named as MAGENTA (Meta-Analysis Gene-set Enrichment of variaNT Associations), which can be used for both hypothesis testing and hypotheses generating analyses. By using GWAS results, it tests for genetic association enrichment in a group of functionally related genes or predefined biological processes [153].
ALIGATOR (Association LIst Go AnnoTatOR) method is suggested by Jones et al. [174]. It can be used to check for the overrepresentation of biological pathways, in lists of significant SNPs from GWA studies by using gene-ontology terms as index [169]. Likewise, Zhang et al. [175] developed an analytical framework named as ICSNPathway (Identify candidate Causal SNPs and Pathways) [175], to generate hypothesis of SNP, gene and pathway(s) to reveal the disease mechanism.
- Co-expression network: Undirected and weighted gene networks that characterise the correlation among gene expression levels are known as co-expression networks. In a co-expression network, genes (or probes) are represented by vertices, which measure the expression levels of gene transcripts. While an edge, between two vertices, indicates statistically significant correlation, moreover it is weighted by the correlation coefficient value [176].
Co-expression network can be employed to identify the functional annotation of undefined genes. Integration of eQTL analysis with co-expression network is such an application that is used successfully for this purpose. One key benefit of it is that without prior knowledge, regulatory insights can achieve [177].
- Protein-Protein Interaction (PPI) network and Interactome: Gene set enrichment analysis (GSEA) could be improved by performing on protein-protein interaction network data, which can provide a better way to evaluate GWAS data by measuring the combined effects of multiple markers/genes, while individually that may have very weak to moderate association effects [178]. In biological functions, like biochemical reactions, signal transduction systems, transcriptional regulation and cytoskeletal structures, binding affinity between proteins is very important; which, can be measured by different high- throughput experimental techniques, like affinity purification-mass spectrometry and two-hybrid system [176].
New analytical approaches are well recognized, in which different data resources are integrated to get their maximum predicting power. Bakir-Gungor et al. proposed a procedure to select functionally significant KEGG pathways by identifying genes within these pathways, where these genes are short-listed through SNP analysis, by initiating with a list of SNPs associated with selective phenotype in GWAS [179]. dmGWAS 2.0, proposed by Jia et al [178], is based on a Dense Module Searching (DMS) methodology. It can annotate relevant genes or sub-network region for complex diseases, by mapping association signals from GWAS datasets into the human PPI network. Particularly for low p-value genes in GWAS data, this DMS method systematically explores the most relevant sub-networks [178].
Moreover, to reveal the most relevant sub-networks for the disease, Liu Y et al. [180] has suggested two discrete approaches and the integration of both approaches is used to discover well-known as well as novel disease relevant genes or biological pathways [180]. PANOGA (Pathway And Network-Oriented GWAS Analysis) is another method proposed by Bakir-Gungor et al. [181] The method sum-ups p-values of GWAS SNPs and aggregates the functional score of SNPs from predictions produced by the SPOT [181] and F-SNP (The Functional Single Nucleotide Polymorphism) web-servers [182]; the resulting score is labelled as ‘pw-values’ [179]. PANOGA identifies the SNP associated with the gene that shows the most important functional effect, from all known SNP/gene transcript designations [179].
Iyappan et al. proposed an integrative approach, which takes benefit of the renowned and well-accepted RDF technology to incorporate data from different resources. That approach can be used to complement major heterogeneous resources (like, omics and gene expression data, and literature), to generate hypotheses for causal disease mechanisms. This approach not only can help to tackle the ever-growing data; but also it can support to integrate new data resources without changing the overall frame- work [183].
- Epistatic interactions: Systematically, there are three key categories of epistasis; functional, Compositional and Statistical [184]. Functional epistasis ascertains the molecular interactions that genetic elements have with each another [185]. Compositional epistasis reveals the blocking effect on one allele by another allele at a different locus [186]. Statistical epistasis expresses a quantitative way to detect how the genotype at one locus effects on the phenotype of another locus [187]; it measures deviation from the additive effects of two loci on the phenotype [184]. In the literature, for a pair of SNPs, there are two fundamental tests of epistasis. First one is the ‘two-locus interaction test’ and the other is ‘two-locus association test allowing for interaction’ [188].
Mao et al. [189] identified four types of epistasis effects of two candidate gene SNPs with linkage disequilibrium (LD) and Hardy-Weinberg disequilibrium (HWD), i.e. additive × additive, additive × dominance, dominance × additive, and dominance × dominance [190]. Zhang et al. proposed another algorithm, TEAM (Tree-based Epistasis Association Mapping), which is exhaustive (i.e. check all epistatic interaction). The TEAM algorithm uses the MST (minimum spanning tree) structure; and without perusing all individuals, it updates the contingency tables on incremental bases for epistatic tests. [191]. Emily et al. [192] proposed a statistic method, named as IndOR (independence-based odds ratio), based on the biologically functional epistasis.
Piriyapongsa et al. presented iLOCi (Interacting Loci), a SNP interaction prioritization algorithm. iLOCi identifies marker dependencies discretely for case and control groups and ranked them by calculating the difference in marker dependencies for all possible pairs of case and control groups [193]. Arkin et al. [194] presented an algorithm named as EPIQ (EPIstasis detection for Quantitative GWAS) for the detection of epistasis in quantitative GWAS data. EPIQ discovers SNPs with epistatic effect, without exhaustively testing all pairs of SNPs [194].
Case Study: GWAS and Alzheimer's disease
Over the past few years, in the field of Alzheimer's disease like many other complex and genetically heterogeneous diseases; the application of GWA screening to reveal novel susceptibility genes has attained substantial momentum. Beyond the well-known APOE association, more than two-dozen novel susceptibility loci are identified by these GWA studies [195].
Familial and Sporadic Alzheimer's disease
Alzheimer’s disease is the most common form of dementia and it is linked with ‘complex’ and multifactorial genetic characteristics. AD can be categorized into two major genetic etiologies, the familial AD form and the sporadic form. Familial AD typically exhibits an early age of onset (50-65 years) and follows a mendelian way of disease transmission; while sporadic AD shows no evident familial aggregation and typically it is associated with relatively late-onset age (beyond 65 years). The familial form of AD is usually caused by rare and highly penetrant mutation in the genes of APP, PSEN1 and PSEN2. GWA studies have identified more than 200 mutations within these three genes [196,197]. These genes are linked with the dysfunctioning in amyloid-β peptide (Aβ) production, that is a key element of β-amyloid in senile plaques [198]. Indubitably numerous other potential disease-causing genes still need to be discovered for familial AD, however this type of genetically determined AD accounts only for less than five percent of all AD cases [199,200].
More than 95% of all cases belong to the so-called sporadic form of AD. The genetics of sporadic AD is much less well established. Generally, it is believed that sporadic AD is likely to be determined by a number of common risk alleles with low-penetrance, across several distinct loci. Currently, these loci are rather imprecise. However, genes located on these loci affect several pathways, many of which are supposed to be linked with the production, accumulation and elimination (“clearance”) of Aβ. Moreover, there is rational evidence to suggest that collectively, these genes have a significant impact on disease susceptibility and age of onset [195,201].
APOE alleles and Alzheimer's disease
In account of late-onset AD (LOAD), a number of candidate gene studies dedicatedly focused on those potential genes and proteins that play a specific role in Aβ production.
Linkage studies have identified apolipoprotein E (APOE), a gene located on chromosome 19q13, as a candidate gene with the epsilon allele showing strong association to the disease [202]. The APOE gene has three risk alleles (i.e. the ε2, ε3, and ε4). However, out of them, the ε4 allele has a 4-fold greater risk for late-onset AD than the ε3 allele [203]. In contrast, the ε2 allele is relatively less common and has some protective effect with longevity [204,205] [Figure 1].
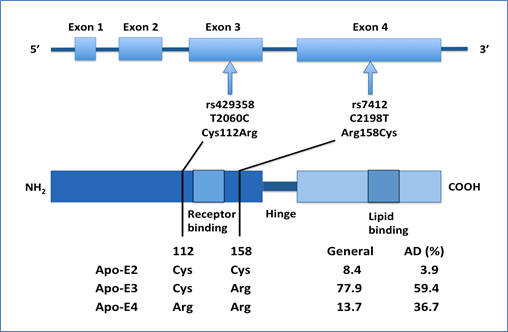
Figure 1. Schematic representation of the APOE SNPs and genotypes [206]: Two SNPs (rs429358 and rs7412) are in strong linkage disequilibrium and result in three APOE alleles (E2, E3 and E4). APOE ε4 is a major genetic risk factor for AD. The Apo-E2, -E3 and -E4 isoforms, which are encoded by the ε2, ε3 and ε4 alleles of the APOE gene, respectively, differ from each other at amino acid residues 112 and/or 158. Apo-E has two structural domains: the N-terminal domain, which contains the receptor-binding region (residues 136–150), and the C-terminal domain, which contains the lipid-binding region (residues 244–272); a hinge region joins the two domains. A meta-analysis demonstrated a significant association between the ε4 allele of APOE and AD.
Hence, some extensive studies suggest that only the ε4 allele of APOE does not describe all of the genetic risk of this region of chromosome 19, for AD. There are two other potential gene candidates: the first one is TOMM40 (encoding translocase of outer mitochondrial membrane 40 homolog) [206-208] and the second one is EXOC3L2 (exocyst complex component 3-like-2) [209]. These genes, located in close proximity to APOE on chromosome 19, have been proposed to also increase disease susceptibility. Involvement of these genes suggests that other biological mechanisms, like mitochondrial dysfunction may play a role in disease progression [210].
GWAS and Other Susceptibility loci for Alzheimer's disease
Correspondingly, the largest GWA study for AD to date that included up to around 75,000 individuals, were performed with European ancestry subjects. These association studies identified BIN1, CR1, EPHA1, CD2AP, MS4A6A, CLU, ABCA7, PICALM, PTK2B, HLA-DRB5/HLA-DRB1, SLC24A4/RIN3, SORL1, MEF2C, INPP5D, ZCWPW1, NME8, FERMT2, CELF1, CD33, CASS4 and EPHA1 as susceptibility loci for AD [209,211-215]. Most of these genes congregate into three pathways: immune and inflammation response, endocytosis/intracellular trafficking and lipid metabolism [216].
The SORL1 (Sortilin-Related Receptor, L (DLR Class) A Repeats Containing) gene had been established to regulate managing of APP in a candidate gene approach and intracellular trafficking [217,218]. CLU (Clusterin) is a lipoprotein that highly expressed in both the brain and the periphery [219]. Like APOE gene, it is also involved in lipid transport [220]. It is also hypothesized that CLU acts as an extracellular chaperone that regulates receptor-mediated Aβ clearance and Aβ-aggregation by endocytosis [219].
BIN1 (Bridging Integrator 1) is a part of the Bin1/amphiphysin/RVS167 (BAR) family that are associated with various cellular processes, including membrane trafficking, actin dynamics and clathrin-mediated endocytosis [221], which also influence Aβ production, APP processing and Aβ clearance from the brain. The PICALM (Phosphatidylinositol Binding Clathrin Assembly Protein) gene is associated with clathrin-mediated endocytosis in translocation of adaptor protein complex 2 and clathrin to sites of vesicle assembly [222].
The CD33 gene encodes a transmembrane protein of type-I that is linked to mediating cell-cell interactions and sialic acid-binding immunoglobulin-like lectins. In human brain, it is expressed in microglial cells; while increased expression of CD33 and CD33-positive microglia are observed in AD brains relative to controls. Contrariwise, a protective minor allele of the CD33, SNP rs3865444, leads to reductions in both CD33 expression in microglial cells and number of insoluble Aβ42 in AD brain. Additionally, the level of CD33-immunoreactive microglia positively correlates with the level of both insoluble Aβ42 and the amyloid plaque in AD cases [223,224].
CR1 (Complement receptor type 1) is a cell-surface receptor and member of the complement system that is associated with clearance of immune-complexes including C3b and C4b. Hence, C3b can bind Aβ oligomers; and in this way CR1 may be potentially involved in Aβ clearance. CR1 may also play a role in neuroinflammatory processes relevant for AD [225]. During this process, the CLU gene may get involved as an inhibitor [226].
The MS4A4A/MS4A4E/MS4A6E (Membrane-Spanning 4-Domains, Subfamily-A: Members 4A, 4E and 6E) locus maps to chromosome 11 and is a member of a group of 15 MS4A genes. As CD33, MS4A4A is also expressed on monocytes and myeloid cells, which suggests that it is involved in an immune-related function.
EPHA1 (EPH Receptor A1) is a member of the protein-tyrosine kinase family and the ephrin receptor subfamily. Members of this family are cell surface receptors, which binds with ephrin ligands on contiguous cells to regulate synapse formation, axon guidance, cell adhesion, migration and plasticity. EPHA1 also regulates cell motility and morphology [227]. In humans, besides expression in intestinal epithelium and colon epithelium, EPHA1 can be detected also in monocytes [228] and CD4-positive T lymphocytes [229]. This may imply that the basis for the genetic association of EPHA1 and AD lies in its putative function in the immune system.
CD2AP (CD2-Associated Protein) produces a scaffolding protein that binds to nephrin, actin and other proteins associated with cytoskeletal organization [230]. CD2AP is also involved in membrane trafficking and dynamic actin remodelling that occurs during receptor cytokinesis and endocytosis, whereas in the immune system, it is essential for synapse formation [231].
ABCA7 (ATP-Binding Cassette, Sub-Family A (ABC1), Member 7) is a member of the ATP-binding cassette (ABC) transporter superfamily. ABC family members involve in transportation of several molecules across intra- and extra- cellular membranes, including amyloid precursor protein [232] that is involved in host defence by influencing the phagocytosis of apoptotic cells by macrophages [233]. In addition, ABCA7 interacts with APOA-I and plays a role in cholesterol efflux and apolipoprotein-mediated phospholipid uptake from cells [232]. An independent GWA study, performed in African Americans, also confirmed that the ABCA7 gene is a susceptibility locus for AD [234].
Ridge et al. projected the phenotypic variance in Alzheimer’s disease case-control status concentrating on the 11 known AD markers. By using the HapMap imputed ADGC dataset with 2,042,116 SNPs, they anticipated that common variants identified in GWAS genes for Alzheimer’s disease, only elucidate 33% of the total phenotypic variance; within that APOE alone explicate 6% and other well-known 9 known high frequency SNPs 2%, whereas more than 25% of phenotypic variance are still need to be identified [216,235].
A rare mutation of TREM2 gene linked to Alzheimer's disease
A whole genome sequencing study performed by Jonsson et al. based on 2261 Icelandic individuals, discovered a rare mutation of rs75932628-T (R47H) located on TREM2 (Triggering Receptor Expressed On Myeloid Cells 2) gene with a frequency of 0.63%. This rare mutation is identified as a new promising genetic risk marker associated with AD, with the odds ratio of 2.92. Afterwards, this rare variant was confirmed in a replication study with the cohorts from Germany, Norway, Spain, the Netherlands and the USA [236,237]. Alongside, the link between the R47H variant and LOAD confirmed by Guerreiro et al. with a meta-analysis of three independent imputed data sets of GWA studies (i.e. EADI, GERAD and ANM) [238].
Six additional variants Q33X, Y38C, T66M, D87D, R98W and H157Y were also identified as associated with affected cases, which might be linked to AD pathology. Out of those three variants Q33X, Y38C and T66M, in the homozygous state, had been already identified in relation with a frontotemporal dementia like syndrome [239]. The TREM2 gene is linked with inflammatory responses; it is also involved in immunological pathways in AD. Microglial cells interact with β-amyloid plaques and produce high levels of pro-inflammatory cytokines and reactive oxygen species, which may exhibit an alteration in morphology [240].
TREM2 is the only gene to be recognized with an adequate risk effect in AD since the establishment of the ε4 allele of APOE for AD [236,239].
Conclusion
Even though, GWAS is very successful in revealing genetic loci associated with human diseases and traits, reconnoitring the disease associated genes and molecular mechanisms underlying the identified genetic variants is not a trivial task. As more than 80% of disease/trait-associated SNPs are located in outside the coding regions, and only 12% are located in or close to protein-coding regions of genes, and within that even only <5% are non-synonymous SNPs. Thus mostly genetic variants have to link to the adjacent (such as 500 kb distant) genes, to nominate them as candidate genes. Consequently, the inference for the mechanistic connection between diseases and its susceptible genetic loci is more challenging than ever supposed.
Functional genomics studies can support to reveal the functional significances of variants on intermediate molecular traits like protein products, alternative splicing, and gene expression. Thus subsequently, approaches, like computational and bioinformatics predictions based on the variants location and its sequence properties, can assist to propose the candidate genes. However, the range of potential functional consequences of variants is much broader, and therefore, new methodology is required to predict alteration in gene function. Furthermore, generally algorithms can only estimate variant effects on single proteins; likewise machine-learning approaches, that are being used to assess the effect of deleterious SNPs, have limitations.
Substantial knowledge about candidate genes in disease context are required to reveal the functional consequences at the molecular level, such as expression data at RNA and protein levels with time and space dimensions (such as at what time, in which tissue and in which organ). Furthermore, gene regulatory networks consists of many components linked to each other by multiple positive and negative feedback interactions, thus a deterministic understanding of their context is hard to achieve owing to rapidly growing complexity. Therefore, specialized algorithms and computable modelling approaches are essential, for the modelling and simulation of genetic regulatory networks.
Funding
2021 Copyright OAT. All rights reserv
The research leading to these results has received support from the EU/EFPIA Innovative Medicines Initiative Joint Undertaking under AETIONOMY grant agreement n°115568, resources of which are composed of financial contribution from the European Union's Seventh Framework Programme (FP7/2007-2013) and EFPIA companies' in kind contribution.
References
- Hindorff LA, Sethupathy P, Junkins HA, Ramos EM, Mehta JP, et al. (2009) Potential etiologic and functional implications of genome-wide association loci for human diseases and traits. Proc Natl Acad Sci U S A 106: 9362-9367. [crossref]
- Hindorff LA, MacArthur J, Morales J, Junkins HA, Hall PN, et al. (2016) A Catalog of Published Genome-Wide Association Studies. [crossref]
- McClellan J, King MC (2010) Genetic heterogeneity in human disease. Cell 141: 210-217. [crossref]
- Raychaudhuri S (2011) Mapping rare and common causal alleles for complex human diseases. Cell 147: 57-69. [crossref]
- Hou L, Zhao H (2013) A review of post-GWAS prioritization approaches. Front Genet 4: 280. [crossref]
- Dimas AS, Deutsch S, Stranger BE, Montgomery SB, Borel C, et al. (2009) Common regulatory variation impacts gene expression in a cell type-dependent manner. Science 325: 1246-1250. [crossref]
- Grisanzio C, Werner L, Takeda D, Awoyemi BC, Pomerantz MM, et al. (2012) Genetic and functional analyses implicate the NUDT11, HNF1B, and SLC22A3 genes in prostate cancer pathogenesis. Proc Natl Acad Sci U S A109: 11252-11257. [crossref]
- Li Q, Seo JH, Stranger B, McKenna A, Pe'er I, et al. (2013) Integrative eQTL-based analyses reveal the biology of breast cancer risk loci. Cell 152: 633-641. [crossref]
- Pomerantz MM, Shrestha Y, Flavin RJ, Regan MM, Penney KL, et al. (2010) Analysis of the 10q11 cancer risk locus implicates MSMB and NCOA4 in human prostate tumorigenesis. PLoS Genet 6: e1001204. [crossref]
- Kwan T, Benovoy D, Dias C, Gurd S, Provencher C, et al. (2008) Genome-wide analysis of transcript isoform variation in humans. Nat Genet 40: 225-231. [crossref]
- Kasowski M, Grubert F, Heffelfinger C, Hariharan M, Asabere A, et al. (2010) Variation in transcription factor binding among humans. Science 328: 232-235. [crossref]
- Degner JF, Pai AA, Pique-Regi R, Veyrieras JB, Gaffney DJ, et al. (2012) DNase I sensitivity QTLs are a major determinant of human expression variation. Nature 482: 390-394. [crossref]
- Shen H, Fridley BL, Song H, Lawrenson K, Cunningham JM, et al. (2013) Epigenetic analysis leads to identification of HNF1B as a subtype-specific susceptibility gene for ovarian cancer. Nat Commun 4: 1628. [crossref]
- McVicker G, van de Geijn B, Degner JF, Cain CE, Banovich NE, et al. (2013) Identification of genetic variants that affect histone modifications in human cells. Science 342: 747-749. [crossref]
- Kasowski M, Kyriazopoulou-Panagiotopoulou S, Grubert F, Zaugg JB, Kundaje A, et al. (2013) Extensive variation in chromatin states across humans. Science 342: 750-752. [crossref]
- Kilpinen H, Waszak SM, Gschwind AR, Raghav SK, Witwicki RM, et al. (2013) Coordinated effects of sequence variation on DNA binding, chromatin structure, and transcription. Science 342: 744-747. [crossref]
- Maurano MT, Humbert R, Rynes E, Thurman RE, Haugen E, et al. (2012) Systematic localization of common disease-associated variation in regulatory DNA. Science 337: 1190-1195. [crossref]
- ENCODE Project Consortium, Birney E, Stamatoyannopoulos JA, Dutta A, Guigó R, et al. (2007) Identification and analysis of functional elements in 1% of the human genome by the ENCODE pilot project. Nature 447: 799-816. [crossref]
- ENCODE Project Consortium (2012) An integrated encyclopedia of DNA elements in the human genome. Nature 489: 57-74. [crossref]
- Yan J, Enge M, Whitington T, Dave K, Liu J, et al. (2013) Transcription factor binding in human cells occurs in dense clusters formed around cohesin anchor sites. Cell 154: 801-813. [crossref]
- Bernstein BE, Stamatoyannopoulos JA, Costello JF, Ren B, Milosavljevic A, et al. (2010) The NIH Roadmap Epigenomics Mapping Consortium. Nat Biotechnol 28: 1045-1048. [crossref]
- Ravasi T, Suzuki H, Cannistraci CV, Katayama S, Bajic VB, et al. (2010) An atlas of combinatorial transcriptional regulation in mouse and man. Cell 140: 744-752. [crossref]
- Guttman M, Amit I, Garber M, French C, Lin MF, et al. (2009) Chromatin signature reveals over a thousand highly conserved large non-coding RNAs in mammals. Nature 458: 223-227. [crossref]
- Djebali S, Davis CA, Merkel A, Dobin A, Lassmann T, et al. (2012) Landscape of transcription in human cells. Nature 489: 101-108. [crossref]
- Plessy C, Bertin N, Takahashi H, Simone R, Salimullah M, et al. (2010) Linking promoters to functional transcripts in small samples with nanoCAGE and CAGEscan. Nat Methods 7: 528-534. [crossref]
- Ernst J, Kellis M (2010) Discovery and characterization of chromatin states for systematic annotation of the human genome. Nat Biotechnol 28: 817-825. [crossref]
- Ernst J, Kheradpour P, Mikkelsen TS, Shoresh N, Ward LD, et al. (2011) Mapping and analysis of chromatin state dynamics in nine human cell types. Nature 473: 43-49. [crossref]
- Heintzman ND, Hon GC, Hawkins RD, Kheradpour P, Stark A, et al. (2009) Histone modifications at human enhancers reflect global cell-type-specific gene expression. Nature 459: 108-112. [crossref]
- Heintzman ND, Stuart RK, Hon G, Fu Y, Ching CW, et al. (2007) Distinct and predictive chromatin signatures of transcriptional promoters and enhancers in the human genome. Nat Genet 39: 311-318. [crossref]
- Lupien M, Eeckhoute J, Meyer CA, Wang Q, Zhang Y, et al. (2008) FoxA1 translates epigenetic signatures into enhancer-driven lineage-specific transcription. Cell 132: 958-970. [crossref]
- Kolaczkowski B, Kern AD (2010) On the power of comparative genomics: Does Conservation Imply Function? Evolution Since Darwin: The First 150 Years. Sinauer Associates 151– 168. [crossref]
- Siepel A, Bejerano G, Pedersen JS, Hinrichs AS, Hou M, et al. (2005) Evolutionarily conserved elements in vertebrate, insect, worm, and yeast genomes. Genome Res 15: 1034-1050. [crossref]
- Kraft P, Cox DG (2008) Study designs for genome-wide association studies. Adv Genet 60: 465-504. [crossref]
- Wu MC, Kraft P, Epstein MP, Taylor DM, Chanock SJ, et al. (2010) Powerful SNP-set analysis for case-control genome-wide association studies. Am J Hum Genet 86: 929-942. [crossref]
- Schaid DJ, Rowland CM, Tines DE, Jacobson RM, Poland GA (2002) Score tests for association between traits and haplotypes when linkage phase is ambiguous. Am J Hum Genet 70: 425-434. [crossref]
- Hunter DJ, Kraft P (2007) Drinking from the fire hose--statistical issues in genomewide association studies. N Engl J Med 357: 436-439. [crossref]
- Stranger BE, Stahl EA, Raj T (2011) Progress and promise of genome-wide association studies for human complex trait genetics. Genetics 187: 367-383. [crossref]
- Risch N, Merikangas K (1996) The future of genetic studies of complex human diseases. Science 273: 1516-1517. [crossref]
- Spencer CC, Su Z, Donnelly P, Marchini J (2009) Designing genome-wide association studies: sample size, power, imputation, and the choice of genotyping chip. PLoS Genet 5: e1000477. [crossref]
- Stahl EA, Raychaudhuri S, Remmers EF, Xie G, Eyre S, et al. (2010) Genome-wide association study meta-analysis identifies seven new rheumatoid arthritis risk loci. Nat Genet 42: 508-514. [crossref]
- Li Y, Willer C, Sanna S, Abecasis G (2009) Genotype imputation. Annu Rev Genomics Hum Genet 10: 387-406. [crossref]
- de Bakker PI, Ferreira MA, Jia X, Neale BM, Raychaudhuri S, et al. (2008) Practical aspects of imputation-driven meta-analysis of genome-wide association studies. Hum Mol Genet 17: R122-128. [crossref]
- Munafò MR, Flint J (2004) Meta-analysis of genetic association studies. Trends Genet 20: 439-444. [crossref]
- Kanehisa M, Goto S (2000) KEGG: kyoto encyclopedia of genes and genomes. Nucleic Acids Res 28: 27-30. [crossref]
- Ashburner M, Ball CA, Blake JA, Botstein D, Butler H, et al. (2000) Gene ontology: tool for the unification of biology. The Gene Ontology Consortium. Nat Genet 25: 25-29. [crossref]
- Biological Expression Language (BEL): http://openbel.org/# (accessed on 30 June, 2016)
- ENCODE Project Consortium (2011) A user's guide to the encyclopedia of DNA elements (ENCODE). PLoS Biol 9: e1001046. [crossref]
- Nelson DL, Cox MM (2005) In: Lehninger’s Principles of Biochemistry, New York. WH Freeman Publishers. [crossref]
- Smyth DJ, Cooper JD, Bailey R, Field S, Burren O, et al. (2006) A genome-wide association study of nonsynonymous SNPs identifies a type 1 diabetes locus in the interferon-induced helicase (IFIH1) region. Nat Genet 38: 617-619. [crossref]
- Zhang X, Bailey SD, Lupien M (2014) Laying a solid foundation for Manhattan--'setting the functional basis for the post-GWAS era'. Trends Genet 30: 140-149. [crossref]
- Hoffmeyer S, Burk O, von Richter O, Arnold HP, Brockmöller J, et al. (2000) Functional polymorphisms of the human multidrug-resistance gene: multiple sequence variations and correlation of one allele with P-glycoprotein expression and activity in vivo. Proc Natl Acad Sci U S A 97: 3473-3478. [crossref]
- Kimchi-Sarfaty C, Oh JM, Kim IW, Sauna ZE, Calcagno AM, et al. (2007) A "silent" polymorphism in the MDR1 gene changes substrate specificity. Science 315: 525-528. [crossref]
- Fung KL, Gottesman MM (2009) A synonymous polymorphism in a common MDR1 (ABCB1) haplotype shapes protein function. Biochim Biophys Acta 1794: 860-871. [crossref]
- Komar AA (2007) Genetics. SNPs, silent but not invisible. Science 315: 466-467. [crossref]
- Stergachis AB, Haugen E, Shafer A, Fu W, Vernot B, et al. (2013) Exonic transcription factor binding directs codon choice and affects protein evolution. Science 342: 1367-1372. [crossref]
- Matlin AJ, Clark F, Smith CW (2005) Understanding alternative splicing: towards a cellular code. Nat Rev Mol Cell Biol 6: 386-398. [crossref]
- Blencowe BJ (2000) Exonic splicing enhancers: mechanism of action, diversity and role in human genetic diseases. Trends Biochem Sci 25: 106-110. [crossref]
- Cartegni L, Chew SL, Krainer AR (2002) Listening to silence and understanding nonsense: exonic mutations that affect splicing. Nat Rev Genet 3: 285-298. [crossref]
- Fairbrother WG, Yeh RF, Sharp PA, Burge CB (2002) Predictive identification of exonic splicing enhancers in human genes. Science 297: 1007-1013. [crossref]
- Gregory AP, Dendrou CA, Attfield KE, Haghikia A, Xifara DK, et al. (2012) TNF receptor 1 genetic risk mirrors outcome of anti-TNF therapy in multiple sclerosis. Nature 488: 508-511. [crossref]
- Holwerda S, de Laat W (2012) Chromatin loops, gene positioning, and gene expression. Front Genet 3: 217. [crossref]
- Frazer KA, Murray SS, Schork NJ, Topol EJ (2009) Human genetic variation and its contribution to complex traits. Nat Rev Genet 10: 241-251. [crossref]
- Docherty SJ, Davis OS, Haworth CM, Plomin R, D'Souza U, et al. (2012) A genetic association study of DNA methylation levels in the DRD4 gene region finds associations with nearby SNPs. Behav Brain Funct 8: 31. [crossref]
- Sribudiani Y, Metzger M, Osinga J, Rey A, Burns AJ, et al. (2011) Variants in RET associated with Hirschsprung's disease affect binding of transcription factors and gene expression. Gastroenterology 140: 572-582. [crossref]
- Wright JB, Brown SJ, Cole MD (2010) Upregulation of c-MYC in cis through a large chromatin loop linked to a cancer risk-associated single-nucleotide polymorphism in colorectal cancer cells. Mol Cell Biol 30: 1411-1420. [crossref]
- Brest P, Lapaquette P, Souidi M, Lebrigand K, Cesaro A, et al. (2011) A synonymous variant in IRGM alters a binding site for miR-196 and causes deregulation of IRGM-dependent xenophagy in Crohn's disease. Nat Genet 43: 242-245. [crossref]
- Bovolenta LA, Acencio ML, Lemke N (2012) HTRIdb: an open-access database for experimentally verified human transcriptional regulation interactions. BMC Genomics 13: 405. [crossref]
- Jones PA, Baylin SB (2007) The epigenomics of cancer. Cell 128: 683-692. [crossref]
- Ong CT, Corces VG (2011) Enhancer function: new insights into the regulation of tissue-specific gene expression. Nat Rev Genet 12: 283-293. [crossref]
- Schaub MA, Boyle AP, Kundaje A, Batzoglou S, Snyder M (2012) Linking disease associations with regulatory information in the human genome. Genome Res 22: 1748-1759. [crossref]
- Cowper-Sal lari R, Zhang X, Wright JB, Bailey SD, Cole MD, et al. (2012) Breast cancer risk-associated SNPs modulate the affinity of chromatin for FOXA1 and alter gene expression. Nat Genet 44: 1191-1198. [crossref]
- Hnisz D, Abraham BJ, Lee TI, Lau A, Saint-André V, et al. (2013) Super-enhancers in the control of cell identity and disease. Cell 155: 934-947. [crossref]
- Parker SC, Stitzel ML, Taylor DL, Orozco JM, Erdos MR, et al. (2013) Chromatin stretch enhancer states drive cell-specific gene regulation and harbor human disease risk variants. Proc Natl Acad Sci U S A 110: 17921-17926. [crossref]
- De Gobbi M, Viprakasit V, Hughes JR, Fisher C, Buckle VJ, et al. (2006) A regulatory SNP causes a human genetic disease by creating a new transcriptional promoter. Science 312: 1215-1217. [crossref]
- Huang Y, Yang H, Borg BB, Su X, Rhodes SL, et al. (2007) A functional SNP of interferon-gamma gene is important for interferon-alpha-induced and spontaneous recovery from hepatitis C virus infection. Proc Natl Acad Sci U S A 104: 985-990. [crossref]
- Higgs DR, Vickers MA, Wilkie AO, Pretorius IM, Jarman AP, et al. (1989) A review of the molecular genetics of the human alpha-globin gene cluster. Blood 73: 1081-1104. [crossref]
- Harismendy O, Notani D, Song X, Rahim NG, Tanasa B, et al. (2011) 9p21 DNA variants associated with coronary artery disease impair interferon-γ signalling response. Nature 470: 264-268. [crossref]
- Bauer DE, Kamran SC, Lessard S, Xu J, Fujiwara Y, et al. (2013) An erythroid enhancer of BCL11A subject to genetic variation determines fetal hemoglobin level. Science 342: 253-257. [crossref]
- Musunuru K, Strong A, Frank-Kamenetsky M, Lee NE, Ahfeldt T, et al. (2010) From noncoding variant to phenotype via SORT1 at the 1p13 cholesterol locus. Nature 466: 714-719. [crossref]
- Tuupanen S, Turunen M, Lehtonen R, Hallikas O, Vanharanta S, et al. (2009) The common colorectal cancer predisposition SNP rs6983267 at chromosome 8q24 confers potential to enhanced Wnt signaling. Nat Genet 41: 885-890. [crossref]
- Pomerantz MM, Ahmadiyeh N, Jia L, Herman P, Verzi MP, et al. (2009) The 8q24 cancer risk variant rs6983267 shows long-range interaction with MYC in colorectal cancer. Nat Genet 41: 882-884. [crossref]
- Zhang X, Cowper-Sal lari R, Bailey SD, Moore JH, Lupien M (2012) Integrative functional genomics identifies an enhancer looping to the SOX9 gene disrupted by the 17q24.3 prostate cancer risk locus. Genome Res 22: 1437-1446. [crossref]
- Corradin O, Saiakhova A, Akhtar-Zaidi B, Myeroff L, Willis J, et al. (2014) Combinatorial effects of multiple enhancer variants in linkage disequilibrium dictate levels of gene expression to confer susceptibility to common traits.Genome Res 24: 1-13. [crossref]
- Bickmore WA (2013) The spatial organization of the human genome. Annu Rev Genomics Hum Genet 14: 67-84. [crossref]
- Fraser P, Bickmore W (2007) Nuclear organization of the genome and the potential for gene regulation. Nature 447: 413-417. [crossref]
- Gibcus JH, Dekker J (2013) The hierarchy of the 3D genome. Mol Cell 49: 773-782. [crossref]
- Misteli T (2007) Beyond the sequence: cellular organization of genome function. Cell 128: 787-800. [crossref]
- Roix JJ1, McQueen PG, Munson PJ, Parada LA, Misteli T (2003) Spatial proximity of translocation-prone gene loci in human lymphomas. Nat Genet 34: 287-291. [crossref]
- Sanyal A, Lajoie BR, Jain G, Dekker J (2012) The long-range interaction landscape of gene promoters. Nature 489: 109-113. [crossref]
- Li G, Ruan X, Auerbach RK, Sandhu KS, Zheng M, et al. (2012) Extensive promoter-centered chromatin interactions provide a topological basis for transcription regulation. Cell 148: 84-98. [crossref]
- Visser M, Kayser M, Palstra RJ (2012) HERC2 rs12913832 modulates human pigmentation by attenuating chromatin-loop formation between a long-range enhancer and the OCA2 promoter. Genome Res 22: 446-455. [crossref]
- Kim TH, Abdullaev ZK, Smith AD, Ching KA, Loukinov DI, et al. (2007) Analysis of the vertebrate insulator protein CTCF-binding sites in the human genome. Cell 128: 1231-1245. [crossref]
- Parelho V, Hadjur S, Spivakov M, Leleu M, Sauer S, et al. (2008) Cohesins functionally associate with CTCF on mammalian chromosome arms. Cell 132: 422-433. [crossref]
- Wendt KS, Yoshida K, Itoh T, Bando M, Koch B, et al. (2008) Cohesin mediates transcriptional insulation by CCCTC-binding factor. Nature 451: 796-801. [crossref]
- Boyle AP, Davis S, Shulha HP, Meltzer P, Margulies EH, et al. (2008) High-resolution mapping and characterization of open chromatin across the genome. Cell 132: 311-322. [crossref]
- Heintzman ND, Stuart RK, Hon G, Fu Y, Ching CW, et al. (2007) Distinct and predictive chromatin signatures of transcriptional promoters and enhancers in the human genome. Nat Genet 39: 311-318. [crossref]
- Tolhuis B, Palstra RJ, Splinter E, Grosveld F, de Laat W (2002) Looping and interaction between hypersensitive sites in the active beta-globin locus. Mol Cell 10: 1453-1465. [crossref]
- Lanzuolo C, Roure V, Dekker J, Bantignies F, Orlando V (2007) Polycomb response elements mediate the formation of chromosome higher-order structures in the bithorax complex. Nat Cell Biol 9: 1167-1174. [crossref]
- Spilianakis CG, Flavell RA (2004) Long-range intrachromosomal interactions in the T helper type 2 cytokine locus. Nat Immunol 5: 1017-1027. [crossref]
- Sexton T, Bantignies F, Cavalli G (2009) Genomic interactions: chromatin loops and gene meeting points in transcriptional regulation. Semin Cell Dev Biol 20: 849-855. [crossref]
- Bartel DP (2009) MicroRNAs: target recognition and regulatory functions. Cell 136: 215-233. [crossref]
- Bartel B (2005) MicroRNAs directing siRNA biogenesis. Nat Struct Mol Biol 12: 569-571. [crossref]
- Abelson JF, Kwan KY, O'Roak BJ, Baek DY, Stillman AA, et al. (2005) Sequence variants in SLITRK1 are associated with Tourette's syndrome. Science 310: 317-320. [crossref]
- Ryan BM, Robles AI, Harris CC (2010) Genetic variation in microRNA networks: the implications for cancer research. Nat Rev Cancer 10: 389-402. [crossref]
- Wu M, Jolicoeur N, Li Z, Zhang L, Fortin Y, et al. (2008) Genetic variations of microRNAs in human cancer and their effects on the expression of miRNAs. Carcinogenesis 29: 1710-1716. [crossref]
- Calin GA, Ferracin M, Cimmino A, Di Leva G, Shimizu M, et al. (2005) A MicroRNA signature associated with prognosis and progression in chronic lymphocytic leukemia. N Engl J Med 353: 1793-1801. [crossref]
- Johnson SM1, Grosshans H, Shingara J, Byrom M, Jarvis R, et al. (2005) RAS is regulated by the let-7 microRNA family. Cell 120: 635-647. [crossref]
- Singh SB, Davis AS, Taylor GA, Deretic V (2006) Human IRGM induces autophagy to eliminate intracellular mycobacteria. Science 313: 1438-1441. [crossref]
- Huang HY, Chien CH, Jen KH, Huang HD (2006) RegRNA: an integrated web server for identifying regulatory RNA motifs and elements. Nucleic Acids Res 34: W429-434. [crossref]
- Rinn JL, Kertesz M, Wang JK, Squazzo SL, Xu X, et al. (2007) Functional demarcation of active and silent chromatin domains in human HOX loci by noncoding RNAs. Cell 129: 1311-1323. [crossref]
- Tsai MC1, Manor O, Wan Y, Mosammaparast N, Wang JK, et al. (2010) Long noncoding RNA as modular scaffold of histone modification complexes. Science 329: 689-693. [crossref]
- Shen LX, Basilion JP, Stanton VP Jr (1999) Single-nucleotide polymorphisms can cause different structural folds of mRNA. Proc Natl Acad Sci U S A 96: 7871-7876. [crossref]
- Broadbent HM, Peden JF, Lorkowski S, Goel A, Ongen H, et al. (2008) Susceptibility to coronary artery disease and diabetes is encoded by distinct, tightly linked SNPs in the ANRIL locus on chromosome 9p. Hum Mol Genet17: 806-814. [crossref]
- Ishii N, Ozaki K, Sato H, Mizuno H, Saito S, et al. (2006) Identification of a novel non-coding RNA, MIAT, that confers risk of myocardial infarction. J Hum Genet 51: 1087-1099. [crossref]
- Amano T, Sagai T, Tanabe H, Mizushina Y, Nakazawa H, et al. (2009) Chromosomal dynamics at the Shh locus: limb bud-specific differential regulation of competence and active transcription. Dev Cell 16: 47-57. [crossref]
- Lettice LA, Heaney SJ, Purdie LA, Li L, de Beer P, et al. (2003) A long-range Shh enhancer regulates expression in the developing limb and fin and is associated with preaxial polydactyly. Hum Mol Genet 12: 1725-1735. [crossref]
- Ng PC, Henikoff S (2003) SIFT: Predicting amino acid changes that affect protein function. Nucleic Acids Res 31: 3812-3814. [crossref]
- Adzhubei IA, Schmidt S, Peshkin L, Ramensky VE, Gerasimova A, et al. (2010) A method and server for predicting damaging missense mutations. Nat Methods 7: 248-249. [crossref]
- MacArthur DG, Balasubramanian S, Frankish A, Huang N, Morris J, et al. (2012) A systematic survey of loss-of-function variants in human protein-coding genes. Science 335: 823-828. [crossref]
- Petrovski S, Wang Q, Heinzen EL, Allen AS, Goldstein DB (2013) Genic intolerance to functional variation and the interpretation of personal genomes. PLoS Genet 9: e1003709. [crossref]
- Niknafs N, Kim D, Kim R, Diekhans M, Ryan M, et al. (2013) MuPIT interactive: webserver for mapping variant positions to annotated, interactive 3D structures. Hum Genet 132: 1235-1243. [crossref]
- Ward LD, Kellis M (2012) HaploReg: a resource for exploring chromatin states, conservation, and regulatory motif alterations within sets of genetically linked variants. Nucleic Acids Res 40: D930-934. [crossref]
- Boyle AP, Hong EL, Hariharan M, Cheng Y, Schaub MA, et al. (2012) Annotation of functional variation in personal genomes using RegulomeDB. Genome Res 22: 1790-1797. [crossref]
- Khurana E, Fu Y, Colonna V, Mu XJ, Kang HM, et al. (2013) Integrative annotation of variants from 1092 humans: application to cancer genomics. Science 342: 1235587. [crossref]
- Cingolani P, Platts A, Wang le L, Coon M, Nguyen T, et al. (2012) A program for annotating and predicting the effects of single nucleotide polymorphisms, SnpEff: SNPs in the genome of Drosophila melanogaster strain w1118; iso-2; iso-3. Fly (Austin) 6: 80-92. [crossref]
- Thurman RE, Rynes E, Humbert R, Vierstra J, Maurano MT, et al. (2012) The accessible chromatin landscape of the human genome. Nature 489: 75-82. [crossref]
- Lv J, Liu H, Su J, Wu X, Liu H, et al. (2012) DiseaseMeth: a human disease methylation database. Nucleic Acids Res 40: D1030-1035. [crossref]
- Califano A, Butte AJ, Friend S, Ideker T, Schadt E (2012) Leveraging models of cell regulation and GWAS data in integrative network-based association studies. Nat Genet 44: 841-847. [crossref]
- Voineagu I, Wang X, Johnston P, Lowe JK, Tian Y, et al. (2011) Transcriptomic analysis of autistic brain reveals convergent molecular pathology. Nature 474: 380-384. [crossref]
- Chen R, Morgan AA, Dudley J, Deshpande T, Li L, et al. (2008) FitSNPs: highly differentially expressed genes are more likely to have variants associated with disease. Genome Biol 9: R170. [crossref]
- Becker KG, Barnes KC, Bright TJ, Wang SA (2004) The genetic association database. Nat Genet 36: 431-432. [crossref]
- Stenson PD, Ball EV, Mort M, Phillips AD, Shiel JA, et al. (2003) Human Gene Mutation Database (HGMD): 2003 update. Hum Mutat 21: 577-581. [crossref]
- Kindt AS, Navarro P, Semple CA, Haley CS (2013) The genomic signature of trait-associated variants. BMC Genomics 14: 108. [crossref]
- Nicolae DL, Gamazon E, Zhang W, Duan S, Dolan ME, et al. (2010) Trait-associated SNPs are more likely to be eQTLs: annotation to enhance discovery from GWAS. PLoS Genet 6: e1000888. [crossref]
- Schadt EE, Monks SA, Drake TA, Lusis AJ, Che N, et al. (2003) Genetics of gene expression surveyed in maize, mouse and man. Nature 422: 297-302. [crossref]
- Morley M, Molony CM, Weber TM, Devlin JL, Ewens KG, et al. (2004) Genetic analysis of genome-wide variation in human gene expression. Nature 430: 743-747. [crossref]
- Brem RB, Yvert G, Clinton R, Kruglyak L (2002) Genetic dissection of transcriptional regulation in budding yeast. Science 296: 752-755. [crossref]
- Michaelson JJ, Loguercio S, Beyer A (2009) Detection and interpretation of expression quantitative trait loci (eQTL). Methods 48: 265-276. [crossref]
- Freedman ML, Monteiro AN, Gayther SA, Coetzee GA, Risch A, et al. (2011) Principles for the post-GWAS functional characterization of cancer risk loci. Nat Genet 43: 513-518. [crossref]
- Veyrieras JB, Kudaravalli S, Kim SY, Dermitzakis ET, Gilad Y, et al. (2008) High-resolution mapping of expression-QTLs yields insight into human gene regulation. PLoS Genet 4: e1000214. [crossref]
- Gerrits A, Li Y, Tesson BM, Bystrykh LV, Weersing E, et al. (2009) Expression quantitative trait loci are highly sensitive to cellular differentiation state. PLoS Genet 5: e1000692. [crossref]
- Libioulle C, Louis E, Hansoul S, Sandor C, Farnir F, et al. (2007) Novel Crohn disease locus identified by genome-wide association maps to a gene desert on 5p13.1 and modulates expression of PTGER4. PLoS Genet 23: e58. [crossref]
- Schadt EE, Molony C, Chudin E, Hao K, Yang X, et al. (2008) Mapping the genetic architecture of gene expression in human liver. PLoS Biol 6: e107. [crossref]
- Emilsson V, Thorleifsson G, Zhang B, Leonardson AS, Zink F, et al. (2008) Genetics of gene expression and its effect on disease. Nature 452: 423-428. [crossref]
- Chen Y, Zhu J, Lum PY, Yang X, Pinto S, et al. (2008) Variations in DNA elucidate molecular networks that cause disease. Nature 452: 429-435. [crossref]
- Myers AJ, Gibbs JR, Webster JA, Rohrer K, Zhao A, et al. (2007) A survey of genetic human cortical gene expression. Nat Genet 39: 1494-1499. [crossref]
- GTEx Consortium (2013) The Genotype-Tissue Expression (GTEx) project. Nat Genet 45: 580-585. [crossref]
- Gilad Y, Rifkin SA, Pritchard JK (2008) Revealing the architecture of gene regulation: the promise of eQTL studies. Trends Genet 24: 408-415. [crossref]
- Montgomery SB, Dermitzakis ET (2011) From expression QTLs to personalized transcriptomics. Nat Rev Genet 12: 277-282. [crossref]
- Shimada MK, Matsumoto R, Hayakawa Y, Sanbonmatsu R, Gough C, et al. (2009) VarySysDB: a human genetic polymorphism database based on all H-InvDB transcripts. Nucleic Acids Res 37: D810-815. [crossref]
- Wang K, Li M, Hakonarson H (2010) Analysing biological pathways in genome-wide association studies. Nat Rev Genet 11: 843-854. [crossref]
- Califano A, Butte AJ, Friend S, Ideker T, Schadt E (2012) Leveraging models of cell regulation and GWAS data in integrative network-based association studies. Nat Genet 44: 841-847. [crossref]
- Segrè AV, DIAGRAM Consortium, MAGIC investigators, Groop L, Mootha VK, Daly MJ, et al. (2010) Common inherited variation in mitochondrial genes is not enriched for associations with type 2 diabetes or related glycemic traits. PLoS Genet 6: e1001058. [crossref]
- Torkamani A, Topol EJ, Schork NJ (2008) Pathway analysis of seven common diseases assessed by genome-wide association. Genomics 92: 265-272. [crossref]
- Wang K, Li M, Bucan M (2007) Pathway-based approaches for analysis of genomewide association studies. Am J Hum Genet 81: 1278-1283. [crossref]
- Raychaudhuri S, Plenge RM, Rossin EJ, Ng AC; International Schizophrenia Consortium, Purcell SM, et al. (2009) Identifying relationships among genomic disease regions: predicting genes at pathogenic SNP associations and rare deletions. PLoS Genet 5: e1000534. [crossref]
- Akhtar-Zaidi B, Cowper-Sal-lari R, Corradin O, Saiakhova A, Bartels CF, et al. (2012) Epigenomic enhancer profiling defines a signature of colon cancer. Science 336: 736-739. [crossref]
- Weng L, Macciardi F, Subramanian A, Guffanti G, Potkin SG, et al. (2011) SNP-based pathway enrichment analysis for genome-wide association studies. BMC Bioinformatics 12: 99. [crossref]
- Harris MA, Clark J, Ireland A, Lomax J, Ashburner M, et al. (2004) The Gene Ontology (GO) database and informatics resource. Nucleic Acids Res 32: D258-261. [crossref]
- Zhang B, Kirov S, Snoddy J (2005) WebGestalt: an integrated system for exploring gene sets in various biological contexts. Nucleic Acids Res 33: W741-748. [crossref]
- Shahbaba B, Shachaf CM, Yu Z (2012) A pathway analysis method for genome-wide association studies. Stat Med 31: 988-1000. [crossref]
- Efron B, Tibshirani R (2007) On testing the significance of sets of genes. Ann Appl Stat 1: 107–129. [crossref]
- Newton MA, Quintana FA, den Boon JA, Sengupta S, Ahlquist P (2007) Random-set methods identify distinct aspects of the enrichment signal in gene-set analysis. Ann Appl Stat 1: 85–106. [crossref]
- Subramanian A, Tamayo P, Mootha VK, Mukherjee S, Ebert BL, et al. (2005) Gene set enrichment analysis: a knowledge-based approach for interpreting genome-wide expression profiles. Proc Natl Acad Sci U S A 102: 15545-15550. [crossref]
- Holmans P, Green EK, Pahwa JS, Ferreira MA, Purcell SM, et al. (2009) Gene ontology analysis of GWA study data sets provides insights into the biology of bipolar disorder. Am J Hum Genet 85: 13-24. [crossref]
- Askland K, Read C, Moore J (2009) Pathways-based analyses of whole-genome association study data in bipolar disorder reveal genes mediating ion channel activity and synaptic neurotransmission. Hum Genet 125: 63-79. [crossref]
- Kraft P, Raychaudhuri S (2009) Complex diseases, complex genes: keeping pathways on the right track. Epidemiology 20: 508-511. [crossref]
- Chen LS, Hutter CM, Potter JD, Liu Y, Prentice RL, et al. (2010) Insights into colon cancer etiology via a regularized approach to gene set analysis of GWAS data. Am J Hum Genet 86: 860-871. [crossref]
- Holmans P (2010) Statistical methods for pathway analysis of genome-wide data for association with complex genetic traits. Adv Genet 72: 141-179. [crossref]
- Luo L, Peng G, Zhu Y, Dong H, Amos CI, et al. (2010) Genome-wide gene and pathway analysis. Eur J Hum Genet 18: 1045-1053. [crossref]
- Zhang K, Cui S, Chang S, Zhang L, Wang J (2010) i-GSEA4GWAS: a web server for identification of pathways/gene sets associated with traits by applying an improved gene set enrichment analysis to genome-wide association study. Nucleic Acids Res 38:W90–W95. [crossref]
- Schaid DJ, Sinnwell JP, Jenkins GD, McDonnell SK, Ingle JN, et al. (2012) Using the gene ontology to scan multilevel gene sets for associations in genome wide association studies. Genet Epidemiol 36: 3-16. [crossref]
- Holden M, Deng S, Wojnowski L, Kulle B (2008) GSEA-SNP: applying gene set enrichment analysis to SNP data from genome-wide association studies. Bioinformatics 24: 2784-2785. [crossref]
- Jones L, Holmans PA, Hamshere ML, Harold D, Moskvina V, et al. (2010) Genetic evidence implicates the immune system and cholesterol metabolism in the aetiology of Alzheimer's disease. PLoS One 5: e13950. [crossref]
- Zhang K, Chang S, Cui S, Guo L, Zhang L, et al. (2011) ICSNPathway: identify candidate causal SNPs and pathways from genome-wide association study by one analytical framework. Nucleic Acids Res 39: W437-443. [crossref]
- Sun YV (2012) Integration of biological networks and pathways with genetic association studies. Hum Genet 131: 1677-1686. [crossref]
- Serin EA, Nijveen H, Hilhorst HW, Ligterink W (2016) Learning from Co-expression Networks: Possibilities and Challenges. Front Plant Sci 7: 444. [crossref]
- Jia P, Zheng S, Long J, Zheng W, Zhao Z (2011) dmGWAS: dense module searching for genome-wide association studies in protein-protein interaction networks. Bioinformatics 27: 95-102. [crossref]
- Bakir-Gungor B, Egemen E, Sezerman OU (2014) PANOGA: a web server for identification of SNP-targeted pathways from genome-wide association study data. Bioinformatics 30: 1287-1289. [crossref]
- Liu Y, Patel S, Nibbe R, Maxwell S, Chowdhury SA, et al. (2011) Systems biology analyses of gene expression and genome wide association study data in obstructive sleep apnea. Pac Symp Biocomput. [crossref]
- Saccone SF, Bolze R, Thomas P, Quan J, Mehta G, et al. (2010) SPOT: a web-based tool for using biological databases to prioritize SNPs after a genome-wide association study. Nucleic Acids Res 38: W201-209. [crossref]
- Lee PH, Shatkay H (2008) F-SNP: computationally predicted functional SNPs for disease association studies. Nucleic Acids Res 36: D820-824. [crossref]
- Iyappan A, Bagewadi S, Page M, Hofmann-Apitius M, Senger P (2014) NeuroRDF: Semantic Data Integration Strategies for Modeling Neurodegenerative Diseases. In Proceedings of the 6th International Symposium on Semantic Mining in Biomedicine (SMBM2014) Aveiro, Portugal. [crossref]
- Phillips PC (2008) Epistasis--the essential role of gene interactions in the structure and evolution of genetic systems. Nat Rev Genet 9: 855-867. [crossref]
- Boone C, Bussey H, Andrews BJ (2007) Exploring genetic interactions and networks with yeast. Nat Rev Genet 8: 437-449. [crossref]
- Bateson W (1909) Mendel’s Principles of Heredity. Cambridge Univ Press, Cambridge. [crossref]
- Fisher RA (1918) The correlations between relatives on the supposition of Mendelian inheritance. Trans Roy Soc Edinb 52: 399–433. [crossref]
- Cordell HJ (2009) Detecting gene-gene interactions that underlie human diseases. Nat Rev Genet 10: 392-404. [crossref]
- KEMPTHORNE O (1954) The correlation between relatives in a random mating population. Proc R Soc Lond B Biol Sci 143: 102-113. [crossref]
- Mao Y, London NR, Ma L, Dvorkin D, Da Y (2006) Detection of SNP epistasis effects of quantitative traits using an extended Kempthorne model. Physiol Genomics 28: 46-52. [crossref]
- Zhang X, Huang S, Zou F, Wang W (2010) TEAM: efficient two-locus epistasis tests in human genome-wide association study. Bioinformatics 26: i217-227. [crossref]
- Emily M (2012) IndOR: a new statistical procedure to test for SNP-SNP epistasis in genome-wide association studies. Stat Med 31: 2359-2373. [crossref]
- Piriyapongsa J, Ngamphiw C, Intarapanich A, Kulawonganunchai S, Assawamakin A, et al. (2012) iLOCi: a SNP interaction prioritization technique for detecting epistasis in genome-wide association studies. BMC Genomics 13: 7:S2. [crossref]
- Arkin Y, Rahmani E, Kleber ME, Laaksonen R, März W, et al. (2014) EPIQ-efficient detection of SNP-SNP epistatic interactions for quantitative traits. Bioinformatics 30: i19-25. [crossref]
- Bertram L, Tanzi RE (2009) Genome-wide association studies in Alzheimer's disease. Hum Mol Genet 18: R137-145. [crossref]
- Glenner GG, Wong CW (1984) Alzheimer's disease: initial report of the purification and characterization of a novel cerebrovascular amyloid protein. Biochem Biophys Res Commun 120: 885-890. [crossref]
- Ryan NS, Rossor MN (2010) Correlating familial Alzheimer's disease gene mutations with clinical phenotype. Biomark Med 4: 99-112. [crossref]
- Tanzi RE, Bertram L (2005) Twenty years of the Alzheimer's disease amyloid hypothesis: a genetic perspective. Cell 120: 545-555. [crossref]
- Raux G, Guyant-Maréchal L, Martin C, Bou J, Penet C, et al. (2005) Molecular diagnosis of autosomal dominant early onset Alzheimer's disease: an update. J Med Genet 42: 793-795. [crossref]
- Janssen JC, Beck JA, Campbell TA, Dickinson A, Fox NC, et al. (2003) Early onset familial Alzheimer's disease: Mutation frequency in 31 families. Neurology 60: 235-239. [crossref]
- Bertram L, Tanzi RE (2008) Thirty years of Alzheimer's disease genetics: the implications of systematic meta-analyses. Nat Rev Neurosci 9: 768-778. [crossref]
- Pericak-Vance MA, Bebout JL, Gaskell PC Jr, Yamaoka LH, Hung WY, et al. (1991) Linkage studies in familial Alzheimer disease: evidence for chromosome 19 linkage. Am J Hum Genet 48: 1034-1050. [crossref]
- Genin E, Hannequin D, Wallon D, Sleegers K, Hiltunen M, et al. (2011) APOE and Alzheimer disease: a major gene with semi-dominant inheritance. Mol Psychiatry 16: 903-907. [crossref]
- Olesen OF, Mikkelsen JD, Gerdes C, Jensen PH (1997) Isoform-specific binding of human apolipoprotein E to the non-amyloid beta component of Alzheimer's disease amyloid. Brain Res Mol Brain Res 44: 105-112. [crossref]
- Deelen J, Beekman M, Uh HW, Broer L, Ayers KL, et al. (2014) Genome-wide association meta-analysis of human longevity identifies a novel locus conferring survival beyond 90 years of age. Hum Mol Genet 23: 4420-4432. [crossref]
- Kim DH, Yeo SH, Park JM, Choi JY, Lee TH, et al. (2014) Genetic markers for diagnosis and pathogenesis of Alzheimer's disease. Gene 545: 185-193. [crossref]
- Roses AD (2010) An inherited variable poly-T repeat genotype in TOMM40 in Alzheimer disease. Arch Neurol 67: 536-541. [crossref]
- Roses AD, Lutz MW, Amrine-Madsen H, Saunders AM, Crenshaw DG, et al. (2010) A TOMM40 variable-length polymorphism predicts the age of late-onset Alzheimer's disease. Pharmacogenomics J 10: 375-384. [crossref]
- Seshadri S, Fitzpatrick AL, Ikram MA, DeStefano AL, Gudnason V, et al. (2010) Genome-wide analysis of genetic loci associated with Alzheimer disease. JAMA 303: 1832-1840. [crossref]
- Ferencz B, Karlsson S, Kalpouzos G (2012) Promising Genetic Biomarkers of Preclinical Alzheimer's Disease: The Influence of APOE and TOMM40 on Brain Integrity. Int J Alzheimers Dis 2012: 421452. [crossref]
- Harold D, Abraham R, Hollingworth P, Sims R, Gerrish A, et al. (2009) Genome-wide association study identifies variants at CLU and PICALM associated with Alzheimer's disease. Nat Genet 41: 1088-1093. [crossref]
- Naj AC, Jun G, Beecham GW, Wang LS, Vardarajan BN, et al. (2011) Common variants at MS4A4/MS4A6E, CD2AP, CD33 and EPHA1 are associated with late-onset Alzheimer's disease. Nat Genet 43: 436-441. [crossref]
- Lambert JC, Heath S, Even G, Campion D, Sleegers K, et al. (2009) Genome-wide association study identifies variants at CLU and CR1 associated with Alzheimer's disease. Nat Genet 41: 1094-1099. [crossref]
- Lambert JC, Ibrahim-Verbaas CA, Harold D, Naj AC, Sims R, et al. (2013) Meta-analysis of 74,046 individuals identifies 11 new susceptibility loci for Alzheimer's disease. Nat Genet 45: 1452-1458. [crossref]
- Hollingworth P, Harold D, Sims R, Gerrish A, Lambert JC, et al. (2011) Common variants at ABCA7, MS4A6A/MS4A4E, EPHA1, CD33 and CD2AP are associated with Alzheimer's disease. Nat Genet 43: 429-435. [crossref]
- Reitz C (2015) Genetic diagnosis and prognosis of Alzheimer's disease: challenges and opportunities. Expert Rev Mol Diagn 15: 339-348. [crossref]
- Rogaeva E, Meng Y, Lee JH, Gu Y, Kawarai T, et al. (2007) The neuronal sortilin-related receptor SORL1 is genetically associated with Alzheimer disease. Nat Genet 39: 168-177. [crossref]
- Reitz C, Mayeux R (2010) Use of genetic variation as biomarkers for mild cognitive impairment and progression of mild cognitive impairment to dementia. J Alzheimers Dis 19: 229-251. [crossref]
- Nuutinen T, Suuronen T, Kauppinen A, Salminen A (2009) Clusterin: a forgotten player in Alzheimer's disease. Brain Res Rev 61: 89-104. [crossref]
- Wollmer MA, Sleegers K, Ingelsson M, Zekanowski C, Brouwers N, et al. (2007) Association study of cholesterol-related genes in Alzheimer's disease. Neurogenetics 8: 179-188. [crossref]
- Pant S, Sharma M, Patel K, Caplan S, Carr CM, et al. (2009) AMPH-1/Amphiphysin/Bin1 functions with RME-1/Ehd1 in endocytic recycling. Nat Cell Biol 11: 1399-1410. [crossref]
- Tebar F, Bohlander SK, Sorkin A (1999) Clathrin assembly lymphoid myeloid leukemia (CALM) protein: localization in endocytic-coated pits, interactions with clathrin, and the impact of overexpression on clathrin-mediated traffic. Mol Biol Cell 10: 2687-2702. [crossref]
- Griciuc A, Serrano-Pozo A, Parrado AR, Lesinski AN, Asselin CN, et al. (2013) Alzheimer's disease risk gene CD33 inhibits microglial uptake of amyloid beta. Neuron 78: 631-643. [crossref]
- Guerreiro R, Hardy J (2014) Genetics of Alzheimer's disease. Neurotherapeutics 11: 732-737. [crossref]
- Crehan H, Holton P, Wray S, Pocock J, Guerreiro R, et al. (2012) Complement receptor 1 (CR1) and Alzheimer's disease. Immunobiology 217: 244-250. [crossref]
- McGeer PL, Kawamata T, Walker DG (1992) Distribution of clusterin in Alzheimer brain tissue. Brain Res 579: 337-341. [crossref]
- Yamazaki T, Masuda J, Omori T, Usui R, Akiyama H, et al. (2009) EphA1 interacts with integrin-linked kinase and regulates cell morphology and motility. J Cell Sci 122: 243-255. [crossref]
- Sakamoto A, Sugamoto Y, Tokunaga Y, Yoshimuta T, Hayashi K, et al. (2011) Expression profiling of the ephrin (EFN) and Eph receptor (EPH) family of genes in atherosclerosis-related human cells. J Int Med Res 39: 522-527. [crossref]
- Holen HL, Nustad K, Aasheim HC (2010) Activation of EphA receptors on CD4+CD45RO+ memory cells stimulates migration. J Leukoc Biol 87: 1059-1068. [crossref]
- Lehtonen S, Zhao F, Lehtonen E (2002) CD2-associated protein directly interacts with the actin cytoskeleton. Am J Physiol Renal Physiol 283: 734-743. [crossref]
- Dustin ML, Olszowy MW, Holdorf AD, Li J, Bromley S, et al. (1998) A novel adaptor protein orchestrates receptor patterning and cytoskeletal polarity in T-cell contacts. Cell 94: 667-677. [crossref]
- Chan SL, Kim WS, Kwok JB, Hill AF, Cappai R, et al. (2008) ATP-binding cassette transporter A7 regulates processing of amyloid precursor protein in vitro. J Neurochem 106: 793-804. [crossref]
- Tanaka N, Abe-Dohmae S, Iwamoto N, Yokoyama S (2011) Roles of ATP-binding cassette transporter A7 in cholesterol homeostasis and host defense system. J Atheroscler Thromb 18: 274-281. [crossref]
- Reitz C, Jun G, Naj A, Rajbhandary R, Vardarajan BN, et al. (2013) Variants in the ATP-binding cassette transporter (ABCA7), apolipoprotein E ϵ4,and the risk of late-onset Alzheimer disease in African Americans. JAMA 309: 1483-1492. [crossref]
- Ridge PG, Mukherjee S, Crane PK, Kauwe JS; Alzheimer’s Disease Genetics Consortium (2013) Alzheimer's disease: analyzing the missing heritability. PLoS One 8: e79771. [crossref]
- Jonsson T, Stefansson K (2013) TREM2 and neurodegenerative disease. N Engl J Med 369: 1568-1569. [crossref]
- Yaghmoor F, Noorsaeed A, Alsaggaf S, Aljohani W, Scholtzova H, et al. (2014) The Role of TREM2 in Alzheimer's Disease and Other Neurological Disorders. J Alzheimers Dis Parkinsonism 4. [crossref]
- Guerreiro R, Hardy J (2013) TREM2 and neurodegenerative disease. N Engl J Med 369: 1569-1570. [crossref]
- Guerreiro RJ, Lohmann E, Brás JM, Gibbs JR, Rohrer JD, et al. (2013) Using exome sequencing to reveal mutations in TREM2 presenting as a frontotemporal dementia-like syndrome without bone involvement. JAMA Neurol 70: 78-84. [crossref]
- Krabbe G, Halle A, Matyash V, Rinnenthal JL, Eom GD, et al. (2013) Functional impairment of microglia coincides with Beta-amyloid deposition in mice with Alzheimer-like pathology. PLoS One 8: e60921. [crossref]