Background: Genetic factors related to hypertension may affect the course of IgA nephropathy (IgAN) and partially explain its clinical variability. Aim of the study was to evaluate the role of hypertension and positive family history for hypertension on progression in a large number of IgAN patients with normal renal function or mild chronic renal insufficiency (CRI) at the time of renal biopsy.
Methods: From 411 IgAN patients, we selected 238 subjects with serum creatinine £ 1.4 mg/dl at the time of diagnosis classified as progressors (progressive renal failure or end-stage renal disease) or non-progressors (normal renal function after at least a 8-year-follow-up from onset).
Results: The number of 1st degree hypertensive relatives was associated with negative outcome (c2 = 7.17, p = 0.028) and with a faster progression rate (computed as the slope of creatinine clearance calculated according to Cockroft and Gault formula with time, F=5.14, p = 0.006). Logistic regression analysis showed that IgAN outcome was independently affected by serum creatinine at the time of biopsy, proteinuria and the number of 1st degree hypertensive relatives. Multiple regression analysis confirmed the independent role of the number of 1st degree hypertensive relatives and urinary protein excretion at the time of biopsy alone on progression rate.
Conclusions: Genetic load for hypertension is an independent risk factor for progression in IgAN.
IgA nephropathy, hypertension, familial predisposition, chronic renal insufficiency, proteinuria, progression
IgA Nephropathy (IgAN) has a variable outcome, with end-stage renal disease (ESRD) occurring in 5-25% of cases within ten years [1-6]. A number of clinical and histological prognostic factors, which could predict the evolution of the disease, have been identified [1-9].
However, it remains difficult to predict the long-term renal outcome in individual patients.
Genetic factors may partially explain this clinical variability. Previous studies have disclosed a role of inherited predisposition to hypertension in the susceptibility to diabetic nephropathy [10,11] and in influencing its progression towards chronic renal failure (CRF) [12]. An increased frequency of parental hypertension has been reported also in patients with glomerulonephritis, with respect to the general population. Some, [6,13,14], but not all [15] have reported that, besides hypertension, positive family history for hypertension affects renal outcome. Such studies were performed on a small number of individuals [13,14] or in heterogeneous cohorts including patients with advanced renal failure at presentation [6].
Aim of this study was to evaluate the role of genetic predisposition to hypertension on the progression of IgAN in a large number of patients with normal renal function or mild/initial CRF at the time of renal biopsy.
Subjects
From a cohort of 411 biopsy-proven primary IgAN patients, we studied retrospectively 238 subjects (166 males and 72 females) with normal or slightly reduced renal function at the time of renal biopsy (serum creatinine £ 1.4 mg/dl). Patients whit serum creatinine increasing < 0.2 mg/dl during observation were included if they had a follow-up ≥ 8 years. Caucasian patients of Italian origin and biopsy-proven idiopathic IgAN were selected between 1993 and 2003 from several Nephrology Departments of North Italy and regularly followed up (at least once a year). The average follow-up after clinical evidence of disease was 12.15 ± 6.20 years, ranging from 1 to 37 years, while that after renal biopsy was 9.35 ± 5.31 years, ranging from 0 to 27 years.
Hypertension was defined as blood pressure >140/90 mmHg or taking antihypertensive therapy. Family history for hypertension was obtained by direct interview and defined as positive in the presence of one or more first degree hypertensive relatives with onset of hypertension before 60 years of age. A score was computed (0 = no 1st degree hypertensive relatives, 1 = one 1st degree hypertensive relative; 2 = two or more than two 1st degree hypertensive relatives).
The rate of progression towards CRF was estimated by the slope of yearly values of creatinine clearance (CrCl) calculated with Cockroft and Gault formula against time [16].
Statistical analyses
Given the extreme variability of IgAN course, with some patients remaining stable for decades, others progressing very slowly but eventually reaching ESRD and others displaying very fast progression rates, we decided to clearly separate outcome (qualitative variable) from progression rate (quantitative variable).
Differences in frequencies in patient groups were tested using the 2 test. Continuous data were analyzed with Student’s t-test for unpaired data, with one-way ANOVA and with multiple regression. Logistic regression analysis was performed using the outcome (progressors vs. non-progressors) as dependent variable.
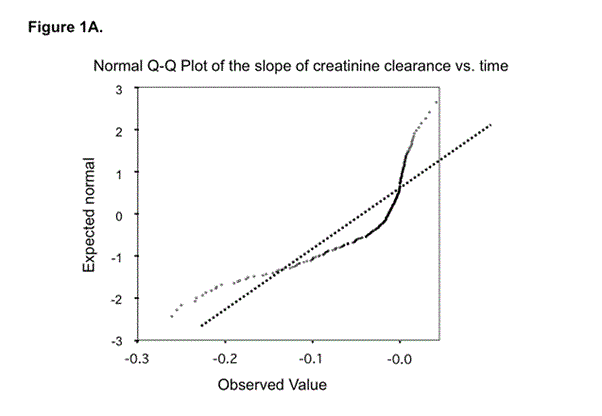
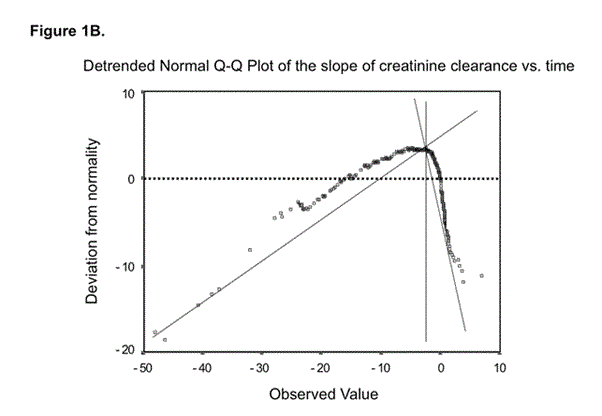
As the distribution of progression rate was not normal, the presence of commingling distributions was assessed with the Liliefors test and the method of Day [17,18]. In order to provide a graphical representation of the distribution, we used probit analysis. With probit analysis, each observed value is paired with its expected value from the normal distribution, which is based on the number of cases in the sample and the rank order of the case in the sample. If the sample is from a normal distribution, the points are expected to fall more or less on a straight line. Visually it is more practical to look at the detrended plot, which expresses the difference between observed and expected values. This plot is constructed in the same way as the standard normal probability plot, except that before the plot is generated, the linear trend is removed. This often "spreads out" the plot, thereby allowing the user to detect patterns of deviations more easily.
A p value £ 0.05 was considered as significant. SPSS (ver.11) statistical software on an Apple Macintosh G5 personal computer was used for the analysis.
Among 411 patients, 173 were excluded because of inadequate follow-up (n = 11), CRF at the time of renal biopsy (n = 116), or incomplete data set (n = 46); 238 patients satisfied the inclusion criteria. Patients had been submitted to renal biopsy between 1970 and 1999 because of one or more of the following: microscopic hematuria and proteinuria (n = 110, 46.2%), gross hematuria (n = 104, 43.6%), isolated microscopic hematuria (n = 11, 4.6%), nephrotic syndrome (n = 4, 1.7%), nephritic syndrome (n = 4, 1.7%), unknown (n = 5, 2.2%).
Seventy-four (31%) patients were hypertensive at the time of renal biopsy.
A positive family history of hypertension was highly prevalent since 115 out of 238 (48%) had one or more first-degree hypertensive relatives.
Distribution of progression rate
Figure 1 depicts the normal probability plot (A) and the detrended normal probability plot (B) of the distribution of the slope of CrCl over time. Visual inspection of the normal probability plot (Figure 1A) indicates that the distribution of the slope of CrCl with time is not normal. Figure 1B, which contains the detrended plot, shows the existence of two different sub-populations. This was confirmed by the Lilliefors test, which was highly significant for the non-normality of the distribution (p= 1 x 10-32). The method of Day [17] showed that the data were better described by two commingling than by one individual distribution (c2 with one degree of freedom = 172.07, p < 0.0001; first mode at -0.56 ± 1.18 ml min-1 year-1; second mode at -8.18 ± 8.53 ml min-1 year-1) and that the point of minimum of the two commingling distributions coincided with the break point of the detrended plot at around -3 ml/min/year.
Outcome definitions
Outcome was defined arbitrarily on the basis of the distribution of progression rate. As the point of intersection of the two commingling distributions was at 3 ml min-1 year-1 we defined as non progressors those falling in the first mode (n = 155) and as progressors the others (n = 83) (Figure 1B).

Figure 1a. In this plot, each observed value is paired with its expected value from the normal distribution, which is based on the number of cases and their rank order in the sample. If the sample comes from a population with a normal distribution, the points fall more or less on a straight line; this plot clearly shows that data deviate from the line and thus are not normally distributed

Figure 1b. The detrended plot also expresses the difference between observed and expected values from the normal distribution, but allows a more easy detection of patterns of deviations. If the sample is from a normal population, the data points are expected to cluster around a horizontal line through 0. This plot clearly indicates a non-normal distribution. The point of minimum of the two commingling distributions coincides with the break point of the detrended plot at around 3 ml/min year loss of GFR (calculated by the method of Day (17).
Patient characteristics according to progression
Anthropometric, clinical and laboratory data at the time of renal biopsy according to progression are summarized in Table 1.
Table 1. Clinical parameters and laboratory data at the time of renal biopsy. Significances are computed as exact value (0.0001 is p = 0.0001 or less).
Variable |
Non-Progressors |
Progressors |
Significance |
Gender (M/F) |
106/49 |
60/23 |
NS |
Age at onset (years)a |
30.42 ± 13.7 |
29.7 ± 12.7 |
NS |
Age at biopsy (years)a |
33.7 ± 13.9 |
31.8 ± 13.4 |
NS |
BMI (kg/m2)a |
24.8 ± 3.6 |
24.0 ± 3.9 |
NS |
SBP (mmHg)a,b |
130.9 ± 15.3 |
136.1 ± 17.4 |
<0.05 |
DBP (mmHg)a,c |
82.7 ± 10.5 |
86.5 ± 12.1 |
<0.05 |
Hypertension |
34/155 (22%) |
40/83 (48%) |
< 0.0001 |
Antihypertensive therapy (N) |
27 (18%) |
17 (38%) |
NS |
Onset: gross haematuria (N) |
79 (51%) |
25 (30%) |
<0.05 |
Onset: microhaematuria / proteinuria (N) |
67 (43.2 %) |
43 (52%) |
<0.05 |
Years after onseta |
13.63 ± 6.09 |
9.01± 5.01 |
< 0.0001 |
Serum creatinine (mg/dl) |
1.01 ± 0.17 |
1.11 ± 0.18 |
< 0.0001 |
CrCl (ml/min) |
98.34 ± 26.54 |
86.59 ± 21.78 |
< 0.0001 |
Slope of CrCl vs. time (ml min-1year-1)a,d |
-0.16 ± 2.64 |
-11.39 ± 8.67 |
< 0.0001 |
Proteinuria (g/24h)a |
0.88 ± 0.84 |
2.00 ± 1.37 |
< 0.0001 |
Serum cholesterol (mg/dl)a |
206.6 ± 50.3 |
213.2 ± 52.2 |
NS |
Serum triglycerides (mg/dl)a |
119.0 ± 68.4 |
150.7 ± 125.5 |
<0.05 |
Serum IgA (mg/dl)a |
358.0 ± 140.1 |
391.7 ± 123.1 |
NS |
aValues are expressed as means ± SD; bSBP, systolic blood pressure; cDBP, diastolic blood pressure; dCrCl, creatinine clearance measured with Cockroft-Gault formula
The onset of the nephropathy with gross hematuria was more frequent in non-progressors (c 2 = 5.8, p = 0.016). Conversely, progressors had significantly higher proteinuria, higher serum creatinine and larger prevalence of hypertension at the time of renal biopsy. Blood pressure and triglycerides were also significantly higher.
The percentage of patients treated with ACE inhibitors was significantly lower in non-progressors than in progressors (62 out of 111 vs. 37 out of 47, respectively; c2 = 7.38, p = 0.007). Similar findings were obtained about steroids (29 out of 111 vs. 24 out of 47, respectively; c2 = 9.21, p = 0.002). Unfortunately, this information was available only in 158 patients.
Inherited predisposition for hypertension and outcome
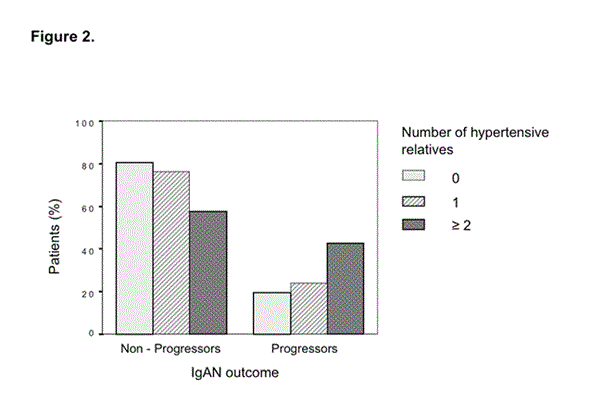
The number of first-degree hypertensive relatives was associated with poorer outcome (c2 = 7.17, p = 0.028). The percentage of progressors increased in the presence of one or more than one hypertensive relatives, while non-progressors behaved in the opposite way (Figure 2).

Figure 2. IgAN outcome (non-progressors vs. progressors) and the number of 1st degree of hypertensive relatives. The relative frequency of progressors increased in the presence of one or more than one hypertensive relatives, while the relative frequency of non-progressors behaved in the opposite way (c2 = 7.17, p = 0.028).
A positive family history for hypertension was also related with the presence of hypertension at the time of renal biopsy (c2 = 3.85; p = 0.05).
Inherited predisposition to hypertension and progression rate
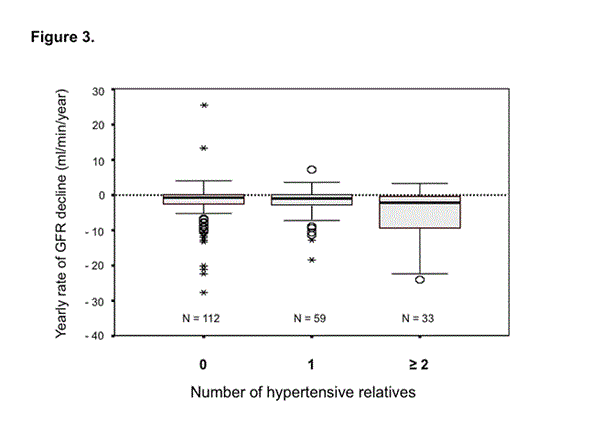
Patients without hypertensive relatives had a significantly lower rate of progression than patients with one or more than one hypertensive relative (-3.32 ± 6.85, -3.70 ± 5.78 and -7.5 ± 11.64 ml min-1year-1, respectively; F = 5.14, p = 0.006) (Figure 3).

Figure 3. Rate of progression towards CRF (calculated as the slope of CrCl against time) and the number of 1st degree hypertensive relatives. The lines crossing the boxes indicate median values; boxes show the interquartile range containing 50% of the values. The whiskers at the ends of the boxes show the distance from the end of the box to the largest and smallest observed values that are less than 1.5 box lengths from either end. Patients without any 1st degree hypertensive relative had a significantly lower rate of progression than that of patients with one or more than one hypertensive relatives (F = 5.14, p = 0.006).
Multiple and logistic regression analyses
Clinical variables known to be associated with IgAN outcome and the number of 1st degree hypertensive relatives were entered as independent variables in a multiple regression model, with progression rate as the dependent one. The number of 1st degree hypertensive relatives, together with proteinuria at the time of renal biopsy, contributed independently to progression rate while hypertension, triglycerides, serum creatinine at the time of renal biopsy, and onset with gross hematuria did not (Table 2).
Table 2. Stepwise multiple regression analysis with the slope of creatinine clearance against time as the dependent variable.
| Variable |
B |
SE B |
T |
p |
Variables in the equation |
|
Proteinuria at biopsy |
-0.011 |
0.004 |
-2.616 |
0.01 |
N° hypertensive relatives |
-0.013 |
0.006 |
-2.178 |
0.031 |
Variables not in the equation |
|
Hypertension at biopsy |
-0.01 |
0.01 |
-0.969 |
0.334 |
Onset with gross hematuria |
0.0005 |
0.01 |
0.056 |
0.955 |
Serum creatinine at biopsy |
0.0146 |
0.019 |
0.784 |
0.434 |
Serum triglycerides at biopsy |
0 |
0 |
-0.708 |
0.48 |
Progression rate was also considered as a dichotomous factor (non progressors vs. progressors) and analyzed with binomial logistic regression (Table 3). Proteinuria and the number of hypertensive relatives, together with serum creatinine at biopsy, significantly and independently influenced a negative outcome.
Table 3. Logistic regression analysis with IgAN outcome as the dependent variable
Variable |
B |
SE B |
Significance |
Variables in the equation |
|
|
|
Proteinuria at biopsy |
0.741 |
0.192 |
<0.001 |
|
|
|
|
N° hypertensive relatives |
0.54 |
0.252 |
0.032 |
Serum creatinine at biopsy |
2.926 |
0.958 |
0.002 |
|
|
|
|
Variables not in the equation |
|
|
|
Hypertension at biopsy |
-0.337 |
0.433 |
0.436 |
Onset with gross hematuria |
0.286 |
0.414 |
0.489 |
2021 Copyright OAT. All rights reserv
Serum IgA at biopsy |
0.001 |
0.001 |
0.197 |
Even if the use of ACE inhibitors and steroids was not systematic in our sample, we tested the effect of these treatments in the multiple regression model and in the logistic regression analysis, but no independent effect was observed (data not shown).
Several studies have shown that hypertension is associated with progression towards renal failure in IgAN [1,3-9]. However, these studies considered a substantial number of individuals who had already developed CRF. Since renal failure may cause hypertension and hence confound the results, we considered only individuals with normal or only slightly decreased renal function at the time of diagnosis.
We found a positive relationship between an inherited predisposition to hypertension with poorer outcome and faster progression rate of IgAN.
It has been proposed that parental hypertension is more prevalent in patients with glomerulonephritis [13] or IgAN [6] than in the general population, but its role as predictor of poor outcome, and in particular of progression rate, has not been clearly elucidated previously. To our knowledge, only three studies have looked for association between outcome and family history of hypertension in patients with IgAN [6,14,15]. One was negative (most likely underpowered) [15]; all considered smaller and heterogeneous samples. None studied the association between familial hypertension and progression rate.
The role of positive family history of hypertension (independently from hypertension) is reinforced by the results of multivariate analysis, showing that familial hypertension contributes independently to progression rate whereas hypertension at the time of biopsy did not. This suggests a link between genetic factors for hypertension and progression rate.
The underlying mechanisms by which familial determinants of hypertension contribute to renal damage remain to be determined. We may speculate that the pleiotropic effect of some (not necessarily known) gene, which determines hypertension in healthy individuals, may increase progression rate in the presence of IgAN even before hypertension develops. Given the important effects of hypertension and the renin-angiotensin system (RAS) on progression of chronic renal disease, in recent years the polymorphism of hypertension associated genes have been largely studied in patients with IgAN, but available data do not support a major role of the RAS genes on IgAN progression [19-21].
As already described by previous studies (1-6,11), we confirm the important and independent role of proteinuria at the time of renal biopsy in influencing the rate of progression of the disease towards renal failure, also when patients are considered at the beginning of renal function decline. On the contrary, higher serum creatinine levels at the time of renal biopsy independently influenced the outcome of the disease, but not its rate of progression. This aspect has been little investigated previously [1-4,6].
ACE inhibitors or steroids were given more frequently in progressors. This paradoxical finding is likely due to the fact that patients with more severe presentation or course of the disease were given these agents more often to reduce proteinuria and/or hypertension. The retrospective design of our study, which covered a very long period of time, large differences among doses and lengths of treatments, and data incompleteness in a number of patients limit this analysis.
In conclusion, this study strongly suggests a link between genetic factors possibly related to hypertension and progression of IgAN. Further studies are needed to elucidate the role of known or newly discovered genes affecting blood pressure in the progression of IgAN.
We would like to thanks Dr. Arturo Ragni for his valuable contribution to data collection when he had been working in the Department of Nephrology and Dialysis, San Carlo Borromeo Hospital, Milan, Italy
This work was supported, in part, by Telethon Grant EC 861 to DC. The authors have no conflict of interest to declare.
The Authors declare that the results presented in this paper have not been published previously in whole or part, except in abstract format.
- D'Amico G (2000) Natural history of idiopathic IgA nephropathy: role of clinical and histological prognostic factors. Am J Kidney Dis 36: 227-237. [Crossref]
- Koyama A, Igarashi M, Kobayashi M (1997) Natural history and risk factors for immunoglobulin A nephropathy in Japan. Research Group on Progressive Renal Diseases. Am J Kidney Dis 4: 526-532. [Crossref]
- Alamartine E, Sabatier JC, Guerin C, Berliet JM, Berthoux F (1991) Prognostic factors in mesangial IgA glomerulonephritis: an extensive study with univariate and multivariate analyses. Am J Kidney Dis 18: 12-19. [Crossref]
- Ibels LS, Gyory A (1994) IgA nephropathy: Analysis of the natural history, important factors in the progression of renal disease and a review of the literature. Medicine 73: 79-102. [Crossref]
- Radford MG Jr, Donadio JV Jr, Bergstralh EJ, Grande JP (1997) Predicting renal outcome in IgA nephropathy. J Am Soc Nephrol 8: 199-207. [Crossref]
- Li PK, Ho KK, Szeto CC, Yu L, Lai FM (2002) Prognostic indicators of IgA nephropathy in the Chinese--clinical and pathological perspectives. Nephrol Dial Transplant 17: 64-69. [Crossref]
- Syrjänen J, Mustonen J, Pasternack A (2000) Hypertriglyceridaemia and hyperuricaemia are risk factors for progression of IgA nephropathy. Nephrol Dial Transplant 15: 34-42. [Crossref]
- Wakai K, Kawamura T, Endoh M, Kojima M, Tomino Y, et al. (2006) A scoring system to predict renal outcome in IgA nephropathy: from a nationwide prospective study. Nephrol Dial Transplant 21: 2800-2808. [Crossref]
- Rekola S, Bergstrand A, Bucht H (1990) Development of hypertension in IgA nephropathy as a marker of a poor prognosis. Am J Nephrol 10: 290-295. [Crossref]
- Viberti GC, Keen H, Wiseman MJ (1987) Raised arterial pressure in parents of proteinuric insulin dependent diabetics. Br Med J (Clin Res Ed) 295: 515-517. [Crossref]
- Krolewski AS, Canessa M, Warram JH, Laffel LM, Christlieb AR, et al. (1988) Predisposition to hypertension and susceptibility to renal disease in insulin-dependent diabetes mellitus. N Engl J Med 318: 140-145. [Crossref]
- Breyer JA, Bain RP, Evans JK, Nahman NS Jr, Lewis EJ, et al. (1993) Predictors of the progression of renal insufficiency in patients with insulin-dependent diabetes and overt diabetic nephropathy. Kidney Int 50: 1651-1658. [Crossref]
- Schmid M, Meyer S, Wegner R, Ritz E (1990) Increased genetic risk of hypertension in glomerulonephritis? J Hypertens 8: 573-577. [Crossref]
- Autuly V, Laruelle E, Benziane A, Ang KS, Cam G, et al. (1991) Increased genetic risk of hypertension in immunoglobulin A nephropathy but not in membranous nephropathy. J Hypertens Suppl 9: S220-221. [Crossref]
- Geddes CC, Warwick GL, Tulloch I, Boulton-Jones JM (1997) The influence of familial factors on the progression of IgA nephropathy. Nephrol Dial Transplant 12: 1963-1967. [Crossref]
- Cockcroft DW, Gault MH (1976) Prediction of creatinine clearance from serum creatinine. Nephron 16: 31-41. [Crossref]
- Day NE (1971) Estimating the components of a mixture of normal distribution. Biometrika 56: 463-479.
- Cusi D, Fossali E, Piazza A, Tripodi G, Barlassina C, et al. (1991) Heritability estimate of erythrocyte Na-K-Cl cotransport in normotensive and hypertensive families. Am J Hypertens 4: 725-734. [Crossref]
- Pei Y, Scholey J, Thai K, Suzuki M, Cattran D (1997) Association of angiotensinogen gene T235 variant with progression of immunoglobin A nephropathy in Caucasian patients. J Clin Invest 100: 814-820. [Crossref]
- Frimat L, Philippe C, Maghakian MN, Jonveaux P, Hurault de Ligny B, et al. (2000) Polymorphism of angiotensin converting enzyme, angiotensinogen and angiotensin II type 1 receptor genes and end-stage renal failure in IgA nephropathy: IGARAS- a study of 274 men. J Am Soc Nephrol 11: 2062-2067. [Crossref]
- Kim SM, Chin HJ, Oh YK, Kim YS, Kim S, et al. (2009) Blood pressure-related genes and the progression of IgA nephropathy. Nephron Clin Pract 113: c301-308. [Crossref]


