Abstract
This work documents the spread of a new type of infectious-like outbreak leading to a step-increase in emergency medical admissions. It employs a running 12 month sum of emergency medical admissions to detect step-like changes in admissions from small areas, namely Mid Super Output Area (MSOA) geographical areas and from GP practice enrolled patients. A general 25% step-like increase in emergency medical admissions occurred around November of 2008 in North East Essex due to gradual spatial spread of an infectious-like agent. Earliest incidence seems to be around August 2007 at a GP surgery in the Castle ward of Colchester leading to a21% increase in medical admissions. The next major incidence appears to be around January of 2008 at a GP Surgery in the Shrub End ward of Colchester with a 32% increase in admissions. Sporadic occurrences can be seen in April and May of 2008 in four small areas with21% to 65% increases in medical admissions. The major outbreak occurred in October, November and December of 2008, hence the apparent November 2008 date seen in the aggregated data for the entire area. Further sporadic spread continues through to October 2009. Several small areas appear to have escaped the outbreak, notably a rural GP practice in the village of Lawford and an area of Colchester dominated by student bed sits. More deprived elderly communities represent the social groups most affected. The outbreak shows strong age dependence which is reminiscent of what is termed ‘original antigenic sin’, i.e. age at first exposure to a strain of an infectious agent determines the quality of the immune response to later exposure to different strains of the same agent. There is evidence to suggest that residents of nursing homes are affected earlier and more strongly than others while those who die in hospital show only a modest increase, i.e. the infection generally leads to sustained poor health rather than death. Analysis of the primary diagnoses for those admitted to hospital strongly suggests that the agent may be the common herpes virus cytomegalovirus and this is consistent with the apparent time cascade in disease which emanates out of each outbreak. Other explanations may be possible. These findings have profound public health implications regarding the infectious origin of disease, to the funding formula used to distribute health care funds both in the UK and elsewhere and to the interpretation of age-standardized admission rates for medical admissions.
Keywords
new disease, medical hospital admission, age dependence, social groups, disease spread, infectious outbreak, cytomegalovirus,North East Essex,England
Abbreviations
CMV: Cytomegalovirus; CRP: C-Reactive Protein; DH: Department of Health;GP: General Practitioner;HRG: Healthcare Resource Group;LA: Local Authority;LSOA: Lower Super Output Area;MAU: Medical Assessment Unit;MSOA: Mid Super Output Area;OA: Output Area;OAC: Output Area Classification;ONS: Office of National Statistics;PCT: Primary Care Trust (a PCT is a PCO);PCO: Primary Care Organisation; UK: United Kingdom;USA: United States of America
Introduction
A series of long-term cycles appear to characterize the behavior of emergency medical admissions across the UK and elsewhere in the Western world[1-3]. Each cycle is composed of local infectious-like outbreaks which nest up over wider areasto give the appearance of a cycle at larger regional or national level. Each outbreak displays age and gender specific effects[4-7],and moves across the whole of the UK over a period of one to two years and are associated with sudden and unexpected increases in deaths, emergency department attendances and health care costs[3,4,8-10]sufficient to create a long-term cycle in NHS surplus and deficit[11,12] and also appear to initiate a parallel cycle in the gender ratio at birth[13].
There are two suggested reasons for these infectious-like events. The first suggests that the events are merely the result of acute hospitals changing their threshold to admission[14], while the second suggests that this is a genuine infectious outbreak of a relatively slow to transmit persistent virus[1-12].It does need to be pointed out that the first hypothesis cannot explain the increase in deaths or the cycle in the gender ratio at birth, however, it is possible to test these two hypotheses using the geographic area of a single hospital where the flow of patients is restricted to the hospital due to natural barriers to travel.
Such a situation exists in North East Essex, part of the larger East of England region. The population reside in threeseaside townships of Harwich, Frinton-on-sea and Clacton-on-sea and in Colchester, a larger inland town which contains the main acute hospital. All roads converge on Colchester due natural barriers to travel provided by the estuary of the Clone to the south,estuary of the Stour to the north and the North Sea to the east. Surrounding countryside is largely dedicated to agriculture with a scattering of small villages and hamlets. Hence we have an ideal location in which to evaluate if hospital thresholds to admission or an infectious spread account for an unexpected increase in medical admissions which commenced in 2007 across the UK[3,7-9].
In England all census data and resulting social classification of the population commences at the level of an output area (OA) containing roughly 300 head of population. Each OA is assigned to an output area classification (OAC) which consists of 7 supergroups, 21 groups, and 52 subgroups which area social classification constructed from 41 census variables. Each OA then nests up to a lower super output area (LSOA), to mid super output area (MSOA), to Parish, to Ward, to Local Authority and then to government or Health Service regions.Primary Care Organisations (PCOs) usually have a geography matching one or two Local Authority areas. Each Local Authority typically contains more than 100,000 head of population and in this respect NE Essex comprises two local authority areas of Colchester (population 170,000) and Tendring (150,000),serviced by 44 General Practitioner (GP) practices. Only 54% of the population lives in an urban area compared to 73% for England,and life expectancy at birth is only one year lower than the England average due to some pockets of high deprivation in some of the sea-side towns[15].
This study goes beyond the previous large area studies[1,3-7,10], and moves the analysis of these events down to the small area of an English MSOA (roughly 5,000 head of population) to demonstrate small area spread consistent with an infectious event.
Methods
Data for emergency (non-elective) admissions was supplied by the former North East Essex Primary Care Trust (PCT) and covers monthly admissions for the residents of NE Essex over the period April 2005 to May 2010.Data did not contain patient identifiable features such as name, address, and postcode, date of birth or NHS number. Emergency (non-elective)admissions to the medical group of specialties were analyzed as a single cluster and include general medicine (42%), elderly medicine (33%), cardiology (9%), thoracic medicine (6%), gastroenterology (4%), oncology (3%), nephrology (1%) and other smaller medical specialties. Monthly trends for adult emergency medical admissions with a length of stay of one night or more were constructed andanalyzed in a number of ways. In the first, all admissions at OA level were assigned into 17 concentric rings at 1 km intervals centered on the acute hospital in Colchester.The straight line distance of the population centroid of each OA to the hospital was calculated and this distance was used to allocate the admissions into the concentric rings. The aggregated data for each ring was available for analysis in this study. In the second method the admission trends in the largest MSOA were studied.In the third, all admissions were aggregated at the level of GP practice and trends for thelargest practices were studied. Lastly data at OA level was aggregated to one of the 52 sub-groups in the Office of National Statistics (ONS) Output area classification (OAC) which are social groupings based on census data. The 2001 OA’s and associated OAC’s were obtained from the ONS. The OA code was then deleted and only the larger OAC aggregates were studied. None of the four methods involved patient identifiable aggregates, as discussed above, and the geographic units generally contained more than 100 admissions per annum to the wider medical group of specialties. Analysis of aggregates with less than 100 admissions is also not desirable from a statistical point of viewsince Poisson variation can act as a confounding factor in the analysis.
The potential contribution from Poisson variation to the value of any step-change was evaluated using Monte Carlo simulation of the ratio of two Poisson distributions. The 97.5% confidence Interval (CI) was calculated with 200,000 trials using Oracle Crystal Ball for an annual total (N) of between 100 and 700 in increments of 100. The resulting 7 values were plotted using Microsoft Excel and follow a power function where 97.5% CI = (1.965 × N-0.0891)-1. This equation was then used to calculate the 97.5% CI associated with the step-increase observed in the various locations.Given the fact that a Poisson distribution becomes less skewed at higher numbers, when N> 1,000 then the 97.5% CI = 2.7 × n-0.5
One Figure in the results section presents actual monthly data which has been adjusted for the number of day per month and seasonal behavior. The seasonal (monthly) adjustment factors were calculated using the Solver function in Microsoft Excel to minimize the sum of the absolute difference between one month and the next in the adjusted monthly values.
Results
Trends were studied using running twelve month sums. Such a running twelve month sum avoids the need for complex analysis due to the seasonal nature of medical admissions. If demographic trends were the sole source of the admission behavior over time then such a running sum would generate a straight line whose slope would reflect approximately 1.0% to 1.5% per annum growth due to demographic shifts or what is known as the ageing population. In a running sum a step-change is transformed into a ramp. The base of the ramp marks the onset of the step-change and the ramp is only sustained if the step-change endures for 12 or more months.
Figure 1 presents the unusual situation confronted by the NE Essex PCT. Medical admissions had declined to a minimum by around March 2007, i.e. 12 months prior to March 2008 in the running sum trend, and continued at this low rate through to around November 2008 at which point there was a large and totally unanticipated 25% step increaseresulting in serious financial pressure and a large ensuing deficit[16,17].As can be seen there are no significant changes in any other specialty group other than general and elderly medicine and this argues against a hospital-wide reduction in the admission threshold or even a reduction in the threshold for admission through the emergency department. While the boundary between general and elderly medicine is somewhat fluid the average age is higher in elderly medicine. Note the slightly different time profiles between the two, especially the earlier larger step-down in elderly medicine. To give a statistical context to each of the trend lines the maximum possible Poisson-based variation is as follows (99.9% CI as a number and percentage): Trauma (±116, ±8%), All Others (±132, ±7%), Pediatrics (±141, ±7%), Surgery (±172, ±6%), General Medicine (±342, ±3%), Geriatric Medicine (±269, ±4%). While these statistical fluctuations can explain some of the small undulations seen in the non-medical specialty trends they are totally unable to explain the behavior in General and Elderly Medicine.
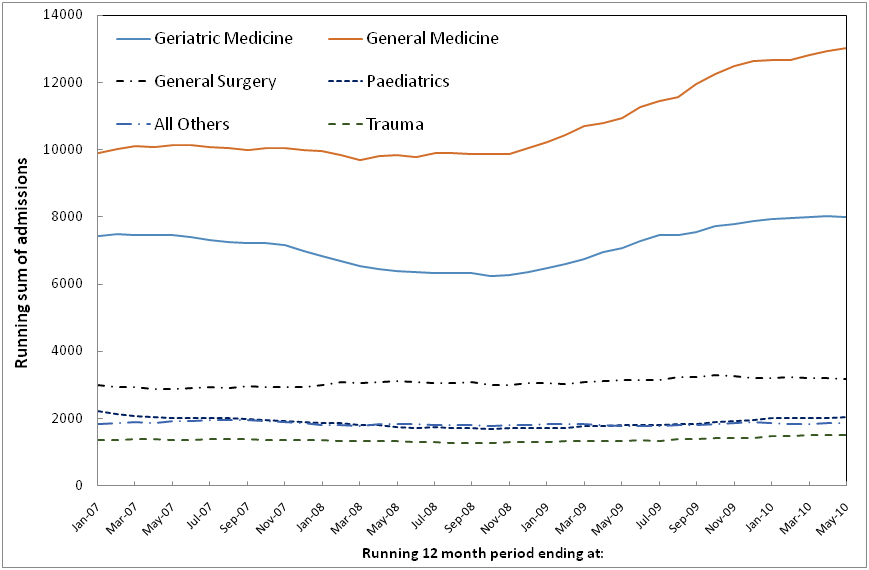
Figure 1.Running 12 month total trends in emergency admissions in North East Essex by specialty of admission.
Figure 2 examines the situation for the trends observed in the concentric rings surrounding the acute site in Colchester. In this Figure trends are relative to the minimum 12 month total in each ring. Exemplar trends have been selected, namely, lowest, middle and highest magnitude for the step change and earliest and latest point for the start of the step change.As can be seen there are a range of dates covering the initiation of the step-change and for the magnitude of the step-change.Table 1 presentsfurther details for each of the concentric rings including age, proportion female, number of admissions, the initiation date anddetails of the largest MSOA contained within the ring and the proportion of total admissions in the ringwhich occur in the largest MSOA.Note the wide range in the initiation date from June 2008 through to June 2009 and the variable extent of the step-change ranging from +13% through to +76%. Note that all step-increases in this table are statistically significant except for rings 12 and 18 which only contain around 100 admissions.
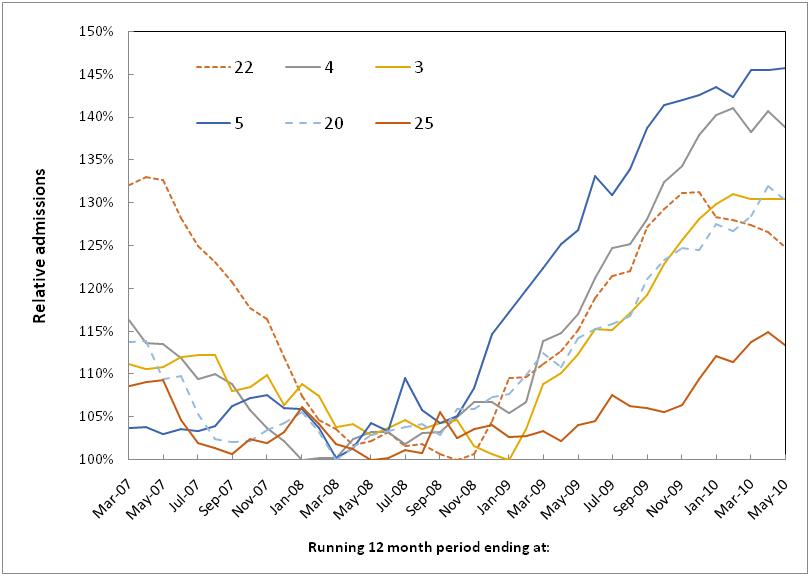
Figure 2.Step-like increase in admissions within the six rings with highest admissions.
|
Ring (km)
|
Age
|
Female (%)
|
Admissions
|
Initiation Date
|
Largest MSOA in ring
|
|
Average
|
STDEV
|
Mode
|
Minimum
|
Increase
|
97.5% CI
|
Largest MSOA
|
Proportion
|
|
14
|
72.3
|
23.3%
|
82
|
49.8%
|
598
|
35%
|
11%
|
Jun-08
|
Tendring 011B
|
22%
|
|
11
|
69.7
|
25.4%
|
78
|
49.8%
|
207
|
39%
|
22%
|
Jul-08
|
Tendring 009D
|
38%
|
|
15
|
72.5
|
23.0%
|
85
|
50.1%
|
533
|
18%
|
12%
|
Jul-08
|
Colchester 020A
|
18%
|
|
19
|
70.7
|
22.5%
|
77
|
49.7%
|
347
|
37%
|
17%
|
Aug-08
|
Tendring 007C
|
38%
|
|
5
|
67.9
|
28.4%
|
83
|
50.6%
|
970
|
35%
|
6%
|
Oct-08
|
Colchester 012C
|
12%
|
|
20
|
70.4
|
24.5%
|
76
|
50.2%
|
899
|
18%
|
7%
|
Oct-08
|
Tendring 018B
|
17%
|
|
2
|
66.8
|
29.7%
|
85
|
51.5%
|
1,020
|
30%
|
8%
|
Nov-08
|
Colchester 007A
|
11%
|
|
7
|
70.1
|
25.3%
|
87
|
49.7%
|
389
|
42%
|
16%
|
Nov-08
|
Tendring 005D
|
19%
|
|
22
|
74.0
|
23.3%
|
85
|
51.9%
|
1,311
|
30%
|
7%
|
Nov-08
|
Tendring 017D
|
16%
|
|
6
|
66.7
|
30.3%
|
81
|
49.8%
|
374
|
40%
|
16%
|
Dec-08
|
Colchester 012E
|
18%
|
|
8
|
73.3
|
23.4%
|
88
|
51.5%
|
268
|
52%
|
19%
|
Dec-08
|
Brabergh 009D
|
32%
|
|
17
|
71.8
|
24.1%
|
79
|
51.4%
|
89
|
76%
|
32%
|
Dec-08
|
Tendring 018E
|
83%
|
|
21
|
70.1
|
23.7%
|
74
|
50.5%
|
1,857
|
30%
|
6%
|
Dec-08
|
Tendring 018A
|
10%
|
|
26
|
74.5
|
21.2%
|
85
|
51.2%
|
767
|
25%
|
9%
|
Dec-08
|
Tendring 008H
|
30%
|
|
1
|
64.5
|
31.3%
|
87
|
50.3%
|
356
|
50%
|
16%
|
Jan-09
|
Colchester 004B
|
30%
|
|
12
|
73.2
|
22.7%
|
89
|
52.9%
|
102
|
16%
|
30%
|
Jan-09
|
Tendring 003F
|
93%
|
|
18
|
72.3
|
21.8%
|
71
|
50.8%
|
102
|
25%
|
30%
|
Jan-09
|
Tendring 018D
|
100%
|
|
3
|
67.1
|
28.8%
|
85
|
51.0%
|
1,027
|
30%
|
8%
|
Feb-09
|
Colchester 008D
|
10%
|
|
10
|
67.4
|
25.5%
|
88
|
49.4%
|
189
|
31%
|
23%
|
Feb-09
|
Colchester 019B
|
29%
|
|
23
|
74.4
|
20.8%
|
85
|
49.7%
|
559
|
27%
|
12%
|
Feb-09
|
Tendring 012B
|
24%
|
|
4
|
67.4
|
29.5%
|
82
|
50.9%
|
1,314
|
30%
|
7%
|
Feb-09
|
Colchester 008A
|
7%
|
|
9
|
68.4
|
26.1%
|
85
|
50.4%
|
184
|
34%
|
23%
|
Mar-09
|
Tendring 009A
|
49%
|
|
13
|
70.8
|
24.6%
|
80
|
49.8%
|
441
|
31%
|
14%
|
Mar-09
|
Tendring 009C
|
27%
|
|
24
|
73.4
|
20.6%
|
85
|
51.1%
|
549
|
48%
|
12%
|
Mar-09
|
Tendring 012A
|
34%
|
|
16
|
70.7
|
22.3%
|
78
|
49.9%
|
301
|
54%
|
18%
|
Apr-09
|
Tendring 011E
|
34%
|
|
25
|
74.9
|
20.8%
|
85
|
51.0%
|
943
|
13%
|
7%
|
Apr-09
|
Tendring 006B
|
14%
|
|
27+
|
67.6
|
29.2%
|
78
|
49.5%
|
307
|
40%
|
18%
|
Jun-09
|
Tendring 006C
|
35%
|
Table 1.Characteristics of 1 km concentric rings surrounding Colchester hospital, including population age, admissions, step-like increase and the initiation date, and the largest MSOA in the ring (including the proportion of admissions attributable to the largest MSOA).
*The three rings where a single MSOA comprises the bulk of the admissions have been shaded.
To gain further evidence for an infectious-like spread Table 2 summarizes the details for the largest MSOA aggregates. Note that in these smaller geographical units the initiation dates show a wider spread from April 2008 to October 2009 while the increase ranges from +16% to +70%.In this table,the 97.5% confidence interval (CI) has been calculated from Poisson variation and represents the maximum possible contribution from Poisson variation to the step-change. Hence for the first MSOA (E02004517) in Table 2 the measured 65% step-increase has a maximum possible 15% increase which could be due to chance, i.e. something higher than a 50% step-increase can be guaranteed to be due to the infectious agent, on the other hand the real step change could be as high as 80%. Even the smallest MSOA (Colchester 010A) with only 131 admissions in the twelve months prior to the step-increase has a change well beyond the 97.5% CI for Poisson variation.
|
MSOA
|
Name
|
Minimum Admissions
|
Step-like Increase
|
97.5% CI
|
Apparent Initiation
|
|
E02004517
|
Colchester 012E
|
399
|
65%
|
15%
|
Apr-08
|
|
E02004589
|
Tendring 017A
|
710
|
21%
|
9%
|
May-08
|
|
E02004583
|
Tendring 011B
|
620
|
33%
|
11%
|
May-08
|
|
E02004579
|
Tendring 007B
|
481
|
22%
|
13%
|
Jun-08
|
|
E02004525
|
Colchester 020E
|
434
|
24%
|
14%
|
Jun-08
|
|
E02004520
|
Colchester 015E
|
333
|
45%
|
17%
|
Jun-08
|
|
E02004513
|
Colchester 008D
|
527
|
27%
|
12%
|
Aug-08
|
|
E02004586
|
Tendring 014B
|
776
|
23%
|
9%
|
Sep-08
|
|
E02004510
|
Colchester 005B
|
258
|
33%
|
20%
|
Sep-08
|
|
E02004515
|
Colchester 010A
|
141
|
70%
|
26%
|
Sep-08
|
|
E02004511
|
Colchester 006D
|
619
|
21%
|
11%
|
Oct-08
|
|
E02004573
|
Tendring 001B
|
381
|
40%
|
16%
|
Oct-08
|
|
E02004524
|
Colchester 019B
|
335
|
21%
|
17%
|
Oct-08
|
|
All MSOA
|
NE Essex Total
|
21,123
|
24%
|
2%
|
Nov-08
|
|
E02004590
|
Tendring 018B
|
845
|
51%
|
8%
|
Nov-08
|
|
E02004588
|
Tendring 016A
|
759
|
20%
|
9%
|
Nov-08
|
|
E02004582
|
Tendring 010A
|
684
|
23%
|
10%
|
Nov-08
|
|
E02004521
|
Colchester 016B
|
489
|
32%
|
13%
|
Nov-08
|
|
E02004516
|
Colchester 011C
|
345
|
42%
|
17%
|
Nov-08
|
|
E02004507
|
Colchester 002B
|
324
|
34%
|
17%
|
Nov-08
|
|
E02004584
|
Tendring 012A
|
713
|
31%
|
11%
|
Dec-08
|
|
E02004575
|
Tendring 003A
|
560
|
23%
|
12%
|
Dec-08
|
|
E02004519
|
Colchester 014B
|
451
|
24%
|
14%
|
Dec-08
|
|
E02004509
|
Colchester 004C
|
298
|
44%
|
18%
|
Dec-08
|
|
E02004508
|
Colchester 003A
|
238
|
30%
|
21%
|
Dec-08
|
|
E02004587
|
Tendring 015A
|
654
|
35%
|
10%
|
Jan-09
|
|
E02004585
|
Tendring 013A
|
658
|
32%
|
10%
|
Jan-09
|
|
E02004581
|
Tendring 009A
|
481
|
30%
|
13%
|
Jan-09
|
|
E02004526
|
Colchester 021B
|
453
|
22%
|
14%
|
Jan-09
|
|
E02004574
|
Tendring 002A
|
388
|
50%
|
16%
|
Jan-09
|
|
E02004514
|
Colchester 009C
|
307
|
28%
|
18%
|
Jan-09
|
|
E02004506
|
Colchester 001B
|
279
|
35%
|
19%
|
Jan-09
|
|
E02004576
|
Tendring 004A
|
533
|
25%
|
12%
|
Feb-09
|
|
E02004512
|
Colchester 007D
|
520
|
23%
|
13%
|
Feb-09
|
|
E02004523
|
Colchester 018E
|
419
|
48%
|
15%
|
Feb-09
|
|
E02004522
|
Colchester 017A
|
336
|
30%
|
17%
|
Mar-09
|
|
E02006235
|
Babergh 009A
|
169
|
54%
|
24%
|
Mar-09
|
|
E02004578
|
Tendring 006B
|
724
|
13%
|
11%
|
May-09
|
|
E02004577
|
Tendring 005A
|
239
|
18%
|
21%
|
May-09
|
|
E02004518
|
Colchester 013A
|
265
|
23%
|
20%
|
May-09
|
|
E02004580
|
Tendring 008A
|
1,202
|
16%
|
9%
|
Oct-09
|
Table 2.Characteristics for the largest MSOAincluding minimum admissions, value of the step-like increase and apparent initiation date.
Since GP practices service their patients from the close geographic vicinity Table 3 investigates the impact at GP practice level. An even wider spread in the initiation date is detected using this method from August 2007 through to June 2009 with the usual wide range in magnitude of the step change. The point of great interest is a single practice in the Lawford area which experiences no apparent increase in medical admissions over the period studied. Lawford is a rural village in the Tendring LA some 15 km to the northeast of Colchester, and is situated in an otherwise sparsely populated area.
|
Practice Postcode
|
Initiation
|
Minimum Admissions
|
Increase
|
97.5% CI
|
Name and Location
|
Ward
|
|
CO1 2QS
|
Aug-07
|
318
|
21%
|
18%
|
Castle Gardens Medical Centre, Colchester
|
Castle
|
|
CO3 4RY
|
Jan-08
|
284
|
32%
|
19%
|
Shrub End Surgery, Colchester
|
Shrub End
|
|
CO3 0PZ
|
May-08
|
199
|
30%
|
23%
|
Winstree Road Medical Practice, Colchester
|
Stanway
|
|
CO5 0TJ
|
Jun-08
|
484
|
16%
|
13%
|
Tiptree Medical Centre, Colchester
|
Tiptree
|
|
CO12 3RS
|
Aug-08
|
264
|
31%
|
20%
|
Fronks Road, Harwich
|
Harwich East Central
|
|
CO15 4DA
|
Sep-08
|
765
|
21%
|
9%
|
Great Clackton Surgery, Clackton
|
St Marys
|
|
CO15 1DA
|
Oct-08
|
982
|
43%
|
6%
|
St James Surgery, St Osyth, nrClackton
|
St James
|
|
CO2 8QY
|
Oct-08
|
484
|
31%
|
13%
|
Mersea Road Surgery, Colchester
|
Berechurch
|
|
CO1 2RW
|
Oct-08
|
365
|
46%
|
16%
|
East Hill Surgery, Colchester
|
Castle
|
|
CO4 3GW
|
Oct-08
|
189
|
19%
|
23%
|
Hawthorn Surgery, Colchester
|
St Andrews
|
|
CO15 2NB
|
Nov-08
|
453
|
76%
|
14%
|
Green Elms, Clackton
|
Golf Green
|
|
CO15 4TN
|
Nov-08
|
207
|
73%
|
22%
|
Crusader, Clackton
|
Burrsville
|
|
CO7 7LD
|
Nov-08
|
179
|
32%
|
24%
|
Ardleigh Surgery, Colchester
|
Ardleigh& Little Bromley
|
|
CO3 3HZ
|
Dec-08
|
569
|
25%
|
12%
|
Creffield Road Surgery, Colchester
|
Christchurch
|
|
CO4 3HS
|
Dec-08
|
475
|
33%
|
13%
|
Parsons Heath Surgery, Colchester
|
St Anne’s
|
|
CO5 7HP
|
Dec-08
|
194
|
51%
|
23%
|
Rowhedge Surgery, Colchester
|
East Donyland
|
|
CO7 0DT
|
Jan-09
|
559
|
50%
|
12%
|
Colne Medical Centre, Brightlingsea
|
Brightlingsea
|
|
CO12 4EX
|
Jan-09
|
490
|
67%
|
13%
|
MMC - Alldrick, Harwich
|
Harwich West Central
|
|
CO15 3AU
|
Jan-09
|
453
|
31%
|
14%
|
Old Road, Clackton
|
Pier
|
|
CO15 5UW
|
Jan-09
|
472
|
64%
|
14%
|
Frinton Road, Clackton
|
St Bartholomews
|
|
CO5 8RA
|
Jan-09
|
366
|
22%
|
16%
|
Mersea Island Surgery, Mersea Island
|
West Mersea
|
|
CO7 9PP
|
Jan-09
|
297
|
38%
|
18%
|
Wivenhoe Surgery, Colchester
|
Wivenhoe Quay
|
|
CO4 5LE
|
Jan-09
|
244
|
72%
|
20%
|
Mill Road Surgery, Colchester
|
Mile End
|
|
CO1 1DZ
|
Feb-09
|
535
|
46%
|
12%
|
North Hill Surgery, Colchester
|
Castle
|
|
CO7 8PJ
|
Feb-09
|
472
|
17%
|
14%
|
The Hollies, Tendring
|
Great Bentley
|
|
CO15 1NJ
|
Feb-09
|
367
|
16%
|
16%
|
Ranworth Surgery, Tendring
|
Pier
|
|
CO12 4EX
|
Feb-09
|
326
|
37%
|
17%
|
MMC - Wynne, Tendring
|
Harwich West Central
|
|
CO15 3PP
|
Mar-09
|
764
|
29%
|
9%
|
East Lynne Medical Centre, Tendring
|
Pier
|
|
CO3 4LN
|
Mar-09
|
644
|
60%
|
10%
|
Ambrose Avenue Surgery, Colchester
|
Prettygate
|
|
CO13 9JT
|
Mar-09
|
568
|
32%
|
12%
|
CARADOC, Tendring
|
Frinton
|
|
CO1 2DL
|
Mar-09
|
370
|
15%
|
16%
|
Wimpole Road Surgery, Colchester
|
New Town
|
|
CO4 4SR
|
Mar-09
|
173
|
47%
|
24%
|
Highwoods Surgery, Colchester
|
Highwoods
|
|
CO14 8PA
|
Jun-09
|
925
|
10%
|
7%
|
Walton Practice, Tendring
|
Walton
|
|
CO11 2HD
|
n/a
|
188
|
0%
|
23%
|
Lawford Surgery, Tendring
|
Lawford
|
Table 3.Characteristics of the step-like increases observed for the largest GP practices.
Figure 3 shows the actual monthly medical group admissions (rather than a running sum) in the concentric rings with onset clustered around October, November and December 2008. This data has been divided by the total days per month to give admissions per day and seasonal behavior has been adjusted for by applying monthly adjusting factors as described in the methods. The large step-change can be clearly seen, i.e. whatever has happened has reached near maximum impact within the space of a month.
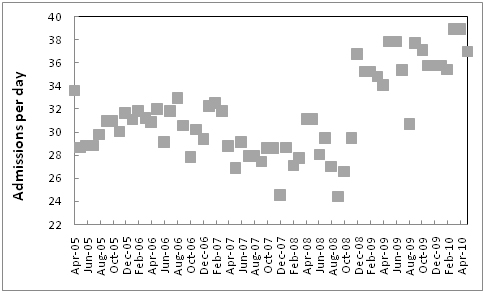
Figure 3.Monthly admissions (per day) for the rings with initiation in October, November and December.
*Data covers rings with onset in October, November and December of 2008, i.e. 2, 5-8, 17, 20-22, 26 with monthly admissions divided by days per month.
The same set of rings were then used to see if age had any effect on the magnitude of the increase and this is presented in Figure 4 where there appears to be a general declining impact between ages 16 to 30 and a general very high impact above age 96. More curiously the effect of age appears to follow a series of peaks and troughs with some ages, most notably, 75, 79, 92 and 69 showing very small increases.
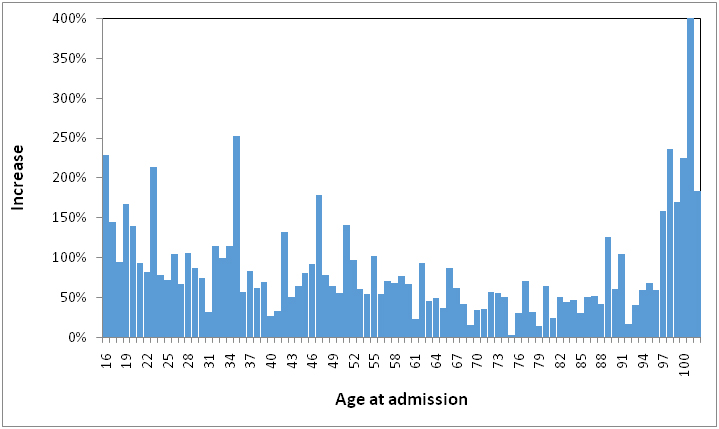
Figure 4.Effect of single-year-of-age on the magnitude of the step-like increase in admissions.
*Data covers rings with onset in October, November and December of 2008, i.e. 2, 5-8, 17, 20-22, 26.
Table 4 then investigates the possibility that particular social groups may be more affected. As can be seen the social group least affected live in an area dominated by student bed sits which experiences no increase in medical admissions, followed by areas of rural light industry and younger affluent families. The areas’ most greatly affected contain higher proportions of elderly especially blue collar workers and more deprived residents living in public housing.
|
OAC
|
Description
|
Step-like Increase
|
97.5% CI
|
Minimum admissions
|
Apparent Initiation
|
|
2a1
|
Transient: Student Bed Sits
|
0%
|
n/a
|
113
|
n/a
|
|
3c1
|
Well-off rural manufacturing
|
9%
|
14%
|
473
|
Feb-09
|
|
2b1
|
Settled in the city: Gentile flat land
|
14%
|
12%
|
538
|
Apr-09
|
|
6b1
|
Least divergent
|
20%
|
11%
|
599
|
Sep-08
|
|
4a2
|
Prospering younger families
|
20%
|
19%
|
280
|
Oct-08
|
|
2b2
|
Professional town families
|
20%
|
23%
|
190
|
Jan-09
|
|
4c1
|
Prospering semi-detached
|
23%
|
6%
|
975
|
Dec-08
|
|
6d2
|
Aspiring redeveloped established areas
|
23%
|
13%
|
511
|
Dec-08
|
|
5b2
|
Older workers: Public rented and flats
|
23%
|
6%
|
1018
|
Jun-08
|
|
4d2
|
Thriving suburbs
|
24%
|
6%
|
1990
|
Nov-08
|
|
4b1
|
Prospering older families
|
25%
|
7%
|
1608
|
Jan-09
|
|
1c1
|
Older Blue Collar
|
27%
|
12%
|
533
|
Feb-08
|
|
1b1
|
Younger blue collar
|
27%
|
13%
|
511
|
Nov-08
|
|
6c2
|
Young families: Deprived bed sit land
|
28%
|
14%
|
431
|
Feb-09
|
|
3a2
|
Poorer countryside
|
28%
|
11%
|
622
|
May-09
|
|
6a1
|
Settled households: Hard working
|
28%
|
16%
|
386
|
Jan-09
|
|
3c2
|
Pleasant rural retirement
|
29%
|
8%
|
862
|
Nov-08
|
|
4b2
|
Prospering older families
|
30%
|
16%
|
355
|
Jun-08
|
|
6b3
|
Least divergent
|
31%
|
7%
|
905
|
Nov-08
|
|
3b1
|
Agricultural: not tied to the land
|
31%
|
13%
|
520
|
Aug-08
|
|
5b4
|
Older workers
|
33%
|
19%
|
268
|
May-09
|
|
6c1
|
Young families: Bed sit land
|
33%
|
23%
|
192
|
Feb-09
|
|
3a1
|
Working villages
|
34%
|
12%
|
562
|
May-09
|
|
4b4
|
Prospering older families
|
35%
|
15%
|
407
|
Oct-08
|
|
6d1
|
Aspiring households: well off
|
39%
|
18%
|
301
|
Mar-08
|
|
5a1
|
Senior communities
|
40%
|
26%
|
146
|
Feb-09
|
|
5b3
|
Older workers
|
46%
|
12%
|
553
|
Oct-08
|
|
4b3
|
Prospering older families
|
47%
|
24%
|
168
|
Feb-09
|
|
6b2
|
Least divergent
|
48%
|
7%
|
876
|
Nov-08
|
|
1c3
|
Older Blue Collar
|
51%
|
17%
|
348
|
Jan-09
|
|
5b1
|
Older workers: Public rented and flats
|
52%
|
22%
|
206
|
Mar-08
|
|
5a2
|
Senior communities
|
53%
|
22%
|
211
|
Nov-08
|
|
4c2
|
Prospering semi-detached
|
54%
|
7%
|
947
|
Oct-08
|
|
5c3
|
Public housing
|
61%
|
27%
|
136
|
Mar-09
|
|
4d1
|
Thriving suburbs
|
76%
|
30%
|
107
|
Mar-09
|
|
1c2
|
Older Blue Collar: Public rented
|
81%
|
30%
|
106
|
May-09
|
Table 4.Characteristics of output areas (OAs) grouped by output area classification (OAC).
Figure 5 investigates if the destination at discharge has any impact on timing or extent. As can be seen those who are characterized by the need for a care/nursing home show initiation as early as June 2008 and have a very high increase in admissions which does however tail off, presumably due to higher numbers of deaths. Those who die in hospital seem to initiate around November but show a lesser increase than those who are discharged back to their home or usual place of residence. Admissions from (and returning to) prisons, psychiatric institutions and facilities for those with learning disabilities all show no change (data not shown), i.e. are not affected by the outbreak. These sources of admission represent a segment of the population having least contact with the rest of the general population.
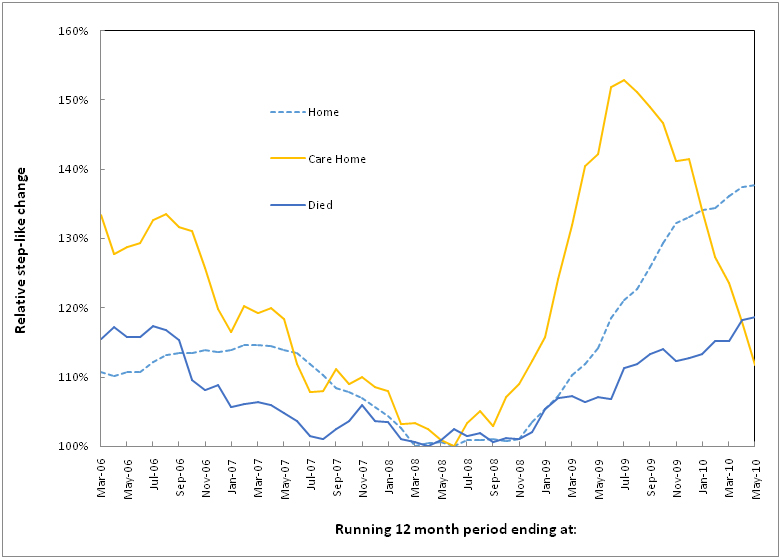
Figure 5.Effect of discharge destination on the time of initiation and extent of the step-like increase as revealed using running 12 month totals.
Finally Table 5investigates if the step-increase is specific to particular body systems. If this is a true infectious outbreak then pockets of diagnoses could be hidden across all specialties.In this table emergency admissions to any specialty and with any length of stay have been analyzed by looking at the ICD-10 chapter of the primary diagnosis for the admission. As can be seen the effects of the outbreak appear to stretch across multiple body systems. Further analysis at ICD 3 digit level of the 100 highest volume diagnoses shows that some 53 diagnoses with 6,661 admissions per annum can be positively excluded compared to 1,602 admissions in44 diagnoses which are strongly affected (data not shown), i.e. there are condition specific effects as well as conditions which remain unaffected. Why this could be possible will be explored in the discussion.
|
Chapter
|
ICD Chapter for primary diagnosis
|
Step Change (%)
|
Initiate
|
Admissions in 209/10 (n)
|
Step-change (n)
|
|
R
|
Signs & Symptoms
|
32%
|
Nov-08
|
6,156
|
1,492
|
|
J
|
Lung
|
22%
|
Oct-08
|
3,917
|
706
|
|
I
|
Vascular
|
12%
|
Oct-08
|
5,946
|
637
|
|
K
|
Digestive
|
15%
|
Nov-08
|
4,207
|
549
|
|
Z
|
Health status
|
16%
|
Feb-09
|
3,323
|
458
|
|
S
|
Injury & Fracture
|
20%
|
Jan-09
|
2,748
|
458
|
|
N
|
Genito-urinary
|
14%
|
Apr-09
|
2,007
|
246
|
|
G
|
Nervous System
|
42%
|
Sep-08
|
777
|
230
|
|
M
|
Musculoskeletal
|
25%
|
Nov-08
|
1,113
|
223
|
|
T
|
Miscellaneous & external causes
|
15%
|
Dec-08
|
1,418
|
185
|
|
E
|
Endocrine & metabolic
|
38%
|
Mar-09
|
669
|
184
|
|
P
|
Perinatal
|
32%
|
Feb-09
|
612
|
148
|
|
A
|
Bacterial & other
|
40%
|
Nov-08
|
466
|
133
|
|
L
|
Skin, etc
|
19%
|
Dec-08
|
779
|
124
|
|
D
|
Blood & blood forming
|
23%
|
Jan-09
|
658
|
123
|
|
F
|
Mental Health
|
32%
|
Mar-09
|
477
|
116
|
|
B
|
Viral & other
|
30%
|
Feb-09
|
295
|
68
|
|
H
|
Eye & Ear
|
16%
|
May-09
|
249
|
34
|
Table 5.Effect on body systems as summarized by ICD Chapter of the primary diagnosis for the admission.
*Emergency admissions to any specialty, and including zero day stay admissions.
Discussion
In England, Primary Care Organizations (PCO) pay acute hospitals on a cost-per-case basis using the NHS tariff for services called the Health Resource Group (HRG) Tariff. Medical group emergency admissions account for around 18% of the entire inpatient volume (including day case, mental health and maternity) and hence a 24% increase in medical admissions will lead to an approximate 4.4% increase in the total inpatient costs. Such a large and unexpected increase will be financially crippling and this was indeed the case in NE Essex[16,17]. These outbreaks occur across the whole of the UK and it has been estimated that total costs rose by a minimum of £600 million following the 2002 and 2007 outbreaks[4,8,12,18]. In the aftermath of the 2007 outbreak the Department of Health (DH) imposed a 70% discount on any emergency activity above the 2008/09 outturn[19], a move which has created huge cost pressures in the acute sector. This cost mitigating measure appears to have been driven by the assumption that ‘whatever was happening’ was related to acute thresholds to admission[14]. Hence it is vitally important to know exactly what has caused such a huge financial pressure.
The bulk of the analysis presented in this study is for overnight stay emergency admissions, i.e. same day or zero day stay admissions have been excluded. There are several reasons for this, namely, zero day stay admissions fall into a grey area between genuine inpatient and emergency department care. This grey area is further complicated by the arbitrary four hour target for treatment in the emergency department in England which, since introduction in 2004, led to a large increase in zero day stay admissions as hospitals opened medical assessment units (MAU)[20,21]. While MAUs are accepted good practice they are also outside of the scope of the four hour target, and hence the validity of such ‘admissions’ are sometimes questionable[20,21].While this should not be a major issue for admissions to a single hospital the analysis has, never the less, been restricted to those patients with a length of stay encompassing one or more nights and represent those with a genuine need for hospital admission.
While the first method of analysis using concentric rings may be considered arbitrary, the geography of NE Essex is suited to this approach in that the first five rings dissect the town of Colchester, the next rings dissect various farming villages and hamlets and the final rings dissect the three coastal towns. Indeed whatever the method when dealing with a change in admission threshold for a single hospital admissions from any location should show a simultaneous jump which as Figure 1 demonstrates is obviously not the case. That the dates for initiation within the concentric rings are so widely disparate strongly suggests that the hospital itself is not a common focal point for spread of the infection. Indeed the initiation surrounding GP practices in Table 3 is suggestive that these are the most likely focus for infectious spread.
In a running sum, a permanent or semi-permanent step change in admissions due to a reduction in admission thresholds leading to more admissions or due to the introduction of a persistent infectious agent will create a ramp increase which lasts for 12 months. The foot of the ramp marks the point at which the permanent change has been made and the point twelve months on provides the magnitude of the initial step-change. Note that the step-change has to endure for 12 or more months in order to generate the ramp. If the step-change endures for longer than 12 months the ramp is then followed by a plateau as seen in the 3 km and 5 km concentric rings in Figure 2.
When dealing with such a curious phenomenon it is always useful to look back to see if it has occurred before. Indeed such step-like increases which are specific to medical admissions, i.e. such trends are not observed in trauma or in surgical specialties,have occurred before in the UK and have been documented around 1993, 1996, 2002, 2007 and again in 2012[1-10,22]. Even more curiously initiation always appears to commence in Scotland earlier than the rest of the UK[3],and each event not only results in an increase in medical admissions but an increase in deaths, a somewhat non-specific and more variable increase in GP referral and a general increase in health care costs[1-11,22].
The curious step-down prior to the step-increase has also been documented for emergency medical admissions in Northern Ireland[7],for an associated long-term cycle in deaths[3,22],and has been commonly observed by the author in other locations (unpublished). If this is not an acute hospital admission threshold phenomena then what are the alternatives? Firstly, how do we explain the step down which appears to occur elsewhere and also with deaths (all-cause mortality). While 50% of deaths may take place in hospital it is hard to conclude that a tightening of the admission threshold would lead to a reduction in all-cause mortality since the two are largely unrelated. Indeed most hospital deaths are to do with end of life care or, more correctly, the absence of alternative options for end of life care, i.e. the person will die with or without hospital care[10,23].
If the cluster of locations with high admissions around November and December of 2008 explain the overall trend observed in Figure 1,i.e. the high level trend is driven by a mass effect from the largest locations, then Figure 2 gives a clear indication of how an apparent step-down can likewise occur across a wider geography in that the22 km ring has commenced a decline some 12 months after the onset of the step-increase. This is also seen in Figure 5 for discharge to a nursing home where there will be high turn-over of residents due to death. Hence the initial step down seen in Figure 1 is a reflection of the tail-end of events following the 2002 outbreak, which similar to the 2007 outbreak may also have occurred later in NE Essex than across other parts of England.
If the step-down arises from the eventual loss of infectious potency, i.e. it is eventually bought under immune control, then the step-up must also be explained as part of an infectious spreadmoving across the whole of the UK along with a step increase in other factors such as GP referrals[24]which have nothing to do with acute admission thresholds. Indeed the highly variable initiation dates ranging from June 2008 through to June 2009 within the concentric rings and other modes of analysis surrounding the acute site cannot be explained by a common acute threshold which would equally apply across all locations at the same time. This is further reinforced by the variable magnitude of the step-change from no change in a minority of small area locations (Table 2) through to very large increases in a minority of other locations.
All analysis presented in the Tables and Figures contradicts the hospital admission threshold hypothesis. My own discussion with hospital Chief Executives and Managers leads to the clear conclusion that the threshold to admission is a clinical decision into which managers do not seek to intrude, other than by the provision of medical assessment units, etc. Research conducted in the USA demonstrates that this clinical threshold is maintained despite considerable fluctuation in the number of arriving admissions and that clinicians manage the resulting bed pressures by flexing the threshold to discharge rather than admission[25].
It is interesting to note that the NE Essex PCT had assumed that the step-down was due to their own efforts and were very proud of the fact that they had the lowest level of age-standardizedmedical admissions in the East of England. Subsequent analysis revealed that the step-up had merely occurred earlier in other locations in the East of England[16,17], leaving the PCO with the incorrect perception that they had done something special.
In the UK, GP practices enroll patients from a defined area and the only exception is for patients who subsequently move and wish to stay with the practice. In NE Essex GP practices therefore have patients from 9 to 37 MSOA (23 median) and one MSOA (E02004581) has admissions from 32 practices, however, the largest practices have 20% to 50% of admissions from just one MSOA rising to 90% in some of the smaller practices. Hence interpreting data at practice level reflects the combined effect of varying degrees of distributed populations, and once again the overall trend will be largely driven by the one or two MSOA with the largest number of admissions.
It has been suggested that the infectious agent is most probably cytomegalovirus (CMV). CMV is a ubiquitous herpes virus with a multitude of genes dedicated to immune evasion and subversion[1-2,26] CMV has been implicated in autoimmune disease[26-28]as an oncomodulatory and oncogenic agent[29-32]and is associated with very high mortality rates especially in those with high levels of anti-CMV antibodies and/or with an associated inflammatory response and in the elderly[33-38].
Do the broad effects against almost every body system shown in Table 5 support the CMV hypothesis? There are several key observations which suggest that this could be true.
- CMV is known to increase all-cause mortality, i.e. the cause of death covers all ICD chapters. One study among elderly Latinos demonstrated 43% higher all-cause mortality in those with CMV IgG antibody levels in the upper quartile range while this group also had 35% higher mortality from cardiovascular disease[34]. Another study in Norfolk, England demonstrated 23% higher all-cause mortality in the high IgG antibody group with a 24% increase in death due to cardiovascular disease, a 13% increase in death due to cancer, and a 35% increase for the remaining causes of death, of which 12% had respiratory diseases, 16% gastrointestinal and 21% nervous system disorders[35]. Another study on the elderly in Nottingham, England calculated a sub-hazard ratio 94% higher for cardiovascular death for those with CMV infection and21% higher for respiratory death[37].A study comprising a representative sample ofUS nationalities demonstrated a 30% increase in both all-cause and cardiovascular mortality in CMV seropositive individuals with high C-reactive protein (CRP) levels[33].Based on the simple fact that nearly 50% of people die in hospital[23], and that the bulk of a persons’ lifetime hospital admissions occur in the last six months of life[23], the fact that CMV is so widely implicated in all-cause mortality would suggest that a CMV outbreak would therefore affect admissions for a wide range of diagnoses.
- CMV is known to have potent effects on immune function affecting both autoimmune functions[26-28], and inflammatory pathways[28,32-37]. There are over 100 known auto-immune diseases and over 100 inflammatory diseases and so the potential to predispose individuals to a wide range of such diseases leading to increased hospital admission in the face of a CMV outbreak is likewise feasible.
- Systematic reviews of hospital admissions and death where CMV was the confirmed causative agent in non-immunosuppressed patients demonstrated that the gastrointestinal tract and central nervous system were the most frequent sites for severe infection, while other common organ-systems included hematological disorders, thrombosis, ocular and lung disease[28,38]. Once again this list is consistent with Table 5 and the additional analysis of individual diagnoses.
- A large increase in admissions for Signs and Symptoms, i.e. where the diagnosis is somewhat vague, has been noted to commonly accompany these outbreaks[1,5-7], and given the general lack of awareness for the wider role of CMV in hospitalization and death[1,2] many of these admissions are likely to be CMV-related but will lack appropriate diagnostic tests to confirm the real source.
- CMV is known to infect the thymus with resulting tissue damage and thymopoiesis[1,2]. Recent research has demonstrated that thymopoiesis is associated with a systemic inflammatory state in the elderly[39],and that both thymic output and level of CRP are independent predictors of the time to end of life[40].
In this respect the list of diagnoses identified as possible candidates for a step increase appear to have a CMV link. Links with type I and II diabetes have been implicated in a number of studies[32,41-44], and the increase in admissions for both type of diabetes suggests an agent capable of exacerbating such conditions in a clinical context. Evidence for active CMV infection is common in patients with liver cirrhosis45 and once again we have an agent capable of at least exacerbating the condition in patients. Epilepsy and Intestinal disorders are characteristic diagnoses identified for these outbreaks[1-2,28], and in the individual diagnoses noted for NE Essex there were additional clusters of cardiovascular (angina, myocardial infarction, ischemic disease, atrial fibrillation and intercerebralhemorrhage), intestinal (diverticular disease, intestinal disorders, alcoholic liver disease, pancreatitis and other digestive disorders), lung (pneumonia unspecified, asthma, pleural effusion), and a nest of signs and symptoms (pain in throat and chest, abdominal pain, nausea, syncope, convulsions) all of which are highly indicative of CMV [28].
Also implied in the results of Table 5 is the concept of a disease progression as a time cascade. That such a time-dependent cascade could exist has been inferred from a study of GP referral to different specialties across the UK following the 2007 outbreak[12], from the peak in outpatient attendance for various dermatological conditions[46], and from the time trends for first diagnosis of particular cancers in the USA [47].Such a time cascade would arise out of the time-dependent effects upon the immune system mediated inflammatory and auto-immune functions. These preliminary results will hopefully act as the catalyst to further research.
A further interesting issue relates to the apparent saw tooth behavior seen in Figure 4 for the relative increase in medical admissions and age. Such a saw tooth pattern is typical of that seen in what has been called ‘original antigenic sin’[48,49]. This arises when the body is exposed to the first of a number of different strains of the same agent. The immune response is ‘primed’ to the first strain and this priming may help or hinder in subsequent exposure to different strains, hence the series of peaks and troughs which depend on the timing of different outbreaks and the number of outbreaks to which individuals have been exposed.
While the public health implications of this study should be widely apparent there are equally profound implications to funding and the use of age-standardization. These will now be discussed.
Almost all countries use some form of capitation formula to distribute health care funds to various regions and local areas. In the USA such a formula is used to distribute Medicare and Medicaid funds to the various states. All of these formula are based on the assumption that costs are fundamentally driven by population characteristics such as age, gender and deprivation[50]. This work elegantly demonstrates that the medical-related cost of healthcare is modified by the pattern of infectious spread associated with these outbreaks and imply that genuine fair funding requires some form of retrospective adjustment to account for the timing and extent of the outbreak[50,51].
Age-standardization of admission rates relies upon two assumptions, namely, that the most commonly used five year age bands are widely relevant, and the rates within the bands are fairly stable over time. This is called the constant rate fallacy[52].The very high degree of age-specific behavior which presumably arises from the outcome of ‘original antigenic sin’ elegantly demonstrates that such age-standardization is highly questionable when applied to the medical admissions so dramatically affected by these outbreaks. This probably explains why age standardization performs so poorly when attempting to forecast future numbers of medical admissions[53], simply because it is the step-like increases which drive the long-term trend, and not the underlying population demography.
The final issue to be addressed is the unique kinetic characteristics of these outbreaks. Fairly slow spread across the entire UK over an 18 month to two year period has been noted for both the 2012, 2007 and previous outbreaks and this corresponds with the relatively difficult to transmit nature of CMV[54]which would imply the introduction of a new strain of CMV [1,2] as per the age-specific behavior suggestive of antigenic original sin. CMV super infection with multiple strains is widely recognized as leading to more averse clinical outcomes [1,2] as implied by this study.How does this reconcile with the apparently rapid spread at local level such that within the space of around one month admissions jump from a lower to higher state? Like all persistent infections CMV is in a state of continuous outbreak and in many instances expresses itself in an acute influenza-like illness[1,2] and associated respiratory illness[55], which in children is statistically more frequent for those infected with CMV [56]. Shedding of the virus is common in both children and the elderly[57-61]. CMV has been detected in the air surrounding patients with CMV pneumonia and to a lesser extent for patients with a ‘latent’ infection[62], and CMV is known to survive for up to six hours on rubber, cloth and food and has been found on 83/90 wet and 5/40 dry surfaces in day care centersfor children[63]. Studies have shown that on average an infected person transmits CMV to two susceptible people[61], and a combination of the above is likely to explain the mini-epidemics of CMV illness described in a neighborhood, renal transplant unit, a laboratory, in burns units and an elderly care ward[64-68]. The particular nature of the infectious spread for nursing homes and GP practices identified in this research strongly suggest that both of these may be acting as loci for the bursts of rapid epidemic-like local spread.
Conclusions
2021 Copyright OAT. All rights reserv
A phenomenon with infectious-like spread has been shown to dominate the time-dependent admission trends for specific medical conditions subsequent to a UK wide infectious outbreak commencing in 2007. This spread has all the characteristics of a genuine infection with a high degree of age specificity, spatial granularity, higher impact on locations with higher density of the elderly, especially the more socially deprived or to nursing home residents. The pattern of conditions most affected points to the involvement of CMV although this requires confirmation. Given the huge financial impact of these outbreaks[4,18,69]research is urgently required to establish whether CMV is the ultimate cause and hence what public health measures can be implemented. Indeed these results add weight to the infectious basis for many diseases[70-72], although genetic and lifestyle factors are also important. There are profound effects upon health care finances, the equitable allocation of funds and the calculation of health insurance premiums. There are additional wider implications to age standardization of admission rates and to standardized hospital mortality rates.
Postscript
This paper was initially peer reviewed and accepted for publication in the 2014 edition of ‘Biomedicine International’. This journal ceased publishing in early 2014, and the original publication has now been kindly published by FGNAMB. Since 2014 additional small areas studies have been conducted confirming the results in this study. One of these studies has been published in FGNAMB1(2): 42-54. These and other papers on these infectious-like outbreaks can be most easily located using a search engine such as Google Scholar.
References
- Jones R (2013) Could cytomegalovirus be causing widespread outbreaks of chronic poor health?. Hypotheses in Clinical Medicine. Nova Science Publishers Inc, Newyork, USA: 37-79.
- Jones R (2013) Recurring outbreaks of a subtle condition leading to hospitalization and death. Epidemiol: Open access 3: 137.
- Jones R (2013) A recurring series of infectious-like events leading to excess deaths, emergency department attendances and medical admissions in Scotland. Biomed Int 4: 72-86.
- Jones R (2010) Nature of health care costs and financial risk in commissioning. Brit J Healthc Manage 16: 424-430.
- Jones R (2010) Unexpected, periodic and permanent increase in medical inpatient care: man-made or new disease. Med Hypotheses 74: 978-983. [Crossref]
- Jones R (2010) Can time-related patterns in diagnosis for hospital admission help identify common root causes for disease expression?. Med Hypotheses 75: 148-154. [Crossref]
- Jones R (2010) The case for recurring outbreaks of a new type of infectious disease across all parts of the United Kingdom. Med Hypotheses 75: 452-457. [Crossref]
- Jones R (2010) Trends in programme budget expenditure. Brit J Healthc Manage 16: 518-526.
- Jones R (2012) Age-related changes in A&E attendance. Brit J Healthc Manage 18: 502-503.
- Jones R (2012) Diagnoses, deaths and infectious outbreaks. Brit J Healthc Manage 18: 539-548.
- Jones R (2010) Do NHS cost pressures follow long-term patterns?. Brit J Healthc Manage 16: 192-194.
- Jones R (2012) Are there cycles in outpatient costs. Brit J Healthc Manage 18: 276-277.
- Jones R (2013) Do recurring outbreaks of a type of infectious immune impairment trigger cyclic changes in the gender ratio at birth?. Biomed Int 4: 26-39.
- http://www.nuffieldtrust.org.uk/sites/files/nuffield/Trends_in_emergency_admissions_REPORT.pdf
- http://www.hpa.org.uk/Topics/InfectiousDiseases/InfectionsAZ/HealthProfiles/HPPSummaryInformation/HPPEastOfEngland/HPPAreaSumNorthEastEssex/
- Mitchell-Baker A, Richmond N, Blanchard H (2010) North East Essex Urgent Care Deep Dive Project: Handover Report, 29th November 2010. Reading, Tricordant Ltd.
- Mitchell-Baker A, Richmond N, Blanchard H (2010) North East Essex Urgent Care Deep Dive Project: Workshop 1, Write up of the Session, 28th June 2010. Reading, Tricordant Ltd.
- Jones R (2012) Time to re-evaluate financial risk in GP commissioning. Brit J Healthc Manage 18: 39-48.
- Jones R (2010) Emergency preparedness. Brit J Healthc Manage 16: 94-95.
- Jones R (2010) Emergency assessment tariff: lessons learned. Brit J Healthc Manage 16: 574-583.
- Jones R (2011) Impact of the A&E targets in England. Brit J Healthc Manage 17: 16-22.
- Jones R (2013) An unexplained increase in deaths during 2012. Brit J Healthc Manage 19: 248-253.
- Jones R (2012) End of life care and volatility in costs. Brit J Healthc Manage 18: 374-381.
- Jones R (2012) Increasing GP referrals: collective jump or infectious push?. Brit J Healthc Manage 18: 487-495.
- Sharma R, Stano M, Gehring R (2008) Short-term fluctuations in hospital demand: implications for admissions, discharge and discriminatory behavior. Rand J Econ 39: 586-606. [Crossref]
- Varani S, Landini M, Soderberg-Naucler C (2010) Cytomegalovirus-induced autoimmunity. Autoimmune Disorders: Symptoms, Diagnosis and Treatment, Nova Science Publishers Inc, Newyork, USA.
- Varani S, Landini M (2011) Cytomegalovirus-induced immunopathology and its clinical consequences. Herpesviridae 2: 6. [Crossref]
- Jones R (2015) Roles for cytomegalovirus in infection, inflammation and autoimmunity. Infection and Autoimmunity. (2nd Edn.) Amsterdam: Elsevier, USA: 319-357.
- Lepiller Q, Khan K, DiMartino V, Herbein G (2011) Cytomegalovirus and tumors: two players for one goal – immune escape. Open Virol 5: 60-69. [Crossref]
- Soroceanu L, Cobbs C (2011) Is HCMV a tumor promotor. Virus Res 157: 193-203. [Crossref]
- Melnick M, Sedghizadeh P, Allen C, Jaskoll T (2011) Human cytomegalovirus and mucoepidermoid carcinoma of salivary glands: cell-specific localization and active viral and oncogenic signaling proteins is confirmatory of casual relationship. Exp Mol Pathol 92: 118-125. [Crossref]
- Fulop T, Larbi A, Kotb R, de Angelis F, Pawelec G (2011) Aging, immunity, and cancer. Discovery Medicine 11: 537-550. [Crossref]
- Simanek A, Dowd J, Pawelec G, Melzer D, Dutta A, et al. (2011) Seropositivity to cytomegalovirus, inflammation, all-cause and cardiovascular disease-related mortality in the United States. PLoS ONE 6: e16103. [Crossref]
- Roberts E, Haan M, Dowd J, Aiello A (2010) Cytomegalovirus antibody levels, inflammation, and mortality among elderly Latinos over 9 years of follow-up. Am J Epidemiol 172: 363-371. [Crossref]
- Gkrania-Klotsas E, Langenberg C, Sharp S, Lubena R, khao KT, et al. (2012) Seropositivity and higher IgG antibody levels against Cytomegalovirus are associated with mortality in the population based EPIC-Norfolk cohort. Clin Infect Dis 206: 1897-1903.
- Kyoto V, Vuorinen T, Saukko P (2005) Cytomegalovirus infection of the heart is common in patients with fatal myocarditis. Clin Infect Dis 40: 683-688.
- Sawa G, Pachnio A, Kaul B, Morgan K, Huppert F, et al. (2013) Cytomegalovirus infection is associated with increased mortality in the older population. Aging Cell 12: 381-387. [Crossref]
- Rafailidis P, Mourtzoukou E, Varbobitis I, Falagas M (2008) Severe cytomegalovirus infection in apparently immunocompetent patients: a systematic review. Virol J 5: 47. [Crossref]
- Ferrando-Martinez S, Franco J, Hernandez A, Ordonez A, Gutierrez E, et al. (2009) Thymopoiesis in elderly human is associated with systemic inflammatory status. AGE 31: 87-97. [Crossref]
- Ferrando-Martinez S, Concepcion M, Sanchez R, Solana R, et al. (2013) Thymic function failure and C-reactive protein levels are independent predictors of all-cause mortality in health elderly humans. AGE 35: 251-259. [Crossref]
- Lutsey P, Pankow J, Bertoni A, Szklo M, Folsom A (2009) Serologic evidence of infections and Type 2 diabetes: The multiethnic study of atherosclerosis. Diabet Med 26: 149-52. [Crossref]
- Chen S, de Craen A, Raz Y, Derhovanessian E, Vossen A, et al (2012) Cytomegalovirus seropositivity is associated with glucose regulation in the oldest old: Results from the Leiden 85-plus study. Immunity & Ageing 9: 8. [Crossref]
- Hiemstra H, Schloot N, van Veelen P, Willemen S, Franken K, et al. (2001) Cytomegalovirus in autoimmunity: T cell crossreactivity to viral antigen and autoantigen glutamic acid decarboxylase. Proc Nat Acad Sci USA 98: 3988-3991. [Crossref]
- Yang WC, Chen YS, Hseih WC, Shih MH, Lee MC (2006) Post-transplant diabetes mellitus in renal transplant recipients – experience in Buddhist Tzu Chi General Hospital. Tzu Chi Med J 18: 185-191.
- Varani S, Lazzarotto T, Margotti M, Masi L, Gramantieri L, et al. (2000) Laboratory signs of acute or recent cytomegalovirus infection are common in cirrhosis of the liver. J Med Virol 62: 25-28. [Crossref]
- Jones R (2012) GP referral to dermatology: which conditions?. Brit J Healthc Manage 18: 594-596.
- Jones R (2012) Cancer care and volatility in commissioning. Brit J Healthc Manage 18: 315-324.
- Francis T (1960) On the doctrine of original antigenic sin. Proc Amer Philosoph Soc 104: 572-578.
- Morens D, Burke D, Halstead S (2010) The wages of original antigenic sin. Emerg Infect Dis 16: 1023-1024. [Crossref]
- Jones R (2013) A fundamental flaw in person-based funding. Brit J Healthc Manage 19: 32-38.
- Jones R (2011) Infectious outbreaks and the capitation formula. Brit J Healthc Manage 17: 36-38.
- Nicholl J (2007) Case-mix adjustment in non-randomised observational evaluations: the constant risk fallacy. J Epidemiol Community Health 61: 1010-1013. [Crossref]
- Jones R (2010) Myths of ideal hospital size. Med J Australia 193: 298-300. [Crossref]
- Hyde T, Schmid S, Cannon M (2010) Cytomegalovirus seroconversion rates and risk factors: implications for congenital CMV. Rev Med Virol 20:311-326. [Crossref]
- Balthesen M, Messerle M, Reddehase M (1993) Lungs are a major site for cytomegalovirus latency and recurrence. J Virol 67: 5360-5369. [Crossref]
- Chomel J, Allard J, Floret D, Honneger D, David L, et al. (2001) Role of cytomegalovirus infection in the incidence of acute respiratory infections in children attending day-care centres. Europ J Clin Microbiol Infect Dis 20: 167-172. [Crossref]
- Stowe R, Kozlova E, Yetman D, Walling D, Goodwin J, et al. (2007) Chronic herpesvirus reactivation occurs in aging. Exp Gerontol 42: 563-570. [Crossref]
- Cannon M, Hyde T, Schmid D (2011) Review of cytomegalovirus shedding in body fluids and relevance to congenital cytomegalovirus infection. Rev Med Virol 21: 240-255. [Crossref]
- Bennett J, Glaser R, Malarkey W, Beversdorf D, Peng J, et al. (2011) Inflammation and reactivation of latent herpesviruses in older adults. Brain Behaviour Immun 26: 739-746. [Crossref]
- Gautheret-Dejean A, Aubin J, Poirel L, Hurax J, Nicolas J, et al. (1997) Detection of human beta herpesvirinae in saliva and urine from immunocompromised and immunocompetent subjects. J Clin Microbiol 35: 1600-1603.
- Colugnati F, Staras S, Dollard S, Cannon M (2007) Incidence of cytomegalovirus infection among the general population and pregnant women in the United States. BMC Infect Dis 7:71. [Crossref]
- McCluskey R, Sanden R, Greene J (1996) Detection of airborne cytomegalovirus in hospital rooms of immunocompromised patients. J Virol Methods 56: 115-118. [Crossref]
- Stowell J, Forlin-Passoni D, Din E, Radford K, Brown D, White A, et al (2012) Cytomegalovirus survival on common environmental surfaces: opportunity for viral transmission. J Infect Dis 205: 211-214. [Crossref]
- Meunier Y (2005) Infectious mononucleosis-like syndrome and gastrointestinal disorders in acute acquired cytomegalovirus infection. Singapore Med 46: 421-423. [Crossref]
- Shats V, Kozacov S, Miron D (1998) Outbreak of cytomegalovirus infection in the geriatric department. J Am Geriatr Soc 46: 930-931. [Crossref]
- Coulson A, Lucas Z, Condy M, Cohn R (1974) An epidemic of cytomegalovirus disease in a renal transplant population. West J Med 120: 1-7.
- Davies J, Taylor C, White R, George R, Purdham D (1979) Cytomegalovirus infection associated with lower urinary tract symptoms. BMJ 1: 1120. [Crossref]
- Rennekampff HO, Hamprecht K (2006) Cytomegalovirus infections in burns units: a review. J Med Microbiol 55: 483-487.
- Jones R (2011) Cycles in gender-related costs for long-term conditions. Brit J Healthc Manage 17: 124-125.
- Lorber B (1996) Are all diseases infectious?. Annals Int Med 125: 844-851. [Crossref]
- Jones R (2013) Is the demographic shift the real problem?. Brit J Healthc Manage 19: 509-511.
- Jones R (2013) Trends in elderly diagnoses: links with multi-morbidity. Brit J Healthc Manage 19: 553-558.