Abstract
Live-cell assays are used to study the dynamic functional cellular processes in High-Content Screening (HCA) of drug discovery processes or in computational biology experiments. The large amount of image data created during the screening requires automatic image-analysis procedures that can describe these dynamic processes. One class of tasks in this application is the tracking of cells. We describe in this paper a fast and robust cell tracking algorithm applied to High-Content Screening in drug discovery or computational biology experiments. We developed a similarity-based tracking algorithm that can track the cells without an initialization phase of the parameters of the tracker. The similarity-based detection algorithm is robust enough to find similar cells although small changes in the cell morphology have been occurred. The cell tracking algorithm can track normal cells as well as mitotic cells by classifying the cells based on our previously developed texture classifier. Results for the cell path are given on a test series from a real drug discovery process. We present the path of the cell and the low-level features that describe the path of the cell. This information can be used for further image mining of high-level descriptions of the kinetics of the cells.
Key words
cell tracking, similarity-based cell tracking, microscopic image analysis, description of the kinetic of the cells, high-content analysis, computational cell biology, image mining
Introduction
The utilization of dynamic High-Content Analysis approaches during preclinical drug research will permit to gain a more specified and detailed insight into complex sub-cellular processes by the use of living cell culture systems. This will effectively support future drug discoveries leading to a great outcome of highly specific and most effective drugs that come along with a well improved compliance. Live-cell assays are therefore used to study the dynamic functional cellular processes in High-Content Screening of drug-discovery processes or in computational biology experiments. The large amount of image data created during the screening requires automatic image analysis procedures that can automatically describe these dynamic processes. One class of tasks in this application is the tracking of the cells, the description of the events and the changes in the cell characteristics, so that the desired information can be extracted from it based on data-mining and knowledge-discovery methods.
There are several tracking approaches known that track a cell by detection in each single frame and associate the detected cells in each frame by optimizing a certain probabilistic function [1]. Other approaches track cells by model evolution [2]. This approach seems to be able to handle touching and overlapping cells well but is computational expensive [3].
We propose in this paper a similarity-based approach for motion detection of cells that is robust and fast enough to be used in real world applications. The algorithm is based on a specific similarity measure that can detect cells although small changes in morphology appeared. The algorithm can track normal cells as well as mitotic cells. In Section 2 we review related work. The material is given in Section 3 and the basic constraints of the algorithm resulting from microscopic life-cell images are explained. The algorithm is described in Section 4. Results are given on a test series from a real drug-discovery process in Section 5. The features that describe the extracted path are explained in Section 6. Finally, we give conclusions in Section 7.
Related work
Li et al. [4] proposes a system that combines bottom-up and top-down image analysis by integrating multiple collaborative modules, which exploit a fast geometric active contour tracker in conjunction with adaptive interacting multiple models motion filtering and spatiotemporal trajectory optimization. The system needs ten frames to initialize its parameters. If the numbers of frames in a video are high this is expectable otherwise it is not. Cells that have not been recognized in the initial frame are not considered anymore. The system cannot track new appearing cells and it has a high computation time. The evaluation of the categorical analysis shows that it has a high rate of false detection of mitosis and new cells. Swapping of cell identities occurred mostly in densely populated regions, where the boundaries between cells are highly blurred. This arises the question why to use snakes for tracking the cells.
In Sacan et al. [5], a software package is described for cell tracking and motility analysis based on active contours. Since snakes relies on the assumption that the movement and deformation of the tracked object is small between consecutive frames they propose like an ensemble of different tracking methods in a coarse to refined fashion in order to make their method more robust. Their combined method performs the following steps: the overall displacement and rotation of the object is first determined using a template matching method. The resulting contour is used as the initial state to pyramidal Lucas–Kanade optical flow-based deformation; statistical outlier detection and local interpolation is applied to achieve resistance against errors in the optical flow evaluation. They report that the ensemble method achieves accurate tracking even for large displacements or deformations of the objects between frames but a deep evaluation of the method is not given in the paper. The speed, area, deformation, trajectory and detailed tracking of the cells are computed and displayed for analysis. Besides automated cell detection and tracking capability, the interface also allows manual editing to initialize or modify the tracking data. The software can be used to work with movie or image files of a variety of file formats. The tracking results can be exported either as raw text data for further numerical analysis, or as movie or image files for visualization, sharing and publishing. Cell lineage is not reported in the paper.
In Wang et al. [6] is reported a system that can segment, track, and classify cells into cell types such as interphase, prophase, metaphase and anaphase. They use the distance transform to binarize the image and seeded watershed transformation to detect the cell area. The tracking path is determined by using local tree matching method. Graph matching approaches require large computation time. For each cell are calculated a large set of features such as texture, shape, gray level. The relevant feature set is determined by using a feature selection procedure. On-line support-vector machine is used to classify the nuclei. This approach is able to adapt the classifier to changing appearances of the objects.
Cohen et al. [7] propose an algorithmic information theoretic method for object-level summarization of meaningful changes in image sequences. Object extraction and tracking data are represented as an attributed tracking graph (ATG), whose connected sub graphs are compared using an adaptive information distance measure, aided by a closed-form multi-dimensional quantization. The summary is the clustering result and feature subset that maximize the gap statistic.
In Maška et al. [10] the coherence-enhancing diffusion filtering is applied on each frame to reduce the amount of noise and enhance flow-like structures. Then, the cell boundaries are detected by minimizing the Chan–Vese model in the fast level set-like and graph cut frameworks. To allow simultaneous tracking of multiple cells over time, both frameworks have been integrated with a topological prior exploiting the object indication function.
Magnusson et al. [11] propose a global track linking algorithm, which links cell outlines generated by a segmentation algorithm into tracks. The algorithm adds tracks to the image sequence one at a time, in a way which uses information from the complete image sequence in every linking decision. This is achieved by finding the tracks which give the largest possible increases to a probabilistically motivated scoring function, using the Viterbi algorithm.
Padfield et al. [12] present a general, consistent, and extensible tracking approach that explicitly models cell behaviors in a graph-theoretic framework. They introduce a way of extending the standard minimum-cost flow algorithm to account for mitosis and merging events through a coupling operation on particular edges. They show how the resulting graph can be efficiently solved using algorithms such as linear programming to choose the edges of the graph that observes the constraints while leading to the lowest overall cost.
Dongmin et al. [13] propose an optical flow method for automatic cell tracking. The key algorithm of the method is to align an image to its neighbors in a large image collection consisting of a variety of scenes. Considering the method cannot solve the problems in all cases of cell movement, another optical flow method, SIFT (Scale Invariant Feature Transform) flow, is also presented. The experimental results show that both methods can track the cells accurately.
We wanted to have a cell tracking method that can use an operator at the cell line without an initialization phase or heavy human interaction. The method should be fast and robust enough and should not have any subjective human interaction. Based on our observation, we concluded that it must be possible to track the cells by identifying the same cell from one image to the next image. Therefore, we introduced a similarity-based approach [20] for cell tracking. This idea has been overtaken later on by Padfield et al. [8] and by Kan et al. [9]. Both approaches [8, 9] do not evaluate their approach with our approach.
Padfield et al. [8] use spatiotemporal volumes in order to keep track of moving cells over time. The methods uses a standard level set approach for segmentation to extract the G2 phase nuclei from the volume and a Euclidean distance metric for linking between the G2 phases across the other phases. The level-set approach allows recognizing cells at different granularity level but will not prevent the algorithm to detect changing morphology. The Euclidean distance is a simple similarity measure that does not take into account the specific characteristics of visual objects.
Given an estimate of the cell size only, the method of Kan et al. [9] is capable of ranking the trackers according to their performance on the given video without the need for ground truth. Using the cell size for tracking is a simple measure that is included in our application as well.
These two methods [8,9] cannot track normal cells as well as mitotic cells as in our proposed approach. The Euclidean distance used as similarity measure in Kan et al. [10] is not robust enough to handle changing cell morphology as it is in our case. We use a very flexible similarity measure [17] that considers the similarity of the corresponding pixels as well as the similarity to its surrounding pixels and therefore can handle morphological changes from one time-frame to the following time-frame. Cells that appear new in the microscopic image window can be tracked as well.
Material and investigation of the material
The live cell movies are comprised of a sequence of 113 images. These images are taken in a time interval of thirty minutes. The whole experiment runs over two and a half days. The cells show no steady movement. They might suddenly jump from one direction to the opposite one. The cells might also turn around their own axis that will change their morphological appearance. They also might appear and disappear during the experiment as well as re-appear after having gone out of the focus of the microscope. It is also highly likely that the cells might touch or overlap. The tracking algorithm should run fast enough to produce the result in little computation time.
The following conditions have been decided for the algorithm: Only cells that are in focus should be tracked (background objects are not considered). Fragmented cells at the image borders are eliminated. Each detected cell gets an identity label and gets tracked. Disappearing cells are tracked until they disappear. Newly appearing cells are tracked upon their appearance and get a new identity label. Cells overlapping or touching each other are eliminated. They are considered as disappearing cells. Splitting cells are tracked after splitting and both get an identity label that refers to the mother cell. Cell fragments are eliminated by a heuristic less than 2xSigma of Cell Size. Note that we decided to exclude overlapping cells for the reason of the resulting higher computation time. If we want to consider this kind of cells, we can use our matching algorithm in [15] to identify the portion of touching cells belonging to the cell under consideration.
The object-tracking algorithm
The unsteady movement of the cells and the movement of the cells around their own axis required special processing algorithms that are able to handle this. The successive estimation of the movement based on mean-shift or Kalman filters [15] would only make sense if we can expect the cells to have steady movement. Since it can happen that the cells jump from one side to another, we used a search window around each cell to check where the cell might be located. The size of the search window is estimated based on the maximal distance a cell can move between two time frames. The algorithm searches inside the window for similar cells. Since we cannot expect the cell to have the same shape after turning around its own axis and as also the texture inside the cell might change, we have chosen a similarity-based procedure for the detection of the cell inside the window. The overall procedure is shown in Figure 2.
Figure 1. Time Series of Image of a Live Cell Project
Figure 2. Flowchart of the algorithm
Overall algorithm
The image gets threshold by Otsu`s well-known segmentation procedure. Afterwards the morphological filter opening by a 3x3 window is applied to close the contour and the inner holes. Fragmented cells at the image borders as well as small remaining objects of a size of ten pixels are deleted. The cells at the image borders are only tracked when they fully appear inside the image. Around the object is drawn the convex hull and remaining holes or open areas inside the cell area are closed by the operation flat-fill. The resulting images after these operations are shown in Figure 3 for the six time frames. This resulting area is taken as the cell area and the area with its grey levels is temporarily stored as template in the data base.
Figure 3. Image after Thresholding and Morphological Filtering
Then the center of gravity of the object is determined and the search window is tentatively spanned around the object. A raw estimation of the cell’s movement direction is calculated by the mean-shift filter over 3 frames. In the resulting direction is started the search for similar cells. Cells fragmented by the window border are not considered for further calculation. Each cell inside the window is compared by the similarity measure to the respective template of the cell under consideration. Before the similarity is determined the cells are aligned, so that they have the same orientation. The cell having the highest similarity score to the template is labeled as the same cell moved to the position x,y in the image t+1. The template is updated with the detected cell area for the comparison in the next time frame. The position of the detected cell is stored into the data base under the label of the template. Mytotic cells are detected by classifying each cell based on the texture descriptor given in [16] and the decision tree classifier.
Let CBtB be the cell at time-point t and CBt+1B the same cell at time point t+1. Then the rule for labeling a cell as “disappeared” is: IF CBtB has no CBt+1B THEN Disappearing Cell.
Similarity determination between two Cells
The algorithm [17] computes the similarity between two image areas A and B these images are in our case the bounding box around each cell (see Figure 4). According to the specified distance function, the proximity matrix is calculated, for one pixel at position r,s in image A, to the pixel at the same position in image B and to the surrounding pixels within a predefined window. Then, the minimum distance between the compared pixels is computed. The same process is done for the pixel at position r,s in image B. Afterwards, the average of the two minimal values is calculated. This process is repeated until all the pixels of both images have been processed. The final dissimilarity for the whole image is calculated from the average minimal pixel distance. The use of an appropriate window size should make this measure invariant to scaling, rotation and translation.
Fiure 4. Flowchart of the algorithm for computing the similarity measure.
The resulting similarity value based on this similarity measure for the pairwise comparison of cell_ 1 to cell_1, cell_1 to cell_2, and cell_1 to cell_3 in the preceding time frame is given in figure 6. The lowest similarity value is obtained when comparing cell_1 to cell_1 in the proceeding time frame.
Figure 5. Cells used for comparison
Figure 6. Path of a Cell marked with coordinate points
Results of tracking algorithm
Results in Figure 7 a-e show the tracking path of six different cells. We compared the manually determined path of a cell from an operator of the High-Content Screening Process-line with the automatic determined path by the tool IBaI-Track for 10 videos with 117 frames each. If both methods gave the same path we evaluated it as positive otherwise as negative. We observed a correspondence between these two descriptions of 98.2 %. The computation time for a sequence of 117 images of 674x516 pixels each and on average 80 cells per image is 11 minutes 42 seconds on PC with 1.8 GHz.
Figure 7. Tracking Path Cell
Information extracted from the path
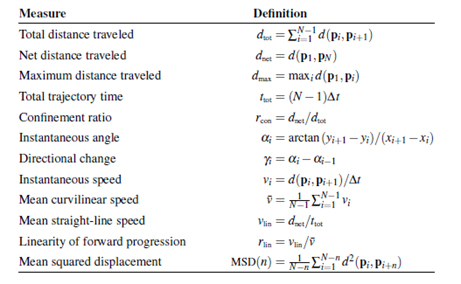
The output of the cell-tracking algorithm is a tuple of coordinates for each cell that describes that path of the cell (Figure. 7a-7e and Figure 8). Biologists want to study the kinetics of the cells. Therefore, we have to extract features from this path that describe the motility and velocity of a cell. Table 1 shows features that are used to describe the path of a cell [18]. These features (Table 2) are provided in a table to the biologist for further study. Please note, one image contains many cells. As result, we obtain a bunch of numerical values for one image that is hard to overlook for a human. More high-level descriptions are necessary that summarize these features and their feature values in more compact information about the kinetics of the cells in one image. Recently, biologist use statistical tools to study these features. More complex image mining methods such as decision tree induction and conceptual clustering [19] can be of help in order to bring out the higher-level descriptions.
Table 1. Measures for motility and velocity of a cell
Cell Number |
Total Distance
traveled |
Maximum distance traveled |
… |
… |
… |
… |
Mean squared displacement |
Cell_1 |
X11 |
X12 |
… |
… |
… |
… |
X112 |
… |
… |
… |
… |
… |
… |
… |
|
Cell_n |
Xn1 |
Xn2 |
… |
… |
… |
… |
Xn12 |
Table 2. Output of the Celltracking Tool
Conclusions
We have presented our new cell-tracking algorithm for tracking cells in dynamic drug discovery or computational biology experiments. The algorithm uses a window around the position of the cell in the preceding time frame for searching for the next position of the cell. This is necessary since the movement of the cells cannot be steady. The search inside the window is started in the expected direction of the cell. To calculate this direction, we use a mean-shift filter over 3 time frames. The detection of the cell is done based on a similarity determination of the grey-level profile between the cells in the preceding time-frame and the following time-frame. The cell giving the highest similarity value is selected as the same cell in the following time-frame. The template is updated with the new cell. A similarity measure that can handle small changes in the morphology of the cells is used. This similarity measure is robust enough to detect the cell with high accuracy. The tracking algorithm can track normal cells and mitotic cells by our formerly developed classifier. Eleven features describe the path of a cell. The resulting data are stored in a data file and can be used for further image-mining analysis. We propose that biologists and drug discovery experts think about more high-level terms to describe the events they want to discover since the large bunch of numerical values created during the tracking process is hard to overlook by a human. For that can be used proper image mining algorithm such as decision tree induction and conceptual clustering.
Acknowledgement
This work has been sponsored by the German Federal Ministry of Education and Research BMBF under the grant title “Quantitative Measurement of Dynamic Time Dependent Cellular Events, QuantPro” grant no. 0313831B.
References
- Debeir O, Van Ham P, Kiss R, Decaestecker C (2005) Tracking of migrating cells under phase-contrast video microscopy with combined mean –shift processes. IEEE Trans Med Im 24: 697-711. [Crossref]
- Padfield D, Rittscher J, Sebastian T, Thomas N, Roysam B (2008) Spatiotemporal cell segmentation and tracking in automated screening, In: Proc. of the IEEE Intern Symp Biomed Imaging. pp 376-379
- [Crossref] Li K1, Miller ED, Chen M, Kanade T, Weiss LE, et al. (2008) Cell population tracking and lineage construction with spatiotemporal context. Med Image Anal 12: 546-566.
- Li K, Miller ED, Ch2021 Copyright OAT. All rights reserv8) Cell population tracking and lineage construction with spatiotemporal contex. Med Image Anal 12: 546-566. [Crossref]
- Sacan A, Ferhatosmanoglu H, Coskun H (2008) CellTrack: an open-source software for cell tracking and motility analysis. Bioinformatics 24: 1647–1649. [Crossref]
- Wang M, Zhou X, Li F, Huckins J, King RW, et al. (2008) Novel cell segmentation and online SVM for cell cycle phase identification in automated microscopy. Bioinformatics 24: 94–101. [Crossref]
- Cohen AR, Bjornsson C, Chen Y, Banker G, Ladi E, et al. (2008) Automatic summarization of changes in image sequences using algorithmic information theory, 5th IEEE International Symposium on Biomedical Imaging: From Nano to Macro. 859-862
- Padfield D, Rittscher J, Thomas N, Roysam B (2008) Spatio-Temporal Cell Cycle Phase Analysis Using Level Sets and Fast Matching Methods. In: Proc. Of the IEEE Intern Symp Biomed Imaging. pp 376-379
- Kan A, Markhamb J, Chakravortyb R, Baileya J, Leckiea C (2015) Ranking cell tracking systems without manual validation. Pattern Recognition Letters 53: 38–43.
- Maška M, Danek O, Garasa S, Rouzaut A, Muñoz-Barrutia A, et al. (2013) Segmentation and Shape Tracking of Whole Fluorescent Cells Based on the Chan–Vese Model. IEEE Trans Med Imaging 32: 995-1005. [Crossref]
- Magnusson KEG, Jalden J,Gilbert PM, Blau HM (2014) Global Linking of Cell Tracks Using the Viterbi Algorithm. IEEE Trans Med Imaging 34: 911 – 929. [Crossref]
- Dirk Padfield, Jens Rittscher, Badrinath Roysam, Coupled minimum-cost flow cell tracking for high-throughput quantitative analysis. Med Image Anal 15: 650–668. [Crossref]
- Guo D, van de Ven AL, Zhou X (2014) Red blood cell tracking using optical flow methods. IEEE J Biomed Health Inform 18: 991-998. [Crossref]
- Perner P, Perner H, Jänichen S (2006) Case-based object recognition for airborne fungi recognition. Artif Intell Me 36: 137-157.
- Comaniciu D, Ramesh V, Meer P (2000) Real-time tracking of non-rigid objects using mean shift. In Proc. IEEE Conf. Comp. Vision and Patt. Recog., volume 2, pages 142–149.
- Anja Attig, Petra Perner (2011) A Comparison between Haralick's Texture Descriptor and the Texture Descriptor based on Random Sets for Biological Images, In: Petra Perner (Ed.) Machine Learning and Data Mining in Pattern Recognition. lnai 6871, pp.524-538, Springer Verlag
- Zamperoni P, Statovoitov V (1995) How dissimilar are two gray-scale images, In: Prod. Of the 17th DAGM Symposium, Springer Verlag Berlin. 448-455
- Beltman JB, Marée AF, de Boer RJ (2009) Analysing immune cell migration. Nat Rev Immunol 9: 789-798. [Crossref]
- Perner P (2002) Data Mining on Multimedia Data, Lecture Notes in Artificial Intelligence, Vol. 2558. Springer Verlag, Berlin Heidelberg New York. ISBN: 3-540-00317-7
- Perner H, Perner P (2009) Similarity-based motion tracking of cells in microscopic images. Stud Health Technol Inform 150: 851-855. [Crossref]
- Perner P (2008) Progress in Cell Image Analysis and Life Cell Tracking, QuantPro-BMWI Presentations and Reports May/2006, September/2007, March/2008 grant no. 0313831B