Abstract
The function and clinical utility of stem cell markers in metastatic castration-resistant prostate cancer (mCRPC) remains unresolved, and their expression may confer important therapeutic opportunities for staging and therapy. In the adult human prostate, CD133 (PROM1) expression identifies infrequent prostate epithelial progenitor cells and putative cancer stem cells. Previous work demonstrated an association with CD133 and cancer cell proliferation using in vitro model systems. The primary objective here was to investigate the expression of CD133 in circulating tumor cells (CTCs) from patients with mCRPC and to test the hypothesis that patients with mCRPC had CD133-positive CTCs associated with increased cell proliferation, changes in the androgen receptor (AR) protein expression, or AR nuclear co-localization. We utilized ImageStreamX technology, which combines flow cytometry and fluorescence microscopy, to capture and analyze CD45-negative/EpCAM-positive CTCs for CD133, Ki-67, and AR. All patient samples (20/20) contained CD133-positive populations of CTCs, and on average 50.9 ± 28.2% (range of 18.2% to 100%) of CTCs were CD133-positive. CD133-positive CTCs have increased Ki-67 protein expression compared to CD133-negative CTCs, implying that CD133-positive CTCs may have greater proliferative potential when compared to their CD133-negative counterparts. CD133-positive and CD133-negative CTCs have similar levels of AR protein expression and cellular co-localization with nuclear markers, implying that CD133 expression is independent of AR pathway activity and an AR-independent marker of mCRPC proliferation. These studies demonstrate the presence of CD133-positive populations in CTCs from mCRPC with increased proliferative potential.
Abbreviations
AR: Androgen Receptor, Mcrpc: Metastatic Castration-Resistant Prostate Cancer, CTC: Circulating Tumor Cells, CSCs: Cancer Stem Cells
Key words
CD133, androgen receptor, circulating tumor cells, metastatic castration-resistance prostate cancer, proliferation
Introduction
The dissemination and metastatic growth of prostate cancer cells continues to be a major clinical problem, and new strategies are needed to detect and target prostate tumor metastases [1,2]. Furthermore, despite favorable initial responses to hormone depleting therapies, many patients develop metastatic castration-resistant prostate cancer (mCRPC), characterized by continued growth and metastasis of the tumor despite castrate levels of testosterone [3]. Castration-resistance is thought to arise from diverse mechanisms. Historically, the androgen receptor (AR) has been a crucial component of castration-resistance through various ligand-dependent and ligand-independent pathways [4,5]. However, the role of stem cell genes and putative cancer stem cells (CSC) in mCRPC is undefined and may have significant implications for therapeutic resistance and disease progression. In particular, CD133 is thought to mark stem cells and is a widely expressed CSC marker among various tumor types [6-8].
Various organs, including the prostate, harbor rare populations of CD133-positive (CD133pos) cells [8,9]. We previously documented that CD133pos prostate cancer cells are more likely to be in the G2-phase of the cell cycle relative to cells that stain negative for CD133 (CD133neg); this G2-accumulation correlates with faster cell proliferation of CD133pos cells in multiple prostate cancer cell lines [10]. Analyses using in vitro cell lines documented that stable ectopic over-expression of CD133 does not alter the cell cycle, and AR pathway activation increases the frequency of cells in the G2-phase of the cell cycle specifically within CD133pos cells; collectively these data imply that AR may function differently within CD133pos cells when compared to CD133neg cells [10]. It is unknown, however, whether such a correlation between AR pathway activity and CD133 expression exists within patient-derived mCRPC CD133pos cells.
Various approaches are currently available to enable investigation of mCRPC cells in patients. However, these methods are usually invasive, generally yield a low amount of sample, and may not fully capture castration-resistant disease [11]. An alternative to these procedures is the acquisition and analysis of patient blood containing cells from a tumor or metastases that have entered circulation. Since obtaining these Circulating Tumor Cells (CTCs) is relatively non-invasive and may yield prognostic information, techniques have been crafted to investigate these rare cells in patients [12-21]. However, to date the only FDA approved method for collecting and enumerating CTCs in prostate cancer is the CELLSEARCH system (Janssen Diagnostics) [22]. We have recently reported a novel strategy for interrogating CTCs utilizing ImageStreamX, a marriage between high-resolution microscopy and flow cytometry technology [23]. We chose to use the ImageStreamX platform because of the ability of this technology in enumerating, multiplexing, and quantifying protein expression and cellular co-localization within CTCs. In addition, ImageStreamX also enables fixation and storage of samples, which facilitates increased flexibility in sample storage, staining, and analysis.
Because our previous work supports a role for CD133 in cell proliferation in vitro [10], the aim of our current study was to determine if CD133 was associated with increased proliferation, as well as changes in the Androgen Receptor (AR) expression or co-localization with the nucleus in CTCs from patients with mCRPC. Previous work by both Armstrong et al. and Pal et al. have documented the existence of CD133pos CTCs within blood acquired from advanced mCRPC patients and after local therapy, respectively in both studies the expression of CD133 was restricted to a sub-population of cells [24,25]. Thus, based upon these observations and our in vitro data, we hypothesized that CD133 expression will be associated with increased cellular proliferation and AR pathway activation.
To test this hypothesis, we utilized ImageStreamX technology to capture and analyze CTCs for various markers associated with proliferation, including CD133, Ki-67, and AR. Our results document that all patient samples (20/20) analyzed in this study contains a CD133pos CTC population. Importantly, CD133pos CTCs have increased proliferative potential compared to their CD133neg counterparts, which corroborates with our previously published in vitro data [10]. Interestingly, AR protein levels and co-localization with the nucleus remain similar in CTCs irrespective of CD133 status, implying that CD133 expression is independent of AR pathway activity in patient-derived CTCs.
Materials and methods
Study design
This was a primarily exploratory study with the primary goal of providing the expression characteristics of CD133 on the surface of CTCs from patients with metastatic castration prostate cancer. Based on our previous work with androgen receptor and Ki-67 staining [23], we anticipated that 20 patients would allow accurate CD133 CTC expression characterization. As the biomarker expression characteristics and variability within our patient cohort was not known, a formal biostatistical plan to determine the sample size needed was not possible.
Patients
All patients were treated at the University of Chicago for mCRPC and provided informed consent per an Institutional Review Board-approved (University of Chicago IRB 10-174B) prospective clinical protocol. All procedures performed in studies involving human participants were in accordance with the ethical standards of the institutional and/or national research committee and with the 1964 Helsinki declaration and its later amendments or comparable ethical standards. Informed consent was obtained from all individual participants included in the study. Additional informed consent was obtained from all individual participants for whom identifying information is included in this article. All patients were progressing on their current therapy by PSA or radiologic criteria [23]. Blood (15 mL) was collected and processed within 2 hours, including isolation of mononuclear cell fraction. All samples with detectable CTCs were included for the analysis. Patients with mCRPC with progressive disease were eligble to participate in the study.
ImageStream X Analysis of CTCs from patients with mCRPC
Blood obtained from patients with mCRPC for ImageStreamX analysis was processed as previously described [23]. Briefly, cells were centrifuged at 1500G for 20 minutes at room temperature. Mononuclear cells (i.e. buffy coat) were transferred into a new tube and kept at 4°C. Cells were centrifuged at 450G for 10 minutes and washed with PBS. Cells were blocked using FcR Blocking Reagent (Miltenyi Biotec (130-059-901), Bergisch Gladbach, Germany; 1:10 dilution) for 10 minutes. One ul of Biotin anti-human CD45 (Biolegend (304004), San Diego, CA; 1:100 dilution) per 5x10⁶ cells was added, incubated for 20 minutes, washed with PBS, and centrifuged for 10 minutes at 450G. This was repeated twice. Anti-biotin microbeads (Miltenyi (130-090-485), 1:4 dilution) were added to cells at a 1:4 dilution per 107 cells for 15 min, washed with PBS, and centrifuged at 450G. Cells were re-suspended in 500 ul PBS and CD45 depleted using AutoMACS Pro (Miltenyi) per the manufacturer’s instructions. Following depletion, cells were centrifuged for 10 minutes at 450G, washed and fixed for 15 minutes with 3.2% Ultra-Pure EM Grade Formaldehyde (Polysciences, Warrington, PA; Inc.,1:6 dilution), and stored at 4°C for up tothree months (average storage time was 4 weeks). Staining was performed using EpCAM (Biolegend (324221); 1:40 dilution), CD133 (Miltenyi (130-090-853); 1:8 dilution), and CD45 (Life Technologies (Q10156), Carlsbad, CA; 1:27 dilution) antibodies in the dark for 30 minutes. For intracellular staining, cells were then washed with PBS. Fixation/Permeabilization buffer from FoxP3 Buffer Set (eBioscience, San Diego, CA; 1:4 dilution) was added to cells for 30 minutes then washed off with PBS. Next, cells were washed with Perm Buffer from FoxP3 Buffer Set (eBioscience (00-5523-00), 1:10 dilution) and centrifuged at 450G for 5 minutes. Cells were stained intracellularly for AR (Cell Signaling Technology (7397S), Beverly, MA; 1:11 dilution), and Ki-67 (Biolegend (350517), 1:11 dilution) in the dark for one hour. Cells were washed with Perm Buffer and then PBS. Finally, cells were stained with FxCycle Violet (Life Technologies (F10347), 1:1000 dilution) and acquired on ImageStream X (Amnis; Seattle, WA). Gating strategies and multi-marker compensation was maintained throughout all samples. Analysis was conducted using IDEAS software (Amnis).
Cell lines and spike-in experiments
The LNCaP and LAPC4 cell lines were generously provided by Dr. John Isaacs at The Johns Hopkins University. CWR-22Rv1’s were purchased from ATCC. All cell lines were authenticated (DDC medical) and mycoplasma tested (ATCC Universal Mycoplasma Detection kit). LNCaP and CWR-22Rv1 cells were grown using RPMI-1640 plus 10% Fetal Bovine Serum (FBS) and 1x Penicillin-Streptomycin(Life Technologies); LAPC4 cells were cultured in IMDM media containing 10% FCS, Pen-Strep, and 1 nM R1881 [26]. To establish controls for ImageStreamX analyses, CWR-22RV1 and LNCaP cells were spiked into human blood and stained with CD133, FxCycle Violet, and EpCAM. ImageStreamX was then used for the acquisition and analysis of CD133pos cells. LAPC-4 cells overexpressing CD133 were used as a positive control for CD133 expression as previously described (Reyes et al., 2013). LAPC-4 cells stained with FxCycle Violet and EpCAM were used as Fluorescence Minus One (FMO) negative control for CD133 staining. CD133 positivity was determined based on these controls.
Statistics
Data from 938 CTCs from 20 prostate cancer patients were divided into two groups according to CD133 expression (CD133pos vs. CD133neg). For Ki-67 expression, AR expression, and similarity index, each patient’s median intensity of their CD133pos CTCs was compared to that of their CD133neg CTCs using the
Wilcoxon signed-rank test which is appropriate for analysis of paired data measured on a continuous scale. The nonparametric Wilcoxon signed-rank test makes no assumptions about the data distribution or about equality of variances. Statistical analysis was conducted with Stata Version 13 (StataCorp, College Station, TX). Box-and-whisker plots were generated to represent the distribution of medians where the top of each box represents the 75th percentile and the bottom of the box represents the 25th percentile. Box plots were executed using RStudio software. In addition, the range and standard deviation of intensity values for the CTCs were calculated.
Results
CD133pos cells are detectable in blood using ImageStreamX
We previously demonstrated that our CTC detection and interrogation technique is reliable and reproducible and enables quantitative characterization of intracellular and extracellular epitopes from mCRPC patients [23]. In brief, our technique involves obtaining the mononuclear cell layer (buffy coat) from patient blood, AutoMACS depleting CD45-positive (CD45pos) cells, fixing and staining extra-and-intracellularly with the epithelial cell marker EpCAM, the nuclear stain FxCycle Violet, the proliferation-associated marker Ki-67, CD133, and AR, followed by ImageStreamX data acquisition and analysis. The criteria for characterizing and defining a CTC has also been described (Reyes et al., 2014). ImageStreamX was able to eliminate debris and false-positives, and 94.2% of events were legitimate cells based on nucleation and cellular morphology [23].
We first sought to determine whether detection of CD133pos prostate cancer cells in blood using ImageStreamX was feasible. To establish robust criteria for CD133-positivity vs. CD133-negativity, we determined our gating strategy for CD133 staining in CTCs using CD133 over-expressing LAPC-4 cells (Figures 1A and 1B) [10]. Our CD133pos CTC gate cutoff was based on a commonly used “Fluorescence Minus One” (FMO) approach [27]. Our CD133 FMO control accounted for background fluorescence in CTCs and excluded 99.9% of CTCs that stained negative for CD133. Based upon these criteria, we next spiked defined quantities of CWR22Rv1 and LNCaP prostate cancer cells into blood obtained from healthy donors. As expected, we reliably detected CD133pos/EpCAMpos nucleated cells, even when cells were spiked at a low frequency (Figures 1C and 1D). The percentage of EpCAMpos cells that were also CD133pos was consistent with the low percentage of CD133pos cells within the prostate cancer cell lines, as we have previously reported (Figure 1C) [10].
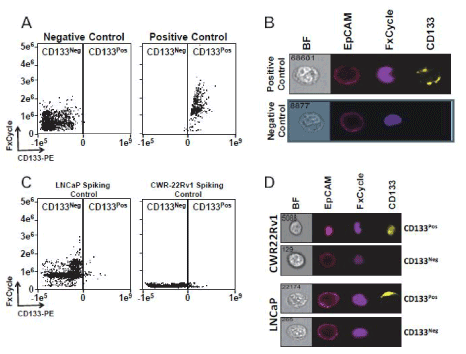
Figure 1. CD133pos cells are detectable in blood using ImageStreamX
1A and 1B. Representative dot plot and ImageStreamX images comparing CD133neg and CD133pos cells in Fluorescence Minus One (FMO) LAPC-4 (negative control), and LV-CD133-expressing LAPC-4 cells (positive control).
1C and 1D. Dot plot and ImageStreamX images detecting LNCaP and CWR-R1 prostate cancer cells spiked into blood from ahealthy donor.
After establishing an optimal gating strategy for CD133pos CTCs, we next determined the percentage of CD133pos CTCs within the EpCAMpos population in mCRPC patients using ImageStreamX technology. Indeed, our method was able to reliably detect populations of CD133pos/EpCAMpos CTCs in peripheral blood obtained from patients with mCRPC (Figures 2A and 2B). Thus, we proceeded by utilizing this method to interrogate the prevalence, molecular characteristics, and proliferation of CTCs from patients with mCRPC.
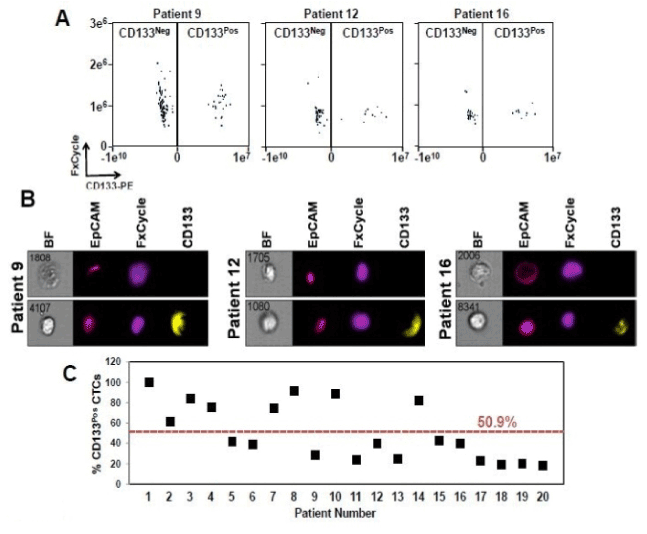
Figure 2. CD133 protein expression is prevalent in CTCs from patients with mCRPC.
2A. Representative dot plot comparing CD133neg and CD133pos CTCs from patients with mCRPC.
2B. Images of CD133neg and CD133pos cells from patients 9, 12, and 16
2C. Percentages of CD133pos CTCs in individual patients with mCRPC. All twenty patients had detectable CD133pos CTCs, and on average 50.9% of their EpCAMpos CTCs were also positive for CD133. All images were captured on ImageStreamX. All cells included in the analyses were CD45-depleted, EpCAM-positive and had discernable nuclei when stained with FxCycle.
CD133 protein expression is prevalent in CTCs from patients with mCRPC
Under physiological levels of androgen, comparable to a non-castrated host, CD133pos cells are an infrequent population in vitro [10]. However, using cell lines in vitro the response to AR-blockade with the clinically approved anti-androgen enzalutamide showed that the percentage of CD133pos cells increases [10]. Given that our patients were exposed to various AR-targeted therapies, we hypothesized that CD133pos cells would be a relatively robust population in CTCs. To test this, we enrolled 20 patients with mCRPC who had experienced clinical disease progression on their most recent therapy. The clinical characteristics of these patients, including prior therapies, are summarized in Table 1. Importantly, 20 of 20 patients samples had detectable CD133pos cells of varied levels of CD133 expression (Table 1, Figure 2C). In total, among all patient-derived CTCs, 50.9% (StDev of 28.2; Range 18.2% to 100%) of cells stain positive for CD133 (Figure 2C). These data document that in every patient with EpCAMpos CTCs, there was a detectable sub-population of CD133pos cells.
|
Patient ID
|
Prior therapiesa,b
|
PSAb
(ng/mL)
|
EpCAMpos
CTCsb
|
CD133pos
CTCs (%)
|
Mean CD133
Intensityc (StDev)
|
Median CD133 Intensityc
(Range)
|
|
1
|
L, B
|
168.4
|
5
|
5 (100)
|
223551 (165371)
|
206716 (47354,475964)
|
|
2
|
L, B, K, A
|
41.16
|
115
|
70 (60.9)
|
78990 (307899)
|
34321 (4080,3265320)
|
|
3
|
L, B, S
|
32.24
|
104
|
87 (83.7)
|
137883(309028)
|
53887 (8760,2430557)
|
|
4
|
L, B, K
|
11.12
|
33
|
25 (75.8)
|
113613 (163497)
|
60516 (374,634912)
|
|
5
|
L, D, C
|
275.4
|
36
|
15 (41.7)
|
15640 (14070)
|
8991 (1010,54904)
|
|
6
|
B, S
|
5.78
|
18
|
7 (38.9)
|
15338 (17248)
|
10515 (809,64674)
|
|
7
|
L, B, A, E
|
522.3
|
12
|
9 (75)
|
132840 (299868)
|
24581 (14149,1070550)
|
|
8
|
L
|
164.1
|
24
|
22 (91.7)
|
498300 (993270)
|
70587 (3689,3289138)
|
|
9
|
B, L, K, D, A, E, Sa
|
1152
|
121
|
34 (28.1)
|
-7545 (161732)
|
-55568 (-199450,1170616)
|
|
10
|
L, B
|
20.35
|
35
|
31 (88.6)
|
314035 (559318)
|
41524 (-65294,2174574)
|
|
11
|
L, B, K, F, D
|
0.06
|
21
|
5 (23.8)
|
-26449 (82493)
|
-51749 (-108878,296092)
|
|
12
|
L, B, D, A, E
|
37.23
|
50
|
20 (40)
|
24511 (263475)
|
-32723 (-279033,1635699)
|
|
13
|
L, B, K, A, C
|
6.33
|
4
|
1 (25)
|
2732 (113373)
|
-45784 (-68888,171384)
|
|
14
|
B, L, A, D
|
20.59
|
220
|
181 (82.3)
|
202050 (430120)
|
60047 (-170488,2680751)
|
|
15
|
Ci/Et, To, Et/Te
|
1.83
|
7
|
3 (42.9)
|
116908 (339944)
|
-28597 (-46217,881717)
|
|
16
|
L, B, N, K, D/Da, A, E, R
|
489.8
|
40
|
16 (40)
|
28043 (216375)
|
-37228 (-97909,1119994)
|
|
17
|
L, B, K, N, A, R
|
498.7
|
13
|
3 (23.1)
|
-26152 (67535)
|
-51487 (-106443,149757)
|
|
18
|
L, B, K, A, D
|
9.33
|
59
|
11 (18.6)
|
-32570 (123775)
|
-60245 (-231488,592272)
|
|
19
|
L, B, N, S, A
|
6.81
|
10
|
2 (20)
|
-27457 (90698)
|
-50383 (-142138,140905)
|
|
20
|
L, B
|
5.06
|
11
|
2 (18.2)
|
-81231 (126841)
|
-68302 (-310788,122334)
|
a)Prior therapies: A = abiraterone, B = bicalutamide, C = cabazitaxel, Ci = cisplatin, D = docetaxel, Da = dasatinib, E = enzalutamide, Et = etoposide, K =ketoconazole, L = LHRH agonist, N = nilutamide, R = radium223, S = sipuleucel-T, Sa = samarium, Te = temozolemide, To = topotecan
b)Previously reported (Reyes et. al 2014)
c)Negative values are due to compensation within ImageStreamX
High level of CD133 expression is associated with increased Ki-67 expression in CTCs
We next sought to determine whether such CD133pos CTCs had distinct characteristics when compared to their CD133neg counterparts. In the prostate, CD133 has been defined as a stem cell marker and a putative cancer stem cell marker [28,6,7]. For this reason, cells expressing CD133 are generally thought to be a quiescent population [29,30]. However, we have previously shown that CD133pos prostate cancer cells are more proliferative compared to CD133neg cells in vitro [10]. We also recently demonstrated variable protein expression of Ki-67 within CTCs utilizing ImageStreamX, whereby increased levels of Ki-67 is associated with increased AR expression and nuclear co-localization [23]. Using flow cytometry and ImageStreamX, Ki-67 protein expression is detectable at the G1-phase of the cell cycle, and expression increases with cell cycle progression [23,31]. This is a different method to measure the expression pattern of Ki-67 compared to what has been previously observed using immunohistochemistry where bimodal Ki-67 is a qualitative marker of a cell undergoing cell proliferation.
Expression of Ki-67, however, has been discussed as a marker of the potential for a cell to divide but does not predict the actual division of the cell [32]. These observations support that increased Ki-67, when analyzed using flow cytometry and ImageStreamX, indicate an increased potential for cell division.
To test the proliferative potential of CD133pos cells within mCRPC patient samples, we compared Ki-67 protein expression between CD133pos and CD133neg CTC populations. Our results document that CD133pos CTCs have more Ki-67 protein expression compared to CD133neg CTCs (Figure 3, p=0.03). Analyses of captured CTCs (N=591 of 12 patients) document detectable Ki-67 protein expression, with a wide range of staining intensity. There were clear differences in the range and variability of Ki-67 expression between CD133pos (Range: -348967.9 to 500145.3; StDev: 78338.2) versus CD133neg CTCs (Range: -79806.3 to 1510095.9; StDev: 156288.1). Within 10/12 individual patients, the CD133pos CTC populations had increased Ki-67 expression compared to CD133neg cells. In 2 of 12 patients, however, the reverse was true; this could be due to differences in therapeutic regimen or underlying molecular differences within the tumor cells. Overall, these data support our hypothesis that CD133pos CTCs have enhanced potential for cell division.

Figure 3. High level of CD133 expression is associated with more Ki-67 expression in CTCs
3A. Representative ImageStreamX image of CD133, Ki-67, and FxCycle for CTCs from patients with mCRPC. Ki-67 intensity was calculated using ImageStreamX.
3B. Box-and-whisker plot comparing patients’ median Ki-67 protein intensity of their CD133neg versus CD133pos CTCs. All data was captured on ImageStreamX (n = 12 patients; *P < 0.05 from Wilcoxon signed-rank test). This patient level analysis was based on 282 CD133neg CTCs and 309 CD133pos CTCs.
Analyses of androgen receptor expression and nuclear co-localization between CD133pos andCD133neg CTCs
To further study the underlying mechanisms leading to an association between CD133 and proliferation in CTCs, we interrogated the Androgen Receptor (AR). AR is a steroid transcription factor known to drive prostate cell proliferation and remains a clinical target even in the context of mCRPC [33]. Furthermore, we previously showed that AR expression and nuclear co-localization are associated with increased Ki-67 expression within our current CTC populations from patients with mCRPC [23]. Moreover, AR pathway activation within prostate cancer cells grown in vitro increase the percentage of CD133pos cells [10]. Thus, we sought to test whether CD133 expression and AR protein expression were correlated in CTCs derived from patients with mCRPC. To test this, we compared CD133 and AR intensity in our patient samples using ImageStreamX. We previously reported that a fluorescence intensity cutoff of 1 x 10⁴ RFIU (relative fluorescence intensity units) defines AR-high (ARhigh) cells based on the treatment of LAPC-4 control cells with the AR-agonist R1881 and the AR-antagonist enzalutamide [23]. Intriguingly, our results show that AR protein intensity within CTCs are not statistically different (p=0.31) between CD133pos (Range: -62337.8 to 1427349.4; StDev: 190738.3) and CD133neg populations (Range: - 149354.6 to 11054469.4; StDev: 618909.1 (Figures 4A-4C).
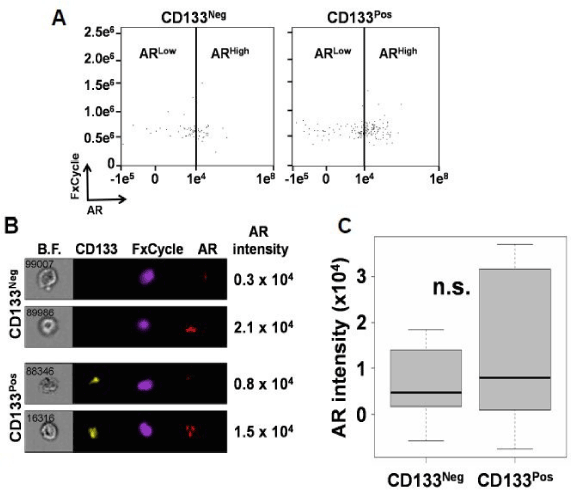
Figure 4. CD133neg and CD133pos CTCs have comparable levels of androgen receptor protein expression
4A. Representative dot plot showing androgen receptor (AR) gating strategy of CD133neg and CD133pos CTCs.
4B. Representative ImageStreamX images of CD133neg and CD133pos CTCs showing ARhigh and ARlow cells.
4C. Box-and-whisker plot comparing patients’ median AR intensity of their CD133neg versus CD133pos CTCs (n=19; N.S. = not statistically significant from Wilcoxon signed-rank test).
While our data demonstrates that increased AR protein expression is not associated with CD133 expression, AR function could be increased by nuclear co-localization without an increase in overall AR protein expression. Thus, we reasoned that CTCs with increased levels of AR within the nucleus would have more AR available to bind DNA and activate cell cycle genes, thus promoting cell proliferation. We analyzed the nuclear co-localization of AR in CTCs by utilizing the Similarity Index (SI) feature of ImageStreamX to quantitatively determine AR co-localization with the nuclear staining FxCycle dye as we have previously reported [23]. Our results demonstrate that CD133pos (Range: -1.76to 4.27, StDev: 1.11) and CD133neg (Range: -4.17 to 3.99; StDev: 1.11) CTCs have comparable levels of AR co-localized with the nucleus (Figure 5A-5C, p=0.68). Collectively, our results demonstrate that CD133 expression is not specifically associated with AR protein expression or nuclear co-localization within CTCs derived from patients with mCRPC.
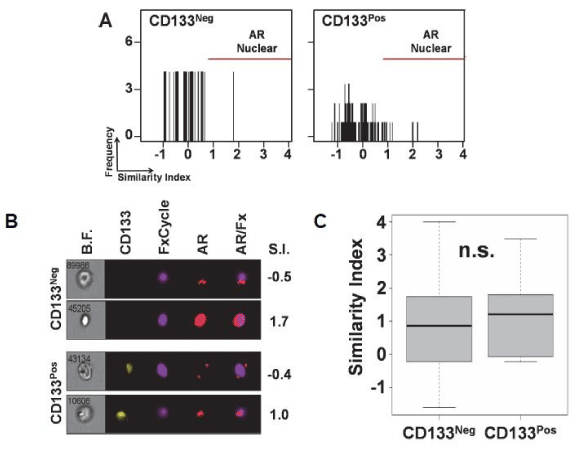
Figure 5. Androgen receptor co-localization in the nucleus remains consistent irrespective of CD133 status in CTCs
5A. Representative similarity indexes comparing the nuclear co-localization of AR with the nucleus of CD133neg and CD133pos CTCs. AR is nuclear if the similarity index is one or greater.
5B. Representative CD133neg and CD133pos CTCs showing nuclear versus cytoplasmic AR and the similarity index (S.I.) for each cell.
5C. Box-and-whisker plot comparing patients’ median similarity indexes of their CD133neg versus CD133pos CTCs (n=16; N.S. = not statistically significant from Wilcoxon signed-rank test)
Discussion
The aim of our current study was to determine whether CD133 was associated with proliferation or changes in AR expression and activity within CTCs from patients with mCRPC. To that end, we demonstrate that high levels of CD133 protein expression is detectable in a significant subset of EpCAMposCTCs, and that 20/20 patients with advanced disease had detectable populations of CD133pos cells. These data corroborate previous studies that detected sub-populations of CD133pos CTCs in prostate cancer patients [24,25]. Expression of CD133 is associated with Ki-67 staining intensity in CTCs, but is not associated with AR expression or nuclear translocation.
Our results raise several important considerations concerning the role of CD133 in metastatic progression. First, we show that CD133 protein expression is non-uniform in CTCs from patients with mCRPC and is expressed in a sub-population of EpCAMpos cells. The overall inter-patient variability of CD133pos CTCs suggests enrichment within certain contexts. Moreover, these data imply that CD133 does not serve a necessary functional role for tumor cell dissemination, as both CD133pos and CD133neg CTCsexist in the circulation. In support of this, Pal et al. documented 76% CD133-positivity of CTCs detected after surgery for localized prostate cancer [25]; this data further supports the lack of an association between AR signaling and CD133 as these patients here hormone therapy naive. Second, the observation that CD133pos CTCs appear to have greater proliferative potential than CD133neg CTCs suggests that CD133 expression may mark a cancer cell with greater potential to form a metastatic lesion; this observation may help to explain the enhanced tumor-initiating qualities of CD133pos cells in multiple tumor types [8,6,9] and also suggests that CD133pos cells may be more sensitive to cytotoxic therapies. Thus, our data contradicts the historical definition of CD133 as a marker of a quiescent “stem-like” cell [29,30], implying that the percentage of CD133pos CTCs may change in response to therapies targeting dividing cells; such a question is an area for future research.
The association between CD133 expression and proliferation has been investigated in other tumor and model systems, and data from these studies also support a significant link between CD133 expression and increased cellular proliferation. In the human kidney, CD133 expression is associated with proliferating cells and in human osteosarcoma, cells which stain high for CD133 are more likely to be in the G2-phase of the cell cycle and are enriched for Ki-67 [34,35]. CD133 expression was also shown to correlate positively with Ki-67 expression in patients with gastric cancer [36]. However, to the best of our knowledge, we are the first to report a positive association between CD133 and proliferation in CTCs from patients with mCRPC.
Our data support a model whereby a non-AR dependent proliferation pathway(s) may be causing CD133pos CTCs to have increased proliferative potential. In fact, various proteins are associated or directly implicated in regulating CD133 expression in several mouse and human cancers; these include HNF4-alpha, AF4, EZH2, and HOXA10 [37-40]. Intriguingly, some of these proteins have also been implicated in altering cell proliferation [41-43]. However, determining if these or other proteins are directly involved in regulating CD133 or altering the proliferative phenotype of CD133pos prostate cancer cells needs to be studied in greater detail, and is a clear avenue for future research.
The criterion used to identify CTCs is an area of concern when studying sparse cell populations. To eliminate the vastly abundant CD45+ cells, we AutoMACS depleted the CD45+ population. Although our CD45-depletion method was efficient, low levels of CD45 positive staining was present in our CD45negative population. CD45+EpCAM+ cells were found; thus CD45+ cells may have escaped depletion. However, visual inspection suggested that this population was comprised of false positives, and thus the double-positive population was due to non-specific EpCAM staining of debris, as we have previously reported [23].
A limitation of our study is defining CTCs by EpCAM positivity. Other groups have used various markers to define CTCs [44,24]. A concern when using EpCAM as a marker of CTC identification is that normal epithelial cells can be in circulation, although a rare event [45,46]. However, after CD45 depletion, cells staining EpCAM+ were larger compared to EpCAM- cells, as we have previously reported [23]. Since CTCs have been shown to be larger than hematologic cells our data support the notion that EpCAM+CD45-depleted cells are CTCs [47-49]. Furthermore, we also may have failed to detect EpCAM- CTCs However, we chose EpCAM because of the extensive literature supporting EpCAM positivity as a reliable marker of CTCs and we report successful detection of EpCAM+ CTCs expressing CD133, AR, and Ki-67 markers.
Our results raise interesting avenues for future studies. We show that CD133pos CTCs have more Ki-67 staining compared to CD133neg CTCs. Determining if CD133pos CTCs are actively cycling in circulation or if they simply have the increased potential to proliferate and are thus not actively dividing requires further experimentation. Testing this would require sorting CTCs and performing a time-course proliferation assay (e.g. BrdU). Although ImageStreamX is not capable of cell sorting, this may be accomplished with Fluorescence-Activated Cell Sorting (FACS), and is an avenue for further study. Of equal importance, determining the clinical relevance of CD133pos Ki-67high CTCs is of interest, and a prospective study with a larger, more homogenous patient cohort would be required to determine if increased CD133pos Ki-67high CTCs is correlated with decreased patient survival.
In summary, we demonstrate that CTCs from patients with mCRPC have robust CD133 protein expression, and high levels of CD133 are associated with an increased capacity for proliferation. AR expression and cellular co-localization is comparable in CTCs irrespective of CD133 status, implying that AR may not be directly causing CD133pos CTCs to be more proliferative. Finally, as we learn more about the biology of CD133 in the context of CTCs, novel breakthroughs in this field may open avenues for the use of cytotoxic drugs to target these cells with enhanced proliferative potential.
Acknowledgements
We wish to acknowledge the support of the University of Chicago Section Of Urology led by Dr. Arieh Shalhav and the Section of Hematology/Oncology led by Dr. Walter Stadler. We would like to thank Alicia Wyche for assistance in subject enrollment and sample acquisition in this study. We would also like to acknowledge the support of the University of Chicago Comprehensive Cancer Center (UCCCC) led by Dr. Michelle Le Beau. We also thank Drs. Alexander Chervonsky and Albert Bendelac of the Committee on Immunology for their support. We also wish to thank Dr. John Isaacs at Johns Hopkins for generously providing many of the cancer cell lines used.
Funding
RO1CA178431 (DJ Vander Griend); Immunology Training Grant AI07090-31 (EE Reyes); Cancer Biology Training Grant T32-CA09594 (S Kregel, H Brechka); The University of Chicago Comprehensive Cancer Center (UCCCC); a Pilot Award from the NCI P50 CA090386 SPORE in Prostate Cancer at the Robert H. Lurie Comprehensive Cancer Center of Northwestern University and the Cancer Research Center of the University of Chicago (DJ Vander Griend); A Young Investigator Award from the Cancer Research Foundation (DJ Vander Griend and RZ Szmulewitz); a pilot grant from the Cures within Reach Foundation (RZ Szmulewitz); The Brinson Foundation (DJ Vander Griend); the Alvin Baum Family Fund (DJ Vander Griend); The University of Chicago Cancer Research Foundation Women's Board (DJ Vander Griend); and an Anonymous Foundation (DJ Vander Griend).
References
- Siegel R, Ma J, Zou Z, Jemal A (2014) Cancer statistics, 2014. CA Cancer J Clin 64: 9-29.
- Wei J, Wang Z, Makarov D, Li X (2013) Current treatments and novel therapeutic targets for castration resistant prostate cancer with bone metastasis. Am J Clin Exp Urol 1: 30-38. [Crossref]
- Mostaghel EA (2013) Steroid hormone synthetic pathways in prostate cancer. Transl Androl Urol 2: 212-227. [Crossref]
- Mitsiades N, Sung CC, Schultz N, Danila DC, He B, et al. (2012) Distinct patterns of dysregulated expression of enzymes involved in androgen synthesis and metabolism in metastatic prostate cancer tumors. Cancer Res 7: 6142-6152. [Crossref]
- Li P, Yang R, Gao WQ (2014) Contributions of epithelial-mesenchymal transition and cancer stem cells to the development of castration resistance of prostate cancer. Mol Cancer 13: 55. [Crossref]
- Richardson GD, Robson CN, Lang SH, Neal DE, Maitland NJ, et al. (2004) CD13, a novel marker for human prostatic epithelial stem cells. J Cell Sci 117: 3539-3545. [Crossref]
- Vander Griend DJ, Karthaus WL, Dalrymple S, Meeker A, DeMarzo AM, et al. (2008) The role of CD133 in normal human prostate stem cells and malignant cancer-initiating cells. Cancer Res 68: 9703-9711. [Crossref]
- Bauer N, Fonseca AV, Florek M, Freund D, Jászai J, et al. (2008) New insights into the cell biology of hematopoietic progenitors by studying prominin-1 (CD133). Cells Tissues Organs 188: 127-138. [Crossref]
- Shmelkov SV, St Clair R, Lyden D, Rafii S (2005) AC133/CD133/Prominin-1. Int J Biochem Cell Biol 37: 715-719. [Crossref]
- Reyes EE, Kunovac SK, Duggan R, Kregel S, Vander Griend DJ (2013) Growth kinetics of CD133-positive prostate cancer cells. Prostate 73: 724-733. [Crossref]
- Ross RW, Halabi S, Ou SS, Rajeshkumar BR, Woda BA, et al. (2005) Predictors of prostate cancer tissue acquisition by an undirected core bone marrow biopsy in metastatic castration-resistant prostate cancer--a Cancer and Leukemia Group B study. Clin Cancer Res 11: 8109-8113. [Crossref]
- Danila DC, Anand A, Schultz N, Heller G, Wan M, et al. (2014) Analytic and clinical validation of a prostate cancer-enhanced messenger RNA detection assay in whole blood as a prognostic biomarker for survival. Eur Urol 65: 1191-1197. [Crossref]
- Harb W, Fan A, Tran T, Danila DC, Keys D, et al. (2013) Mutational Analysis of Circulating Tumor Cells Using a Novel Microfluidic Collection Device and qPCR Assay. Transl Oncol 6: 528-538. [Crossref]
- Hou HW, Warkiani ME, Khoo BL, Li ZR, Soo RA, et al. (2013) Isolation and retrieval of circulating tumor cells using centrifugal forces. Sci Rep 3: 1259. [Crossref]
- Leversha MA, Han J, Asgari Z, Danila DC, Lin O, et al. (2009) Fluorescence in situ hybridization analysis of circulating tumor cells in metastatic prostate cancer. Clin Cancer Res 15: 2091-2097. [Crossref]
- Mitra R, Chao O, Urasaki Y, Goodman OB, Le TT (2012) Detection of lipid-rich prostate circulating tumour cells with coherent anti-Stokes Raman scattering microscopy. BMC Cancer 12: 540. [Crossref]
- Ozkumur E, Shah AM, Ciciliano JC, Emmink BL, Miyamoto DT, et al. (2013) Inertial focusing for tumor antigen-dependent and -independent sorting of rare circulating tumor cells. Sci Transl Med 5: 179ra47. [Crossref]
- Saliba AE, Saias L, Psychari E, Minc N, Simon D, et al. (2010) Microfluidic sorting and multimodal typing of cancer cells in self-assembled magnetic arrays. Proc Natl Acad Sci U S A 107: 14524-14529. [Crossref]
- Saucedo-Zeni N, Mewes S, Niestroj R, Gasiorowski L, Murawa D, et al. (2012) A novel method for the in vivo isolation of circulating tumor cells from peripheral blood of cancer patients using a functionalized and structured medical wire. Int J Oncol 41: 1241-1250. [Crossref]
- Talasaz AH, Powell AA, Huber DE, Berbee JG, Roh KH, et al. (2009) Isolating highly enriched populations of circulating epithelial cells and other rare cells from blood using a magnetic sweeper device. Proc Natl Acad Sci U S A 106: 3970-3975. [Crossref]
- Vona G, Estepa L, Béroud C, Damotte D, Capron F, et al. (2004) Impact of cytomorphological detection of circulating tumor cells in patients with liver cancer. Hepatology 39: 792-797. [Crossref]
- Allard WJ, Matera J, Miller MC, Repollet M, Connelly MC, et al. (2004) Tumor cells circulate in the peripheral blood of all major carcinomas but not in healthy subjects or patients with nonmalignant diseases. Clin Cancer Res 10: 6897-6904. [Crossref]
- Reyes EE, Vanderweele DJ, Isikbay M, Duggan R, Campanile A, et al. (2014) Quantitative characterization of androgen receptor protein expression and cellular localization in circulating tumor cells from patients with metastatic castration-resistant prostate cancer. J Transl Med 1: 313. [Crossref]
- Armstrong AJ, Marengo MS, Oltean S, Kemeny G, Bitting RL, et al. (2011) Circulating tumor cells from patients with advanced prostate and breast cancer display both epithelial and mesenchymal markers. Mol Cancer Res 9: 997-1007. [Crossref]
- Pal SK, He M, Wilson T, Liu X, Zhang K, et al. (2015) Detection and phenotyping of circulating tumor cells in high-risk localized prostate cancer. Clin Genitourin Cancer 13: 130-136. [Crossref]
- vanBokhoven A, Varella-Garcia M, Korch C, Johannes WU, Smith EE, et al. (2003) Molecular characterization of human prostate carcinoma cell lines. Prostate 57: 205-225. [Crossref]
- Tung JW, Heydari K, Tirouvanziam R, Sahaf B, Parks DR, et al. (2007) Modern flow cytometry: a practical approach. Clin Lab Med 27: 453-468, v. [Crossref]
- Collins AT, Berry PA, Hyde C, Stower MJ, Maitland NJ (2005) Prospective identification of tumorigenic prostate cancer stem cells. Cancer Res 65: 10946-10951. [Crossref]
- Li K, Liu C, Zhou B, Bi L, Huang H, et al. (2013) Role of EZH2 in the Growth of Prostate Cancer Stem Cells Isolated from LNCaP Cells. Int J Mol Sci 14: 11981-11993. [Crossref]
- Boxall SA, Cook GP, Pearce D, Bonnet D, El-Sherbiny YM, et al. (2009) Haematopoietic repopulating activity in human cord blood CD133+ quiescent cells. Bone Marrow Transplant 43: 627-635. [Crossref]
- Sasaki K, Murakami T, Kawasaki M, Takahashi M (1987) The cell cycle associated change of the Ki-67 reactive nuclear antigen expression. J Cell Physiol 133: 579-584. [Crossref]
- Scholzen T, Gerdes J (2000) The Ki-67 protein: from the known and the unknown. J Cell Physiol 182: 311-322. [Crossref]
- Brand LJ, Dehm SM (2013) Androgen receptor gene rearrangements: new perspectives on prostate cancer progression. Curr Drug Targets 14: 441-449. [Crossref]
- Ye Y, Wang B, Jiang X, Hu W, Feng J, et al. (2011) Proliferative capacity of stem/progenitor-like cells in the kidney may associate with the outcome of patients with acute tubular necrosis. Hum Pathol 42: 1132-1141. [Crossref]
- Kelly SE, Di Benedetto A, Greco A, Howard CM, Sollars VE, et al. (2010) Rapid selection and proliferation of CD133+ cells from cancer cell lines: chemotherapeutic implications. PLoS One 5: e10035. [Crossref]
- Kim YJ, Koo GB, Lee JY, Moon HS, Kim, et al. (2014) A microchip filter device incorporating slit arrays and 3-D flow for detection of circulating tumor cells using CAV1-EpCAM conjugated microbeads. Biomaterials 35: 7501-7510. [Crossref]
- Yin C, Lin Y, Zhang X, Chen YX, Zeng X, et al. (2008) Differentiation therapy of hepatocellular carcinoma in mice with recombinant adenovirus carrying hepatocyte nuclear factor-4alpha gene. Hepatology 48: 1528-1539. [Crossref]
- Mak AB, Nixon AM, Moffat J (2012) The mixed lineage leukemia (MLL) fusion-associated gene AF4 promotes CD133 transcription. Cancer Res 72: 1929-1934. [Crossref]
- Li J, Zhong XY, Li ZY, Cai JF, Zou L, et al. (2013) CD133 expression in osteosarcoma and derivation of CD133+cells. Mol Med Rep 7: 577-584. [Crossref]
- Fumi MD, Lambri M, De Faveri DM (2009) Off-flavours in wines through indirect transfer of volatile organic compounds (VOCs) from coatings. Food Addit Contam Part A Chem Anal Control Expo Risk Assess 26: 759-766. [Crossref]
- Min AL, Choi JY, Woo HY, Kim JD, Kwon JH, et al. (2009) High expression of Snail mRNA in blood from hepatocellular carcinoma patients with extra-hepatic metastasis. Clin Exp Metastasis 26: 759-767. [Crossref]
- Scheuren K, Wente MN, Hainer C, Scheffler M, Lichtenstern C, et al. (2009) Left ventricular end-diastolic area is a measure of cardiac preload in patients with early septic shock. Eur J Anaesthesiol 26: 759-765. [Crossref]
- Degl'innocenti D, Alberti C, Castellano G, Greco A, Miranda C, et al. (2010) Integrated ligand-receptor bioinformatic and in vitro functional analysis identifies active TGFA/EGFR signaling loop in papillary thyroid carcinomas. PLoS One 5: e12701. [Crossref]
- Attard G, Swennenhuis JF, Olmos D, Reid AH, Vickers E, et al. (2009) Characterization of ERG, AR and PTEN gene status in circulating tumor cells from patients with castration-resistant prostate cancer. Cancer Res 69: 2912-2918. [Crossref]
- Hardingham JE, Hewett PJ, Sage RE, Finch JL, Nuttall JD, et al. (2000) Molecular detection of blood-borne epithelial cells in colorectal cancer patients and in patients with benign bowel disease. Int J Cancer 89: 8-13. [Crossref]
- Pantel K, Denève E, Nocca D, Coffy A, Vendrell JP, et al. (2012) Circulating epithelial cells in patients with benign colon diseases. Clin Chem 58: 936-940. [Crossref]
- Parkinson DR, Dracopoli N, Petty BG, Compton C, Cristofanilli M, et al. (2012) Considerations in the development of circulating tumor cell technology for clinical use. J Transl Med 10: 138. [Crossref]
- Lin HK,Zheng S, Williams AJ, Balic M, Groshen S, et al. (2010) Portable filter-based microdevice for detection and characterization of circulating tumor cells. Clin Cancer Res 16: 5011-5018. [Crossref]
- Yap TA, Lorente D, Omlin A, Olmos D, de Bono JS (2014) Circulating tumor cells: a multifunctional biomarker. Clin Cancer Res 20: 2553-2568. [Crossref]