Abstract
Cancer cells require the regulation of organelle-specific unfolded protein responses, such as endoplasmic reticulum (ER) stress, because of their increased metabolic activity during rapid proliferation and cell growth, which are executed through the activation of diverse signaling pathways. In this study, we focused on the dynamic regulation of ER stress in accordance with cancer cellular demand, and we performed real-time monitoring of the activation of the binding immunoglobulin protein (Bip) promoter, which is one of the most responsive genes to ER stress during cancer cell growth, in two and three dimensional (2D and 3D) cell culture using bioluminescence imaging at the single-cell level. Bioluminescence images were obtained from living single cancer cells after transient transfection of the reporter gene, and we observed Bip promoter activation during cell growth. Bip promoter activation was also observed in 2D and 3D culture using stably transfected glioblastoma cancer cells with the reporter gene. The Bip promoter was activated especially in dividing cells during cell growth. We then performed real-time monitoring of Bip promoter activation by bioluminescence imaging in tissue slices obtained from U251/pBipPro-Luc tumors. Luminescence intensity was not constant and was different in individual regions of the tumor slices, and the Bip promoter was activated in several regions during monitoring in vitro. These results show that real-time monitoring by bioluminescence imaging at the single-cell level is a suitable tool for not only gene analysis of signal transduction and regulation of the dynamics of the unfolded protein response in cancer cells but also for the evaluation of the efficacy of anti-cancer agents, and could provide additional information that has been difficult to obtain using conventional assays.
Key words
endoplasmic reticulum stress response, bioluminescence; single-cell level imaging, cancer cells, LV200 system
Abbreviation
ER: Endoplasmic Reticulum, 2D or 3D: Two or Three Dimensional, Bip/GRP78: Binding Immunoglobulin Protein/78 kDa Glucose-Regulated Protein, LV200: LUMINOVIEW LV200, EGFR: Epidermal Growth Factor Receptor, Akt: Protein Kinase B, PBS: Phosphate-Buffered Saline, ROI: Region of Interest
Introduction
Eukaryotic cells contain a set of organelles that have specific cellular functions and respond to stress through the transcriptional activation of genes that regulate stress elements in their promoter regions. During organelle stress, the endoplasmic reticulum (ER) stress response (also known as the unfolded protein response), in which the accumulation of misfolded or unfolded proteins in the ER activates the ER-specific stress response, is currently one of the most well-elucidated organelle-specific stress responses [1]. The ER, which occupies as much as 10% of total cell volume [2], is a significant and indispensable organelle for the folding and assembly of membrane or secreted proteins, lipid and sterol biosynthesis, and the storage of free calcium [3]. These newly synthesized membrane or secreted proteins correctly folded by ER chaperones and foldases, such as binding immunoglobulin protein (Bip; also known as 78 kDa glucose-regulated protein [GRP78]) and protein disulfide isomerase, in the ER are transported to the Golgi apparatus and then to the secretory pathway [4]. Bip is a major chaperone protein that is one of the most responsive proteins to ER stress, and has key roles as a pro-survival component in cells, such as protection from cell death and chemoresistance under ER stress conditions [5,6]. Many types of cancer reportedly rely on the ER to maintain the correct structure of important proteins in key signaling pathways [7]; in addition, a variety of cancers activate a group of signal transduction pathways upon ER stress to maintain ER homeostasis [8,9]. Elevated levels of Bip also reportedly protect against cancer cell death induced by several common anti-cancer drugs, such as doxorubicin, paclitaxel, and temozolomide [10-12]. Thus, the ER stress response in cancer cells is an important and attractive target not only to improve the efficacy of chemotherapy but also to lead to the development of novel types of anti-cancer agents.
Previously, we measured the activation of the Bip promoter under ER stress at the single-cell level using both high and low transfection efficiency cancer cells, and observed the activation of this promoter even in cells with the lowest transfection efficiency by single-cell bioluminescence imaging. We described how this system could be used for not only the rapid confirmation of transfection efficiency and the detection of reporter genes transiently transfected into several cancer and normal cell lines but also real-time monitoring of promoter activity using cancer cells that have low transfection efficiency [13]. Since bioluminescence imaging has several advantages, such as lower background and higher quantification [14], low levels of damage to living cells as the use of an excitation light is unnecessary [15], and longer observation periods (several days or weeks) [16], compared with fluorescence imaging, such as green fluorescent protein or fluorescein isothiocyanate. Real-time monitoring of ER stress by bioluminescence techniques during cancer cell growth would enable us to obtain novel information that is difficult to gain from conventional methods.
In this study, we describe the real-time monitoring of Bip promoter activity based on bioluminescence imaging at the single-cell level during two and three dimensional (2D and 3D) cell culture. We also report the monitoring of Bip promoter activation in tissue slices obtained from U251 tumors, in which U251 cells were stably transfected with the reporter plasmid, by bioluminescence imaging in vitro.
Materials and methods
Materials
Human breast adenocarcinoma cells (MDA-MB-231) and human fibrosarcoma cells (HT1080) were purchased from the American Type Culture Collection (Manassas, VA, USA). Human glioblastoma cell line (U251) was obtained as described previously [13]. The cells were cultured in RPMI-1640 (U251, HT1080, and MDA-MB-231) medium containing 10% fetal bovine serum, 100 μg/mL penicillin, and 100 μg/mL streptomycin at 37°C in an atmosphere of 5% CO2/95% air.
Cell growth assay
Cell growth was assessed using a WST-8 assay as described previously [17]. Briefly, the cells were seeded into 96-well plates at 3000 cells/well, and then the number of living cells was measured by Living Cell Count Reagent SF (Nacalai Tesque, Kyoto, Japan) according to the manufacturer’s protocol. Absorbance was measured at a wavelength of 450 nm using a 96-well microplate reader (GE Healthcare Bioscience, Piscataway, NJ, USA).
Construction of the reporter plasmid, transfection, and reporter assay
The promoter region of Bip (-772 to +97) was amplified by PCR from human genomic DNA (Promega, Madison, WI, USA) based on the human genomic sequence information of NCBI using the following primers: 5′-GGGAGGGGACTCAGATCTGGAGGCAATTCCTTTGGC-3′ and 5′-CGGCAGGGGCCCGGGGTCACAAGCTTCCACGAACCAGGC-3′ as the forward and reverse primers, respectively (mutated nucleotides to introduce BglII and HindIII restriction sites are underlined), and cloned into the BglII-HindIII sites of the pGL4.14 vector (Promega), which contains the gene for firefly luciferase but lacks a eukaryotic promoter or enhancer elements. A reporter assay was carried out as described previously [18]. Briefly, the cells were transfected with the firefly luciferase-containing reporter plasmid containing the Bip promoter (pBipPro-Luc) by Lipofectamine LTX (Invitrogen, Carlsbad, CA, USA) according to the manufacturer’s protocol. The Renilla luciferase-containing plasmid pRL-SV40 (Promega) was used as an internal control for reporter assays using a GloMax 96 microplate luminometer (Promega). The relative activity of firefly luciferase to Renilla luciferase was determined using the Dual-Glo Luciferase Assay System (Promega). ER stress was induced using thapsigargin as described previously [19].
Bioluminescence imaging
Bioluminescence images at the single-cell level were obtained using the LUMINOVIEW LV200 imaging system (Olympus, Tokyo, Japan) as described previously [13]. Briefly, after transient transfection with pBipPro-Luc, the culture dish was kept at 37°C in a humidified chamber. Images were taken using a 40× objective lens with 10- or 30-s exposures at 5- or 10-min intervals while observing Bip promoter activity after the addition of D-luciferin (Promega) at a final concentration of 500 µM. Data analysis was performed using AQUACOSMOS software (ver. 2.6; Hamamatsu Photonics, Shizuoka, Japan). For the long-term observation of Bip promoter activation, U251 cells stably transfected with pBipPro-Luc (U251/pBipPro-Luc/stable cells) were prepared after transient transfection with Lipofectamine LTX according to the manufacturer’s protocol in a selective medium containing 200 μg/mL hygromycin B (Nacalai Tesque), and then bioluminescence images at the single-cell level were obtained using the LV200 system as described above. Bioluminescence images during 3D culture, in which a Cellbed sheet (Japan Vilene, Tokyo, Japan) was used, were obtained using the LV200 system with an ES10ZE focus controller (PRIOR Scientific, Rockland, MA, USA). Images of 5 µm thickness (total 100 mm) were taken using a 40× objective lens with a 10-s exposure at 10-min intervals. Data analysis was performed using cellSens Dimension (ver. 1.9; Olympus) and Volocity 6.3 (PerkinElmer, Waltham, MA, USA) software.
Bioluminescence imaging of Bip promoter activity in tissue slices from U251 tumors
Animal experiment was carried out in accordance with the guidelines of the Animal Research Committee, Kyoto University. A suspension of U251/pBipPro-Luc/stable cells (1.0 × 10⁷ cells/100 mL phosphate-buffered saline [PBS]) was transplanted subcutaneously into nude mice (female, 7-week-old BALB/c nu/nu mice; SLC, Shizuoka, Japan). When the average tumor volume reached approximately 150 mm3, the luminescence intensity of each U251/pBipPro-Luc tumor was confirmed using an IVIS-200 in vivo imaging device (Xenogen, Alameda, CA, USA) after intraperitoneal injection with 100 µL D-luciferin (2 mg/mL), and then the tumor was harvested immediately after the mouse was sacrificed. Tissue slices (400-mm thick) from U251/pBipPro-Luc tumors were prepared using a vibratome-type microslicer (LinearSlicer, Pro7; D.S.K, Kyoto, Japan) in ice-cold PBS according to the manufacturer’s protocol. Bioluminescence imaging of the tumor slices was performed using a 20× objective lens with a 10-s exposure at 10-min intervals on a glass-bottom dish filled with RPMI medium after the addition of D-luciferin at a final concentration of 500 mM using the LV200 system.
Results
Confirmation of the constructed Bip promoter reporter gene under ER stress in cancer cells
We first performed a cell growth assay to compare the growth rate among the U251, HT1080, and MDA-MB-231 cell lines, which were established from different kinds of cancer, but the transfection efficiency of reporter plasmid DNA in these cell lines is at a similar level [13]. As shown in Figure 1A, the growth rate among these cells was different: U251 cells were the most aggressive, while MDA-MB-231 cells had the slowest growth rate among these cell lines under the same culture condition. When we examined the endogenous expression level of Bip protein in U251, HT1080, and MDA-MB-231 cells by western blotting, the expression level of Bip protein was not remarkably different among these cell lines (Supplementary Figure S1). We next performed a reporter assay using the Bip promoter reporter gene (pBipPro-Luc), which contains a cis-acting element in the promoter region that is regulated by ER stress [20], and examined the response of this construct in these cancer cell lines after the induction of ER stress by treatment with thapsigargin. It was confirmed that the constructed Bip reporter gene responded to ER stress in these cancer cell lines with different growth rates (Figure 1B). It was considered that the differences in growth rate among these cancer cells would not contribute to the response level of the Bip promoter following the induction of ER stress.
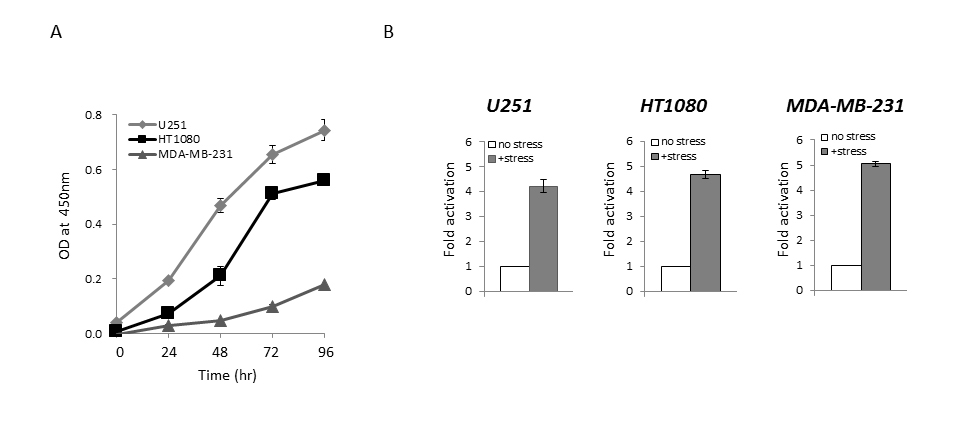
Figure 1. Cell growth and reporter assay using the Bip promoter reporter gene that responds to ER stress
(A) Cell growth assay for U251, HT1080, and MDA-MB-231 cells. Cell growth was assessed using a WST-8 assay at the indicated times. (B) Reporter assay of Bip promoter activation after the induction of ER stress. U251, HT1080, and MDA-MB-231 cells were transiently transfected with pBipPro-Luc, and then the reporter assay was performed using a luminometer after the induction of ER stress by thapsigargin (0.5 mM). Data represent the mean ± standard deviation (SD) from triplicate determinations in 96-well plates.
Time course analysis of Bip promoter activation in cancer cells by bioluminescence imaging at the single-cell level
We performed time course analysis at the single-cell level using the LV200 system to capture bioluminescence images during cancer cell growth (U251, HT1080, and MDA-MB-231) after transient transfection with the Bip reporter gene. Real-time monitoring was also carried out during the growth of these cells. As shown in Figure 2, sufficient luminescence intensity for time course monitoring was observed, and Bip promoter activation was also observed in all lines tested at the single-cell level during growth, although the intensity of the reporter gene was different between the cell lines. The Bip promoter was activated constantly in each examined cell line during growth, and its activation levels were not significantly different between the U251, HT1080, and MDA-MB-231 cells (Figure 2). It is suggested that the activation of the Bip promoter was significant during cancer cell growth, regardless of the different growth rates of these cell lines, and that constant ER stress was induced as described previously [8,9].
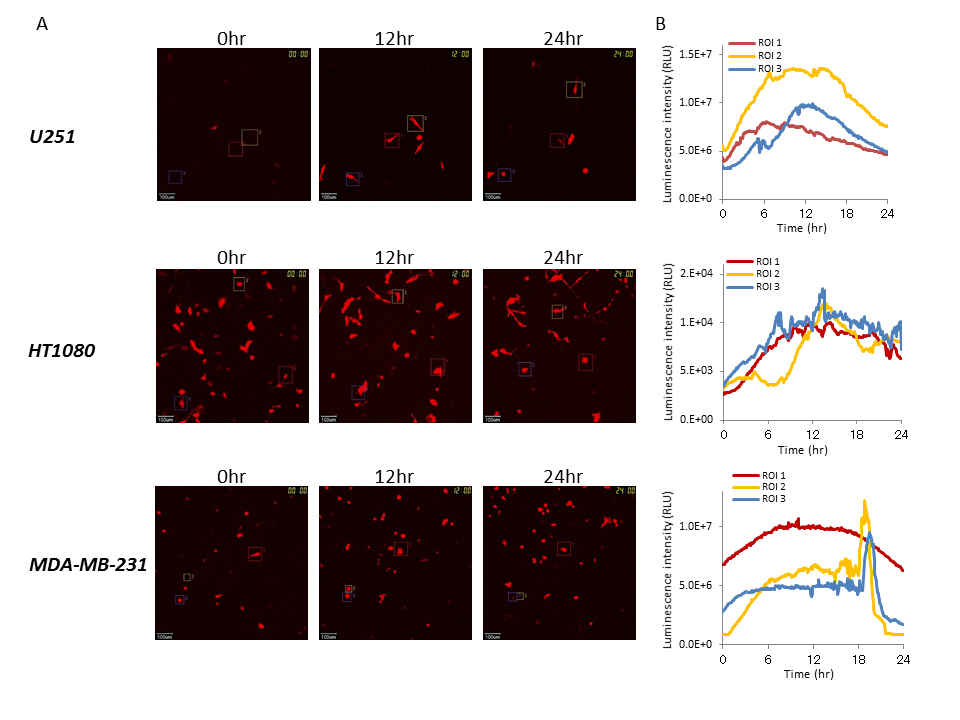
Figure 2. Time course analysis of Bip promoter activation in cancer cells with different growth rates by bioluminescence imaging at the single-cell level
(A) Bioluminescence images of U251, HT1080, and MDA-MB-231 cells transiently transfected with pBipPro-Luc obtained by the LV200 system at 0, 12, and 24 h during cell growth. The squares in the bioluminescence images indicate the regions of interest (ROIs), in which luminescence intensity was measured for time-lapse analysis at the single-cell level. All scale bars are 100 μm. (B) Time course analysis of Bip promoter activation in single-cell imaging. Time course analysis of Bip promoter activation in U251, HT1080, and MDA-MB-231 cells after transient transfection with pBipPro-Luc using the LV200 system.
Time course analysis of Bip promoter activation in U251/pBipPro-Luc/stable cells
As shown in Figures 1 and 2, the luminescence intensity level of the Bip promoter in U251 cells was sufficiently high for time course observations and the growth rate of this cancer cell line was the most aggressive among those analyzed. We next performed time course analysis of Bip promoter activity for a longer time period (>24 h) at the single-cell level using U251/pBipPro-Luc/stable cells, in which U251 cells were stably transfected with the Bip promoter reporter gene, during cell growth. As shown in Figure 3, sufficient luminescence intensity for time course monitoring was observed in the U251/pBipPro-Luc/stable cells, and Bip promoter activation was also found at the single-cell level. Interestingly, the Bip promoter was activated periodically and the change of luminescence intensity occurred especially when the U251/pBipPro-Luc/stable cells were dividing (Figure 3C).
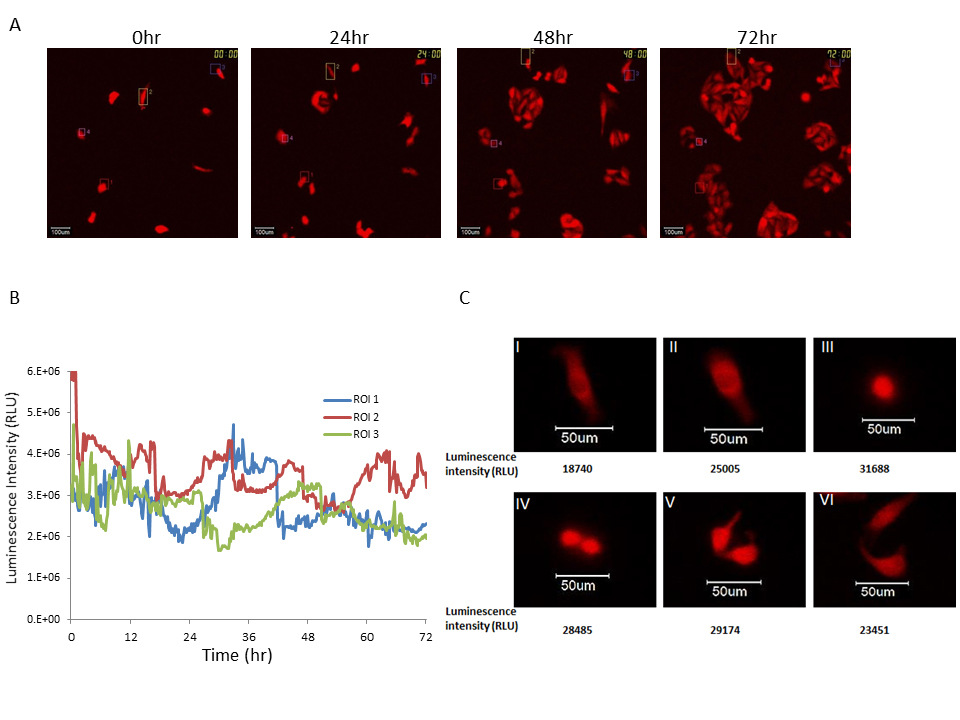
Figure 3. Time course analysis of Bip promoter activation in U251/pBipPro-Luc/stable cells by single-cell level imaging
(A) Bioluminescence images of U251/pBipPro-Luc/stable cells obtained by the LV200 system at 0, 24, 48, and 72 h during cell growth. The squares in the bioluminescence images indicate the ROIs, in which luminescence intensity was measured for time-lapse analysis at the single-cell level. All scale bars are 100 μm. (B) Time course analysis of Bip promoter activation in single-cell imaging. Time course analysis of Bip promoter activation in U251/pBipPro-Luc/stable cells was performed using the LV200 system. (C) Activation of the Bip promoter in dividing cancer cells. The images were taken using a high magnification objective lens (100×) with a 2-min exposure while observing Bip promoter activity. The Roman numerals in the images and numbers below each image indicate the order of cell division and luminescence intensity of these cells at the single-cell level, respectively. All scale bars are 50 μm.
Time course analysis of Bip promoter activation in U251/pBipPro-Luc/stable cells during 3D cell culture by bioluminescence imaging at the single-cell level
Several recent reports showed that 3D cell culture is more physiologically relevant to cell morphology, gene and protein expression patterns, and cellular signaling compared with conventional 2D monolayer cell culture [21-23]. Thus, we performed time course analysis of Bip promoter activity using U251/pBipPro-Luc/stable cells during 3D cell growth. U251/pBipPro-Luc/stable cells were seeded on a Cellbed sheet (as shown in Supplementary Figure S2A), and then the growth of the cancer cells in the 3D culture was confirmed by fluorescence microscopy analysis using CellMask staining (Supplementary Figure S2B). As shown in Figure 4A, bioluminescence images of U251/pBipPro-Luc/stable cells in the 3D culture were also generated using the LV200 system. The luminescence intensity of U251/pBipPro-Luc/stable cells was also sufficiently high for real-time monitoring of Bip promoter activity. In addition, the Bip promoter was also activated periodically during 3D cell culture at five selected regions of interest (ROIs) in the 3D bioluminescence images (Figure 4B and C). These results indicate that the Bip promoter was activated periodically during cancer cell growth and its activation occurred especially when the cells were dividing, similar to the results presented in Figure 3.
Time course analysis of tissue slices obtained from U251/pBipPro-Luc tumors by bioluminescence imaging
Since the Bip promoter was activated in the examined cancer cell lines during growth under both 2D and 3D culture conditions and that many types of cancers reportedly rely on the ER stress response to maintain ER homeostasis [7-9], we investigated Bip promoter activation in tumors by real-time monitoring based on bioluminescence. U251/pBipPro-Luc/stable cells were successfully transplanted subcutaneously into nude mice. As shown in Figure 5A, bioluminescence images of U251/pBipPro-Luc tumors were obtained using the IVIS imaging system, and it was confirmed that the Bip promoter was activated in the established stable cell line. We next examined the luminescence intensity of tissue slices from U251/pBipPro-Luc tumors using the LV200 system. As shown in Figure 5B, luminescence intensity was not constant and appeared different in individual regions; especially, the intensity was higher in the exterior region of the tumor slices compared with the interior region. When we performed time course analysis of bioluminescence with ROIs selected from these different luminescence intensity areas in the tumor slices, the Bip promoter was observed to be activated in several regions (such as ROIs 2, 3, 4, and 7) during incubation in the cell culture medium at 37°C in an atmosphere of 5% CO2/95% air using the LV200 system. It was also observed that there were two apparent activation peaks (at approximately 2.5–3 and 5 days, respectively) of the Bip promoter in the different regions (such as ROIs 5, 6, and 7) during incubation of the slices (Figure 5C). Real-time monitoring of the tumor slices using bioluminescence imaging could be performed until 6 days (144 h), at least on glass-bottom dishes filled with culture medium after the addition of D-luciferin using the LV200 system (Figure 5C), and this was a sufficiently long period to monitor the activation of the promoter in tissue slices, although the overall luminescence intensity decreased gradually (Figure 5B,5C). These results indicate that real-time monitoring of tissue slices based on bioluminescence imaging would be a novel tool for not only the analysis of promoter activation in vivo but also the evaluation of the anti-tumor activity of anti-cancer agents, which would enable us to obtain novel and significant information since we can observe regions on tissue slices in more detail and for a longer period through real-time monitoring with the LV200 system compared with that of conventional methods.
2021 Copyright OAT. All rights reserv
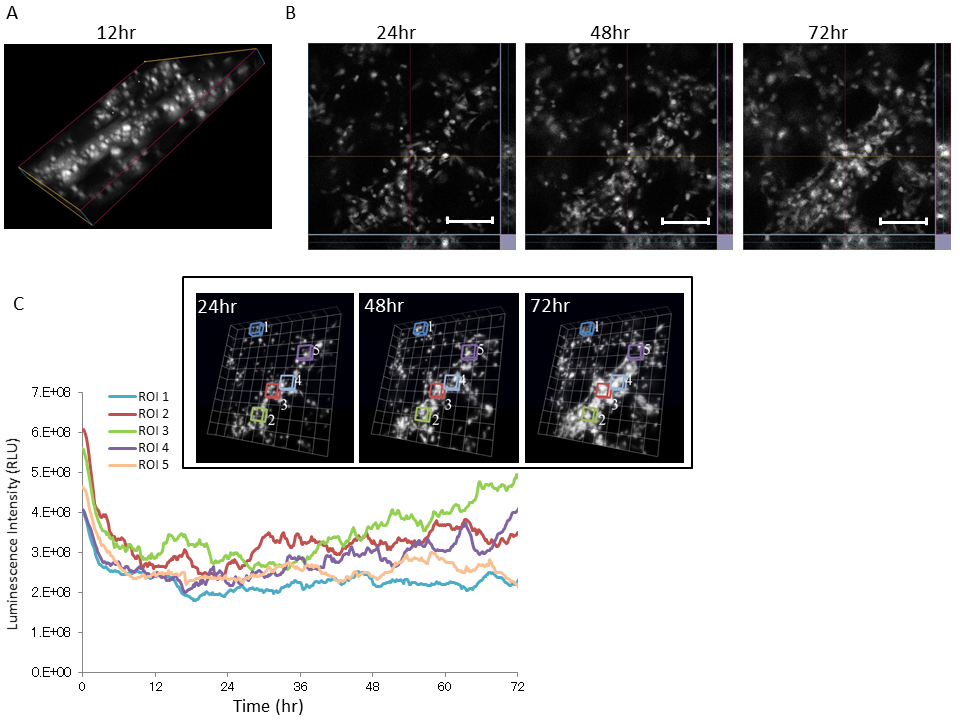
Figure 4. Time course analysis of Bip promoter activation in U251/pBipPro-Luc/stable cells during 3D culture by bioluminescence imaging at the single-cell level
(A) A 3D bioluminescence image of U251/pBipPro-Luc/stable cells at 12 h during 3D cell culture in a Cellbed sheet using the LV200 system. (B) Slice view images of U251/pBipPro-Luc/stable cells at 24, 48, and 72 h during 3D cell culture. All scale bars are 250 μm. (C) Time course analysis of Bip promoter activation in ROIs, which includes several cells that were selected at random, during 3D cell culture. Time course analysis of Bip promoter activation in U251/pBipPro-Luc/stable cells was performed using the LV200 system. The inset indicates 3D bioluminescence images used for time-lapse analysis at 24, 48, and 72 h during 3D cell culture, and the squares in the images indicate the ROIs, in which luminescence intensity was measured for time-lapse analysis. All data from the 3D images were analyzed by cellSens Dimension or Volocity 6.3 software.
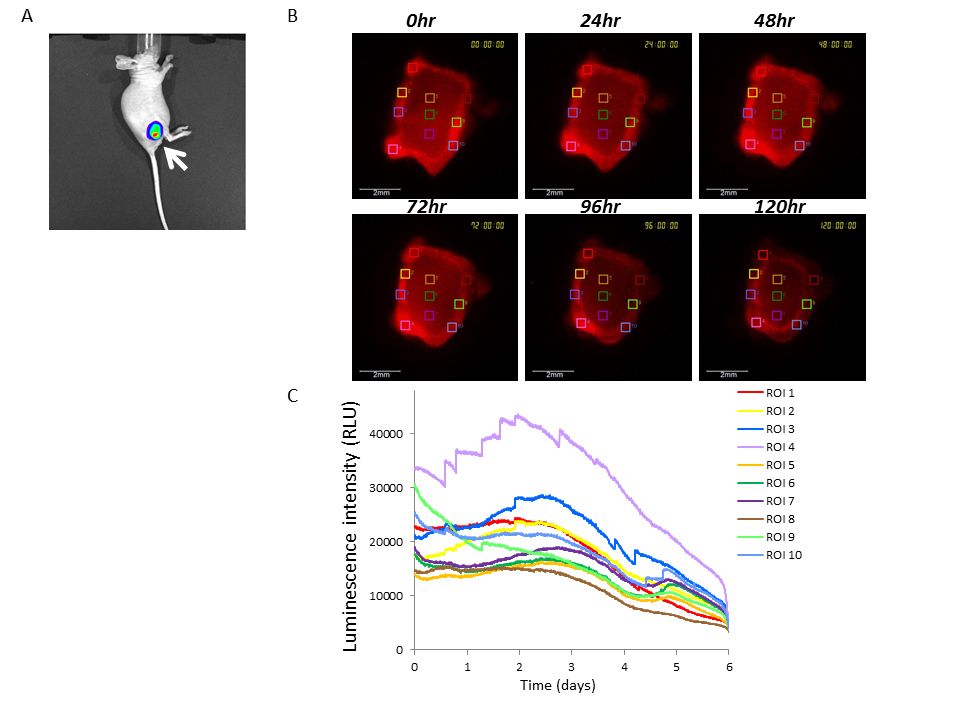
Figure 5. Bioluminescence imaging of U251/pBipPro-Luc tumors or tissue slices using the IVIS or LV200 system
(A)In vivobioluminescence imaging of a U251/pBipPro-Luc tumor-xenografted mouse. The bioluminescence image was obtained with the IVIS spectrum system at 10 min after the injection of D-luciferin. The arrow indicates the tumor region. (B) Bioluminescence images of a tissue slice obtained from a U251/pBipPro-Luc tumor were captured with the LV200 system at 0, 24, 48, 72, 96, and 120 h after the preparation of the sample, and D-luciferin was added to the culture medium. The squares in the bioluminescence images indicate the ROIs in which luminescent intensity was measured for time-lapse analysis. All scale bars are 500 mm. (C) Time course analysis of Bip promoter activation in tissue slices of a U251/pBipPro-Luc tumor. Time course analysis was performed using the LV200 system.
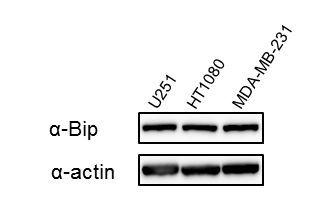
Supplementary Figure S1: Expression levels of Bip protein in U251, HT1080, and MDA-MB-231 cells
Total cell extracts from the indicated cell lines were examined for Bip protein expression by western blotting with an anti-Bip antibody. β-Actin was used as the loading control. Bands were visualized by chemiluminescence.
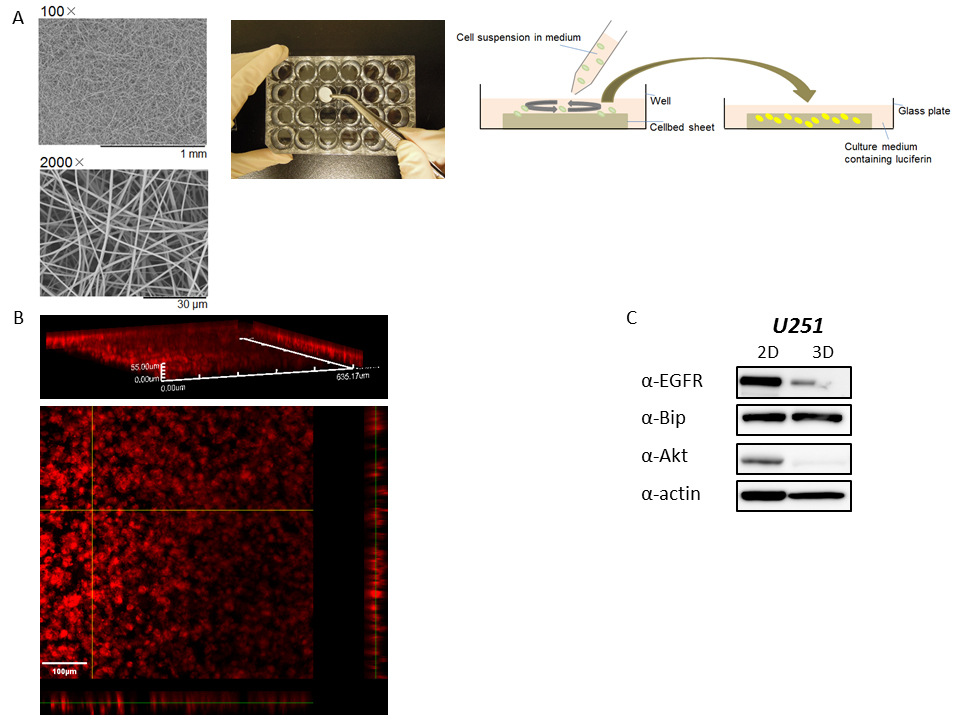
Supplementary Figure S2: 3D culture of cancer cells using a Cellbed sheet
(A) Scanning electron microscopy pictures (left) of a Cellbed sheet, which consists of sterilized high purity silica fibers for 3D cell culture, were taken using a Tabletop Microscope TM3030 (Hitachi High-Technologies, Tokyo, Japan). The Cellbed sheet was placed into a plastic plate as shown in the middle picture, and a cell suspension in medium was seeded on the Cellbed sheet (right diagram). The next day after seeding, the sheet was turned upside down, transferred to a glass-bottom dish containing medium with D-luciferin (right diagram), and then bioluminescence imaging during 3D culture of the cancer cells was performed with the LV200 system. (B) Fluorescence staining of U251/pBipPro-Luc/stable cells after 3D culture. At 5 days of 3D culture of U251/pBipPro-Luc/stable cells in the Cellbed sheet, the sheet was stained with CellMask, which specifically stains the plasma membrane, fixed with 4% paraformaldehyde in PBS, and then fluorescence images were obtained using an FV1000 confocal laser scanning microscope (Olympus). Fluorescence images shown in red taken every 1 mm (for a total of 55 mm thickness) were captured using a 20× objective lens, and then data analysis was performed by FluoView software (Olympus). The scale bar indicates 100 μm. (C) Expression levels of EGFR, Bip, and Akt protein after 2D and 3D culture. Cell extracts after 2D or 3D culture were examined for EGFR, Bip, and Akt expression by western blotting with the corresponding antibodies. β-Actin was used as the loading control, and the bands were visualized by chemiluminescence.
Discussion
The ER stress response is one of the most elucidated organelle-specific stress responses in eukaryotic cells [1], and it is well known that the stress response is a significant key factor for cancer cells to maintain ER homeostasis during their rapid and aggressive growth [7-9]. In this study, we performed real-time monitoring of Bip promoter activity during cancer cell growth under 2D and 3D cell culture conditions using bioluminescence imaging techniques at the single-cell level. We successfully obtained bioluminescence images of Bip promoter activation under these culture conditions by real-time monitoring with the LV200 system. Since elevated levels of Bip reportedly protect cancer cells from death induced by several anti-cancer drugs [10-12], it is suggested that real-time monitoring of Bip promoter activity during cancer cell growth is significant for not only the improvement of the efficacy of chemotherapy but also for the development of new anti-cancer drugs. Although bioluminescence has the disadvantage that its luminescence intensity is lower than that of fluorescence, we reported previously the successful development of a new optical system for bioluminescence imaging at the single-cell level by the combination of a microscope and a conventional cooled charge coupled device camera [24]. In the present study, we demonstrated that this new LV200 optical system enabled us to obtain sufficient luminescence intensity for real-time monitoring in not only transiently transfected cancer cells but also cancer cells stably transfected with a reporter gene for long-term observations.
Malignant gliomas are the most commonly diagnosed and lethal type of malignant adult primary brain tumor, and complete resection is very difficult despite significant improvements in the surgical treatment of these tumors [25]. It was reported previously that Bip is a novel target for the improvement of chemosensitivity in malignant gliomas, and that the combination of agents capable of suppressing Bip with conventional anti-cancer drugs, such as temozolomide, would be a novel approach to eliminate residual cancer cells after surgery and increase the effectiveness of chemotherapy for malignant gliomas [10]. In this study, the Bip promoter was shown to be activated periodically, especially in dividing cells, under 2D and 3D cell culture conditions during cancer cell growth by real-time monitoring at the single-cell level. This finding is supported by a previous report in which the synthesis levels of several chaperone proteins, such as Hsp70, were increased during mitosis, although the total rate of protein synthesis in cells is decreased during mitosis because of increased phosphorylation of elongation factor 2 [26,27], suggesting that the roles of these chaperone proteins are indispensable during this phase of the cell cycle. We also showed that luminescence intensity was higher in the exterior region of tumor slices than in the interior region. These results indicate that the Bip promoter is activated in vigorously growing tumor cells. Thus, it is suggested that the real-time monitoring of Bip promoter activity by bioluminescence shown in this study would be a novel approach for the identification of effective chemotherapy regimens or the development of novel anti-cancer drugs for malignant gliomas.
In this study we used a Cellbed sheet, which consists of sterilized high purity silica fibers and has a suitable structure for cancer cells to grow in 3D in culture medium as shown in Supplementary Figure S2A. The method using this sheet is easy and convenient for 3D cell culture compared with that of using a laminin-rich extracellular matrix, such as Matrigel [22,23]. Luca et al. recently reported that the 3D microenvironment of cancer cells decreased the expression levels of epidermal growth factor receptor (EGFR) and that the pattern of gene expression was clearly altered in 3D cell culture compared with 2D culture [23]. As shown in Supplementary Figure S2C, the expression levels of several proteins such as EGFR and protein kinase B (Akt) were also changed after 3D cell culture using the Cellbed sheet compared with 2D culture. It is suggested that the culture condition of this sheet is different from the 2D monolayer condition and might supply a similar 3D microenvironment with the conventional method described above, although further study of the microenvironment is needed to confirm this hypothesis. We also demonstrated that it was possible to perform time course analysis of Bip promoter activation during 3D cell culture using selected ROIs in 3D bioluminescence images, in which several cells were included. Thus, time course analysis using 3D bioluminescence images obtained from 3D cell culture might provide novel information that is difficult to obtain using imaging of conventional 2D cancer cell cultures.
We also showed that bioluminescence imaging enabled us to monitor Bip promoter activity in tumor slices during incubation in culture medium using the LV200 system (Figure 5B,5C). However, when we performed real-time monitoring using tumor slices, overall luminescence intensity in the tumor slices decreased gradually (Figure 5B,5C). It was reported previously that oxyluciferin is produced by the oxidation of D-luciferin in medium during incubation [28], and it is suggested that oxyluciferin could affect the intensity of luminescence in tumor slices during observation. Although several improvements are needed for real-time monitoring of tumor slices in culture medium by bioluminescence for a period longer than 6 days, this technique with the LV200 system has several advantages associated with the use bioluminescence, such as less damage to living cells, compared with fluorescence. Thus, we can obtain available information from real-time monitoring using bioluminescence imaging at the single-cell level, which is difficult to obtain with the conventional methods. Taken together with our previous report [13], time-lapse analysis based on bioluminescence imaging at the single-cell level shown in this study has several advantages compared with conventional fluorescence imaging or reporter assays with a luminometer and would generate further significant information or findings for the ER stress response in cancer cells.
Conclusions
In summary, the present data describe how a single-cell level bioluminescence imaging system can be used for not only real-time monitoring of promoter activation in individual cells during 2D and 3D cell culture but also real-time monitoring of tissue slices obtained from tumors in vitro. Thus, these observations will be useful for further studies of gene analysis, signal transduction, and regulation of the dynamics of each organelle and organelle-specific stress responses in cancer cells based on a reporter assay using bioluminescence both in vitro and in vivo.
Conflict of interest
Ryutaro Akiyoshi, Yoko Hatta-Ohashi, and Hirobumi Suzuki are employees of Olympus Corporation. Koji Kawakami serves as a scientific advisor to Olympus Corporation. None of the other authors has any potential conflict of interest.
Acknowledgements
We thank Keiko Shimoura, Mitsuko Tachi and Yoshie Masuda (Department of Pharmacoepidemiology, Graduate School of Medicine and Public Health, Kyoto University) for technical assistance with cell culture. We also thank Dr. Masaaki Kawabe, Rie Watanabe, Takuya Iwasa and Kouhei Sasaki (Japan Vilene) for observations of the Cellbed sheet by scanning electron microscopy and technical advice about 3D cell culture. This study was supported by Grants-in-Aid for Scientific Research (B) (grant no. 26290052) and Young Scientists (B) (grant no. 24790072) from the Japan Society for the Promotion of Science. This study was also supported in part by a collaboration research fund from the Olympus Corporation.
Supplemental materials and methods
Materials
An anti-Bip mouse monoclonal antibody was purchased from R&D Systems (Minneapolis, MN, USA). Anti-EGFR, anti-Akt, and anti-Erk1/2 antibodies were purchased from Cell Signaling Technology (Danvers, MA, USA). An anti-β-actin antibody was purchased from Sigma (St. Louis, MO, USA). CellMask was purchased from Invitrogen (Carlsbad, CA, USA).
Western blotting
Western blotting was performed as described previously [1]. Briefly, total protein extracts were prepared from cells lysed with reporter lysis buffer (Promega, Madison, WI, USA), separated by SDS-PAGE, and then transferred to a nitrocellulose membrane using the iBlot system (Invitrogen) according to the manufacturer’s protocol. Quenched membranes were probed with antibodies and analyzed using the enhanced reagent Chemi-Lumi One Super (Nacalai Tesque) with a LAS-3000 LuminoImage analyzer (Fujifilm, Tokyo, Japan).
Supplemental Reference
1. Horibe T, Torisawa A, Kohno M, Kawakami K (2014) Synergetic cytotoxic activity toward breast cancer cells enhanced by the combination of Antp-TPR hybrid peptide targeting Hsp90 and Hsp70-targeted peptide. BMC Cancer 14: 615. [Crossref]
References
- Walter P, Ron D (2011) The unfolded protein response: from stress pathway to homeostatic regulation. Science334: 1081-1086. [Crossref]
- Brostrom MA, Brostrom CO (2003) Calcium dynamics and endoplasmic reticular function in the regulation of protein synthesis: implications for cell growth and adaptability. Cell Calcium34: 345-363.[Crossref]
- Wang G, Yang ZQ, Zhang K (2010) Endoplasmic reticulum stress response in cancer: molecular mechanism and therapeutic potential. Am J Transl Res2: 65-74. [Crossref]
- Yoshida H (2009) ER stress response, peroxisome proliferation, mitochondrial unfolded protein response, and Golgi stress response. IUBMB Life61: 871-879. [Crossref]
- Lee AS (2001) The glucose-regulated proteins: stress induction and clinical applications. TrendsBiochemSci26: 504-510. [Crossref]
- Schönthal AH (2013) Pharmacological targeting of endoplasmic reticulum stress signaling in cancer. BiochemPharmacol85: 653-666. [Crossref]
- Davenport EL, Morgan GJ, Davies FE (2008) Untangling the unfolded protein response. Cell Cycle7: 865-869. [Crossref]
- Ron D, Walter P (2007) Signal integration in the endoplasmic reticulum unfolded protein response. NatRev Mol Cell Biol8: 519-529. [Crossref]
- Yorimitsu T, Nair U, Yang Z, Klionsky DJ (2006) Endoplasmic reticulum stress triggers autophagy. JBiolChem281: 30299-30304. [Crossref]
- Pyrko P, Schönthal AH, Hofman FM, Chen TC, Lee AS (2007) The unfolded protein response regulator GRP78/BiP as a novel target for increasing chemosensitivity in malignant gliomas. CancerRes67: 9809-9816. [Crossref]
- Lee E, Nichols P, Spicer D, Groshen S, Yu MC, et al. (2006) GRP78 as a novel predictor of responsiveness to chemotherapy in breast cancer. Cancer Res66: 7849-7853.[Crossref]
- Wang J, Yin Y, Hua H, Li M, Luo T, et al. (2009) Blockade of GRP78 sensitizes breast cancer cells to microtubules-interfering agents that induce the unfolded protein response. J Cell Mol Med13: 3888-3897. [Crossref]
- Horibe T, Torisawa A, Akiyoshi R, Hatta-Ohashi Y, Suzuki H, et al. (2014) Transfection efficiency of normal and cancer cell lines and monitoring of promoter activity by single-cell bioluminescence imaging. Luminescence29: 96-100. [Crossref]
- Choy G, O'Connor S, Diehn FE, Costouros N, Alexander HR, et al. (2003) Comparison of noninvasive fluorescent and bioluminescent small animal optical imaging. Biotechniques35: 1022-1026, 1028-30. [Crossref]
- Dixit R, Cyr R (2003) Cell damage and reactive oxygen species production induced by fluorescence microscopy: effect on mitosis and guidelines for non-invasive fluorescence microscopy. Plant J 36: 280-290. [Crossref]
- Strayer C, Oyama T, Schultz TF, Raman R, Somers DE, et al. (2000) Cloning of the Arabidopsis clock gene TOC1, an autoregulatory response regulator homolog. Science289: 768-771. [Crossref]
- Kohno M, Horibe T, Haramoto M, Yano Y, Ohara K, et al. (2011) A novel hybrid peptide targeting EGFR-expressing cancers. Eur J Cancer47: 773-783. [Crossref]
- Saito S, Furuno A, Sakurai J, Sakamoto A, Park HR, et al. (2009) Chemical genomics identifies the unfolded protein response as a target for selective cancer cell killing during glucose deprivation. Cancer Res69: 4225-4234. [Crossref]
- Puthalakath H, O'Reilly LA, Gunn P, Lee L, Kelly PN, et al. (2007) ER stress triggers apoptosis by activating BH3-only protein Bim. Cell129: 1337-1349. [Crossref]
- Yoshida H, Haze K, Yanagi H, Yura T, Mori K (1998) Identification of the cis-acting endoplasmic reticulum stress response element responsible for transcriptional induction of mammalian glucose-regulated proteins. Involvement of basic leucine zipper transcription factors. J BiolChem273: 33741-33749. [Crossref]
- Pampaloni F, Reynaud EG, Stelzer EH (2007) The third dimension bridges the gap between cell culture and live tissue. Nat Rev Mol Cell Biol8: 839-845. [Crossref]
- Eke I, Schneider L, Förster C, Zips D, Kunz-Schughart LA, et al. (2013) EGFR/JIP-4/JNK2 signaling attenuates cetuximab-mediated radiosensitization of squamous cell carcinoma cells. Cancer Res73: 297-306. [Crossref]
- Luca AC, Mersch S, Deenen R, Schmidt S, Messner I, et al. (2013) Impact of the 3D microenvironment on phenotype, gene expression, and EGFR inhibition of colorectal cancer cell lines. PLoS One8: e59689. [Crossref]
- Suzuki H, Dosaka S, Ohashi-Hatta Y, Sugiyama T (2007) Luminescence microscope for reporter assay of single live cells. Szalay AA, Hill PJ, Kricka LJ, Stanley PE (Eds.). Bioluminescence and Chemiluminescence14: 53-56.
- Hervey-Jumper SL, Berger MS (2014) Role of surgical resection in low- and high-grade gliomas. CurrTreat Options Neurol16: 284. [Crossref]
- Celis JE, Madsen P, Ryazanov AG (1990) Increased phosphorylation of elongation factor 2 during mitosis in transformed human amnion cells correlates with a decreased rate of protein synthesis. ProcNatlAcadSci U S A87: 4231-4235. [Crossref]
- White-Gilbertson S, Kurtz DT, Voelkel-Johnson C (2009) The role of protein synthesis in cell cycling and cancer. MolOncol3: 402-408. [Crossref]
- Ribeiro C, Esteves da Silva JC (2008) Kinetics of inhibition of firefly luciferase by oxyluciferin and dehydroluciferyl-adenylate. PhotochemPhotobiolSci7: 1085-1090. [Crossref]