Nowadays, one of the main issues still outstanding in solid organ transplantation (OT) field is to achieve better outcome rates based on immune profiles monitoring of allo-reactive responses against graft. In this sense, pharmacokinetics has traditionally been the major tool based on the therapeutic drug monitoring that involves the measurement of particular drug concentrations in biological fluids and the subsequent relationship of those drug concentrations to drug dosing and ultimately clinical events [1]. However, this approach could be very influenced by environmental and non-genetic factors, such as hepatic or renal dysfunction, as well as hormonal levels and potential pharmacokinetics interactions with other co-administrated drugs. All these important conditions can vary significantly during the course of the treatment in different ways, as previously published [2].
In the last years, new approaches providing accurate evidences of how targets for the immunosuppressive treatment along the cellular pathways are affected by the drug exposure have been used. In this sense, blood or plasma drug concentration measurements are only a surrogate for effect. Their use would be unnecessary whether it was possible to measure the immunosuppressive action of these drugs directly, also called pharmacodynamics. Pharmacodynamics assessment can be achieved by particular biomarkers which obtained of the investigation of mechanism of action of immunosuppressive drugs. Different kinds of biomolecules involved in several pathways signaling have been proposed as potential pharmacodynamics biomarkers for immunosuppressive therapy.
These transplant cellular biomarkers can be assessed at different stages within the activation as well as proliferation pathways. More recently, pro- and anti-inflammatory cytokines and chemokines, regulatory lymphocytes (Tregs, Bregs, between other) as well as surface cellular biomarker expression have been studied as pharmacodynamics biomarkers by different research groups. In this sense, lymphocyte proliferation, expression of T-cell surface activation antigens and production of intracellular cytokines were significantly decreased in renal stable transplant recipients (TR) compared with healthy controls [3]. Furthermore, other authors investigated the eventual influence of pharmacodynamics on cytokines production in peripheral blood mononuclear cells by flow cytometry and they found important differences in the Th1/Th2 cytokine expression patterns from cyclosporin A or tacrolimus treated stable renal TR compared with controls [4]. More recently, our colleagues published that within the first week post-transplantation (PT), patients with a percentage of inhibition for soluble IFN-γ, %CD8+-IFN-γ+ and %CD8+-IL2+ lower than 40% developed acute rejection, showing low susceptibility to immunosuppressive drugs [5].
Moreover, in a two independent multi-centre study carried out recently by our group, we have also found that; 1) the frequency of activated Treg lymphocytes (aTreg) (with phenotype, CD4+CD25highCD62L+CD45RO+) in TR who developed acute rejection was higher at baseline in comparison with those TR who did not reject. Moreover, the higher aTreg frequency before liver transplantation (LT) discriminated among TR as an increased risk of acute rejection in renal TR [6,7], and 2) the intracellular production of IFN-γ and IL-2 cytokine on CD4 and CD8 T-cells as well as IL-17A protein were able to identify liver and kidney patients for high risk of acute rejection at baseline as well as within the first month PT [8].
Nowadays, one of the main goals into the solid OT field is to achieve which biomolecules of allo-immune response could be useful as potential predictive biomarkers for different clinical events, such as acute and chronic rejection or viral infection. Very recently we have also analyzed and monitored the expression of a selected panel of surface biomarkers in both, cultured CD4+ and CD8+ T-lymphocyte along first year PT as potential predictive biomarkers for acute rejection in TR who received orthotopic LT. The percentage of T-lymphocytes was monitored at pre-LT and 1st week, 2nd weeks, 1st, 2nd, 3rd and 6th month as well as 1 year PT. Biomarker panel was evaluated in whole peripheral blood cultures under polyclonal stimulation with Concanavalin A, as previously published [9]. In this study, TR who had experienced an acute rejection episode within the first month PT displayed higher levels of CD38+CD4+ T cells at baseline in comparison with TR with stable graft function (Figure 1A). Furthermore, the expression of CD154+CD4+ T cells was also higher in TR suffering acute rejection than in TR without acute rejection apparition (Figure 1B).
The CD38 and CD154 percentages on CD4 T cells before LT were assessed as eventual biomarkers of acute rejection. The ROC curve analysis based on AUC permitted show that TR with a pre-LT percentage of CD4+CD38+ above 64.85% proved to have increased risk of acute rejection development. Likewise, the same analysis showed that TR with a pre-LT percentage of CD4+CD154+ above 2.98% had also increased acute rejection risk.
Indeed, baseline percentages of CD38+ and CD154+ on CD4 T cells were the only variables independently associated with an increased risk of acute rejection episode development in a multivariate logistic regression analysis. Specifically, the CD38 percentage before LT was associated with a 1.053-fold increased risk of acute rejection development whereas the CD154 percentage was associated with a 0.816-fold increased risk of acute rejection. This model was able to predict 73% of acute rejection episodes, and the AUC for the combination of %CD8+CD38+ and %CD8+CD154+ was 0.767.
On the other hand, PT levels of CD69 and CD95 allow assessing the risk of early acute rejection within the first month PT, as in comparison with stable graft TR, those who rejected within the first month PT displayed higher levels of CD69 on CD4 (Figure 1C) at 2nd week PT, as well as on CD8 T lymphocytes at 1st and 2nd (Figure 1D) week PT. Furthermore, CD95 percentages on CD4 T lymphocytes were also higher in rejectors TR than in non-rejectors TR at 2nd week and 1st month (Figure 1E) PT, whereas CD95 on CD8 T cells displayed higher levels at 1st week, 2nd week and 1st month (Figure 1F) PT.
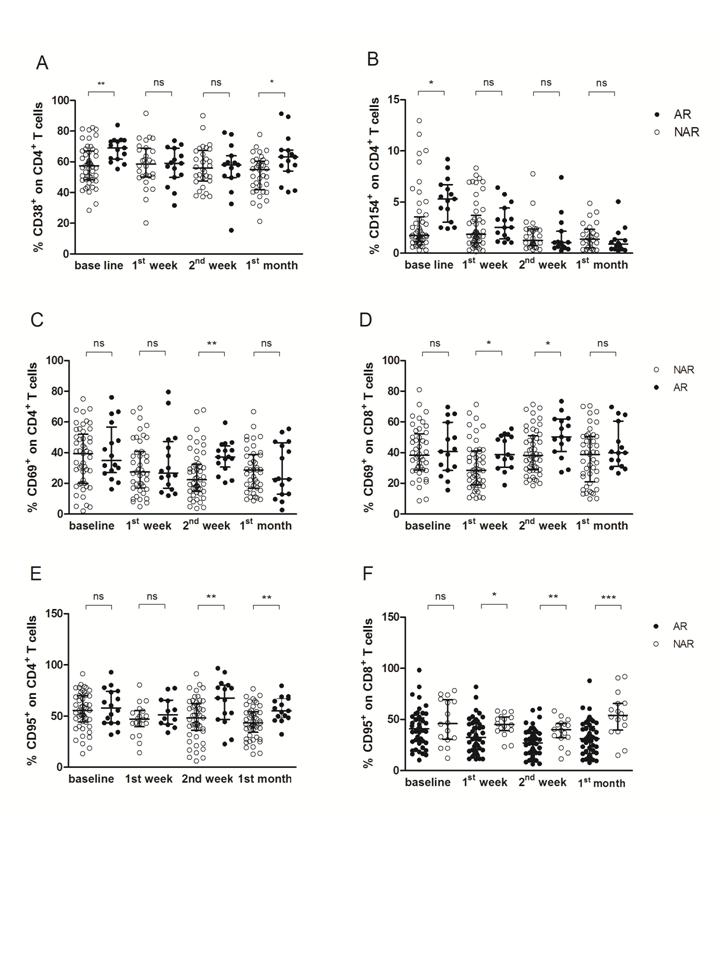
Figure 1. Pre-transplantation, 1st and 2nd week and 1st month post-transplantation levels of CD38+, CD69+, CD95+ as well as CD154+ on CD4+ and CD8+ T cells as predictive biomarkers of early acute rejection-AR. A) Percentage of CD38+CD4+ T cells, B) percentage of CD154+CD4+ T cells, C) percentage of CD69+CD4+ T cells, D) percentage of CD69+CD8+ T cells, E) percentage of CD95+CD4+ T cells and F) percentage of CD95+CD8+ T cells in orthotopic liver transplant recipients with acute rejection (AR, black circles) as well as in patients with stable graft function (NAR, white circles). The lines reflect median with interquartile range at any time point for each study group. *P<0.05, **P<0.01, ***P<0.0001.
Cut-off values (AUC of ROC curves) for predicting acute rejection for %CD69+CD4+, %CD69+CD8+, %CD95+CD4+ and %CD95+CD8+ T cells accurately discriminated between TR with and without acute rejection within the first month PT.
A predictive model of acute rejection was then constructed in order to identify the best PT combination of biomarkers with the best discriminatory capacity between rejectors TR and non-rejectors TR. This model included the 1st and 2nd weeks as well as 1st month biomarkers value profiles, since all acute rejection episodes occurred during the first month PT.
A significant correlation between acute rejection episodes development with the %CD8+CD69+ and %CD8+CD95+ levels at 1st week PT in a multivariate analysis. First, with levels of %CD4+CD69+, %CD8+CD69+, %CD4+CD95+ and %CD8+CD95+, the model was able to predict 81.3% of acute rejection episodes at 1st week PT, when the AUC for the combination of %CD8+CD69+ and %CD8+CD95+ was 0.767. Second, with levels of %CD4+CD95+ and %CD8+CD95+, the model was able to predict 84.6% of acute rejection episodes at 2nd week PT, when the AUC for the combination of %CD4+CD69+, %CD8+CD69+, %CD4+CD95+ and %CD8+CD95+ was 0.775. Finally, our model was able to predict 75% of acute rejection 1st month with an AUC of 0.883 for the %CD4+CD95+ and %CD8+CD95+ combination.
2021 Copyright OAT. All rights reserv
New approaches able to reflect individual responses produced in each TR are required to monitor immunosuppressive treatment and increase efficacy and safety of therapy [10]. Thus, in the last few years several studies have been published to clarify the potential role of the T cell activation surface antigens as surrogate biomarkers of immunomodulatory effect of immunosuppressive drugs.
Our group has very recently reported an effective non-invasive method for monitoring the frequency of CD38, CD69, CD95 and CD154 against allograft with a regression model that is able to discriminate those patients at a high risk of acute rejection episode within the first month PT [9].
The identification of pre- and post-LT predictive biomarkers of the risk of acute rejection episodes is crucial in order to efficiently adjust the administered immunosuppressive therapy where supply the exact dose plays a key role maintaining the correct status of immune system.
We have observed significant differences in the level of several T cell surface antigens between patients with and without acute rejection. In particular, in this recent study, pre-LT levels of CD38+CD4+ and CD154+CD8+ were higher in TR who developed acute rejection which served to identify TR with high risk of acute rejection based on the cut-off values obtained by the AUC of the ROC curve analysis. Moreover, the combination of these markers following a logistic regression model demonstrated that TR with high levels of CD38+CD4+ and CD154+CD8+ had a probability of 73% of a future acute rejection [9].
In addition, in the earlier PT period, we also found that TR suffering acute rejection had higher levels of CD69 and CD95 in CD4 as well as CD8 T cells in comparison with TR without rejection. The cut-off values obtained from the ROC curve analysis could stratify this group of TR with high risk of acute rejection. Specifically, the logistic regression model pointed out that the combination of CD69 and CD95 on CD8 T cells at 1st week PT predicted 81.3% of acute rejection episodes; the combination of CD69 and CD95 on CD4 as well as CD8 T cells at 2nd week PT predicted further 84.6% of acute rejection episodes; and finally, the combination of CD95 on CD4 and CD8 T cells at 1st month PT predicted 75% of acute rejection episodes [9].
Our results are in concordance with several studies showing higher levels of several human leukocyte membrane proteins in solid organ TR who had developed rejection episodes. They found a different pattern of expression in several T lymphocyte surface antigens, such as CD11a, CD154, CD25, CD71 and CD95, among kidney TR in comparison with controls [3].
There are a considerable number of studies correlating the expression of the lymphocyte earlier activation marker CD69 in TR who had experienced an acute rejection episode. CD69 expression on CD3, CD4 as well as CD8 T cells was lower in controls and TR without allograft rejection, reflecting differences in antigen surface expression in acute rejection episodes, as published [11]. Moreover, other authors phenotyped the lymphocyte infiltrate in the endomyocardium of human rejecting heart allografts as CD69+CD8+, suggesting that CD69 is relevant to the CD8+ cell-mediated graft rejection events [12]. Other authors correlated a higher expression of CD69 in CD4 as well as CD8 peripheral T cells with histologic evidences of cardiac allograft rejection [13]. Whilst these studies were focused on the expression of these markers only during acute rejection episodes, our results go one step forward not only observing higher levels in TR suffering acute rejection, but also proposing these surface biomarkers as predictive for acute rejection as well as monitoring the allo-response against the graft within the first PT.
Biomarker monitoring at pre- as well as the earlier PT period is useful since it might allow adjusting the administered treatment given to each TR leading to an individual immunosuppressive treatment to prevent not only acute rejection, but also opportunistic infection.
We have demonstrated that liver TR with an increased risk of acute rejection at any time point within the first month PT presented higher level expression of CD38, CD69, CD95 and CD154 in both CD4 and CD8 T cells.
Our results establishes that the monitoring of CD38, CD69, CD95 and CD154 on peripheral T lymphocytes may be useful for clinicians in order to establish better doses of immunosuppressant drugs, at baseline and especially along the first month PT where the higher incidence of acute rejection in LT has been reported [14].
Nevertheless the possible limitations of our studies and other similar reported studies, we propose that monitoring the peripheral expression of cellular marker in T lymphocytes of liver TR could be useful acute rejection biomarkers for assessing immune status of TR.
Our studies afford a first approach where PT assessment of several surface antigen percentages may lead to stratify liver TR at high risk of acute rejection development, that allow more effectively to predict acute rejection and personalize immunosuppressive treatment.
This work was possible thank to support from projects from Fondo de Investigación Sanitaria [PI11/02686 & PI15/01370), and CIBERehd [funded by Instituto de Salud Carlos III (ISCIII)].
- Cattaneo D, Perico N, Remuzzi G (2004) From Pharmacokinetics to Pharmacogenomics: A new approach to tailor immunosuppressive therapy. Am J Transplant 4: 299-310.
- Johnston A, Holt DW (2001). Immunosuppressant drugs–the role of therapeutic drug monitoring. Br J Clin Pharmacol 52(Suppl 1): 61S–73S.
- Stalder M, Bîrsan T, Holm B, Haririfar M, Scandling J, Morris RE (2003) Quantification of immunosuppression by flow cytometry in stable renal transplant recipients. Ther Drug Monit 25: 22-27.
- Rostaing L, Puyoo O, Tkaczuk J (1999) Differences in type 1 and type 2 intracytoplasmic cytokines, detected by flow cytometry, according to immunosuppression (cyclosporine A vs. tacrolimus) in stable renal allograft recipients. Clin Transplant 13: 400-409.
- Millán O, Rafael-Valdivia L, Torrademé E, López A, Fortuna V (2013) Intracellular IFN-γ and IL-2 expression monitoring as surrogate markers of the risk of acute rejection and personal drug response in de novo liver transplant recipients. Cytokine 61: 556-564.
- San Segundo D, Millán O, Muñoz-Cacho P, Boix F, Paz-Artal E, et al (2014). High Proportion of pretransplantation activated regulatory T cells (CD4+CD25highCD62L+CD45RO+) predicts acute rejection in kidney transplantation: Results of a multicenter study. Transplantation 98: 1213-1218.
- Boix F, Millan O, San Segundo D, Mancebo E, Miras M, et al. (2015) Activated Regulatory T Cells Expressing CD4(+)CD25(high)CD45RO(+)CD62L(+) Biomarkers Could Be a Risk Factor in Liver Allograft Rejection. Transplant Proc 47: 2380-2381. [Crossref]
- Millán O, Rafael-Valdivia L, San Segundo D, Boix F, Castro-Panete MJ, et al (2014) Should IFN-γ, IL-17 and IL-2 be considered predictive biomarkers of acute rejection in liver and kidney transplant? Results of a multicentric study. Clin Immunol 154: 141-154.
- Boix F, Millan O, San Segundo D, Mancebo E, Rimola A, et al (2016) High expression of CD38, CD69, CD95 and CD154 biomarkers in cultured peripheral T lymphocytes correlates with an increased risk of acute rejection in liver allograft recipients. Immunobiology 221: 595-603. [Crossref]
- Galián JA, Mrowiec A, Muro M (2016) Molecular targets on B-cells to prevent and treat antibody-mediated rejection in organ transplantation. Present and Future. Expert Opin Ther Targets 20: 859-867. [Crossref]
- Posselt AM, Vincenti F, Bedolli M, Lantz M, Roberts JP, et al. (2003) CD69 expression on peripheral CD8 T cells correlates with acute rejection in renal transplant recipients. Transplantation 76: 190-195.
- Santamaria M, Marubayashi M, Arizon JM, Montero A, Concha M, et al. (1992) The activation antigen CD69 is selectively expressed on CD8+ endomyocardium infiltrating T lymphocytes in human rejecting heart allografts. Hum Immunol 33: 1-4. [Crossref]
- Schowengerdt KO, Fricker FJ, Bahjat KS, Kuntz ST (2000) Increased expression of the lymphocyte early activation marker CD69 in peripheral blood correlates with histologic evidence of cardiac allograft rejection. Transplantation 69: 2102-2107.
- Wiesner RH, Demetris AJ, Belle SH, Seaberg EC, Lake JR, et al. (1998) Acute hepatic allograft rejection: incidence, risk factors and impact on outcome. Hepatology 28: 638-645.