Medical treatment using high-voltage electric potential (HELP) device to generate an electric field (EF) is an alternative therapy commonly used in Japan. However, little is known about the underlying mechanisms of the potential benefits to health. The identification of EF exposure -related biomarkers is key to understanding the beneficial effects of EF therapy. We screened plasma metabolites obtained prior to and immediately after HELP exposure (18 kV, 30 min) in 10 healthy human subjects by via non-targeted plasma metabolomic analysis. Among 161 metabolites, several fatty acid amides containing a signaling molecule oleoylethanolamide (OEA) and fatty acids were significantly upregulated. Under these conditions, HELP exposure had no effect on citric acid and ornithine cycle intermediates. Because OEA is known to induce lipolysis as a putative endogenous ligand of peroxisome proliferator-activated receptor (PPAR)-α, we further confirmed the effect of OEA on gene expression using human subcutaneous cultured adipocytes. Peroxisomal acyl-coenzyme A oxidase 1 (ACOX1) mRNA was upregulated by OEA treatment. OEA-induced ACOX1 mRNA expression was sensitive to a PPAR-α antagonist GW6471. Our findings will provide the new insights into the molecular mechanisms of EF therapy.
biomarker; oleoylethanolamide; peroxisomal acyl-coenzyme A oxidase 1
ACOX1: peroxisomal acyl-coenzyme A oxidase 1; ACSL3: acyl-CoA synthetase long-chain family member 3; CE-TOFMS: capillary electrophoresis-time-of-flight mass spectrometry electron ionization-mass spectrometry; CYP4A11: cytochrome P450, family 4, subfamily A, polypeptide 11; DGAT2: diacylglycerol acyltransferase-2; EF: electric field; ELISA: enzyme-linked immunosorbent assay; FAT/CD36: fatty acid translocase /cluster of differentiation 36; GAPDH: glyceraldehyde 3-phosphate dehydrogenase; GPR: G protein-coupled receptor; GW6471: N-((2S)-2-(((1Z)-1-methyl-3-oxo-3-(4-(trifluoromethyl)
phenyl)prop-1-enyl)amino)-3-(4-(2-(5-methyl-2-phenyl-1,3-oxazol-4-yl)ethoxy)phenyl) proyl) propanamide; GW9662: 2-chloro-5-nitro-N–phenyl-benzamide; HDLBP: high density lipoprotein binding protein; HDL-C: high density lipoprotein-cholesterol; HELP: high-voltage electric potential; LC-TOFMS: liquid chromatography-time -of-flight mass spectrometry electron ionization-mass spectrometry; LDL-C: low density lipoprotein-cholesterol; mRNA: messenger ribonucleic acid; OEA: oleoylethanolamide; PPAR-α: peroxisome proliferator-activated receptor-alpha; qRT-PCR: quantitative reverse transcription polymerase chain reaction; TRPV1: transient receptor potential vanilloid 1
A therapeutic device to expose the human body to high-voltage electric potential (HELP) was approved by the Ministry of Health, Labour and Welfare in Japan. High-voltage electric field (EF) therapy is reportedly an effective treatment for stiff shoulders, constipation, insomnia and headache, while the effects of EF exposure on several blood parameters and liver diacylglycerol acyltransferase-2 (DGAT2) mRNA expression have been described [1-3]. However, much of the evidence regarding the effect of EF was based on manipulations involving immobilization stress using experimental animals. Thus, it remains unclear whether the observations following EF exposure were derived individually from EF exposure or in conjunction with immobilization stress. Several human studies have reported the effects of whole-body exposure to HELP on clinical biochemical parameters [4-6], and described a visual analog scale to measure pain [7-9]. Taken together, the results of these studies suggest that HELP exposure may present an alternative therapy for several conditions, although, the mechanisms remain elusive.
Endogenous metabolites have been suggested as candidate molecules that may represent an interface between symptoms and therapeutic target proteins. Metabolomics is a relatively recent discipline dedicated to the global study of endogenous metabolites in tissues and biofluids [10-12]. Considerable evidence on the identification of the link between endogenous metabolites and symptoms has been obtained from studies using non-targeted metabolomics in the dorsal horn of rats with neuropathic pain [13]. A non-targeted metabolomic approach may be useful to identify EF-induced biomarkers. The aim of the present study was to clarify changes to endogenous small molecules after EF exposure. We screened the metabolic differences in plasma samples obtained from healthy subjects before and after acute EF exposure using capillary electrophoresis (CE)-time-of-flight mass spectrometry (TOFMS) and liquid chromatography (LC)-TOFMS. The results of this study indicate that EF exposure results in increased levels of the endogenous signaling molecule oleoylethanolamide (OEA). Because OEA has been shown to bind to peroxisome proliferator-activated receptor (PPAR)-α [14], we also investigated whether OEA altered gene expression profiles in human subcutaneous adipocytes by microarray analysis.
EF exposure
The system used for EF exposure has been previously described [6,8,15]. The EF system was equipped with a transformer, a seat, and two insulator-covered electrodes that were placed on a floor plate on which the subject’s feet were located and above the head of the subject. EF generated by the HELP apparatus (Healthtron PRO-18T or Hb9000T; Hakuju Institute for Health Science Co., Ltd., Tokyo, Japan) was created uniformly by transforming 50 Hz alternating current at 18 kV and 9 kV, respectively. The surface EF levels generated by the high voltage (9 kV) electric potential supply were 9.96 kV/m to the neck or 11.6 kV/m to the legs. The safety of this system for human use was established by the Japanese government in 1963.
Subjects
Ten healthy adults (5 males and 5 females; mean age, 40.2 ± 10.2 years; mean body mass index (BMI), 22.0 ± 2.4 kg/m2) participated in experiment 1 (exposure conditions: 18 kV for 30 min). Ten healthy adults (6 males and 4 females; mean age, 44.4 ± 9.7 years; BMI, 22.3 ± 3.2 kg/m2) participated in experiment 2 (exposure conditions: 9 kV for 30 min). The experiments were performed in the morning and all participants signed an informed consent form after receiving verbal and written information about the study. The experiments were conducted in accordance with the Declaration of Helsinki and the study protocol was approved by the human ethics committee of Hakuju Institute for Health Science Co., Ltd. (Tokyo, Japan).
Sample preparation
Blood samples were collected in vacutainer tubes coated with ethylenediaminetetraacetic acid (VP-NA070K; Terumo Corporation, Tokyo, Japan) and immediately centrifuged at 800 x g for 5 min using centrifuge to separate plasma from other cellular materials. Subsequently, plasma was transferred to a fresh eppendorf tube and stored at -80 0C until processed.
CE-TOFMS measurements
Metabolites were measured as described previously [10,16,17]. In brief, 50 μL of plasma was added to 450 μL of methanol containing internal standards (Solution ID: H3304-1002; Human Metabolome Technologies, Tsuruoka, Japan) at 0ºC in order to inactivate enzymes. The extract solution was thoroughly mixed with 500 μL of chloroform and 200 μL of Milli-Q water and centrifuged at 2,300 x g and 40C for 5 min. Then, 350 μ L of the upper aqueous layer was centrifugally filtered through a Millipore 5-kDa cut-off filter (Millipore Corporation, Billerica, MA, USA) to remove proteins. The filtrate was centrifugally concentrated and re-suspended in 50 μL of Milli-Q water for CE-MS analysis.
LC-TOFMS measurement
A 500-μL aliquot of plasma was added to 1,500 μL of 1 % formic acid/acetonitrile containing internal standard solution (Solution ID: H3304-1002, Human Metabolome Technologies) at 00C in order to inactivate enzymes. The solution was thoroughly mixed and centrifuged at 2,300 x g and 4 0C for 5 min. The supernatant was filtrated using a hybrid SPE phospholipid cartridge (55261-U; Supelco, Bellefonte, PA, USA) to remove phospholipids. The filtrate was desiccated and then dissolved in 100 μL of isopropanol /Milli-Q water for LC-MS analysis. LC-TOFMS was performed using an Agilent LC System (Agilent 1200 series RRLC system SL) equipped with an Agilent 6230 TOF mass spectrometer (Agilent Technologies, Waldbronn, Germany). The systems were controlled using Agilent G2201AA ChemStation software version B.03.01 for CE (Agilent Technologies). Cationic and anionic compounds were measured using an octadecylsilane column (2×50 mm, 2 μM), as previously described [10,16,17]. Peaks were extracted using the MasterHands automatic integration software (Keio University, Tsuruoka, Japan) to obtain peak information including the m/z ratio, retention time for LC-TOFMS measurement (RT), and peak area. Signal peaks corresponding to isotopomers, adduct ions, and other producted ions of known metabolites were excluded. The remaining peaks were annotated with putative metabolites from the HMT metabolite database based on MT/RT and m/z values as determined by TOFMS. The tolerance range for the peak annotation was configured at ± 0.5 min for MT and ± 10 ppm for m/z. In addition, peak areas were normalized against those of the internal standards and then the resultant relative area values were further normalized by sample amount.
Molecular modeling and docking study
The X-ray crystal structure of PPAR-α complexed with agonist AZ242 (1i7g; Protein Data Bank Japan) was used for the molecule docking [18]. A docking study of the binding of OEA to PPAR-α was performed using the Surflex-Dock program included with the Sybyl-X2.0 software package (Tripos International, St. Louis, MO). The docking experiment was performed five times and yielded five docking positions.
Affymetrix GeneChip microarray
Human white subcutenous preadipocytes (Lonza, Basel, Switzerland) were cultured in preadipocyte basal medium-2 (Lonza) supplemented with 2 mM L-glutamine and 10% fetal bovine serum (Lonza). In brief, 1 x 10⁴ cells were seeded in wells of 96-well multiwall plates. Differentiation was induced by treating the cells with a differentiation medium containing insulin, dexamethasone, indomethacin and 3-isobutyl-1-methylxanthine (all supplied by Lonza) for 6 days. RNA isolated from each sample was processed and hybridized to an Affymetrix GeneChip Human genome U133 Plus 2.0 array according to the protocols described in the GeneChip Expression Analysis Technical Manual (Affymetrix, Santa Clara, CA, USA). Raw data was submitted to the National Center for Biotechnology Information (NCBI) Gene Expression Omunibus (GEO) database (http://www.ncbi.nlm.gov/geo/, platform accession number GSE55539).
Quantitative real-time polymerase chain reaction (qRT-PCR)
qRT-PCR was performed as described [19]. In brief, total RNA (1 μg) was isolated from mycelia fragments using the RNeasy Plus Micro Kit (Qiagen, Valencia, CA, USA) and then reverse transcribed using QuantiTect Reverse Transcription Kit (Qiagen) with the following primers : ACOX1-F, GTA TGG AAT CAG TCA GAA CGC; ACOX1-R, CTT GTA AGA TTC GTG GAC CTC; FAT/CD36-F, TTG ATG TGC AAA ATC CAC AGG; FAT/CD36-R; TGT GTT GTC CTC AGC GTC CT; ACSL3-F, GAG AGT TTG AAC CCG ATG GA; ACSL3-R, TTG GCA CAA CAA ATC CAA TG; HDLBP-F, CCG TCC GAG AGG CAC AGA; HDLBP-R, CCG CCA TAC TCT TCA GCA ATC; PPAR-α-CAG AAC AAG GAG GCG GAG GTC ; PPAR-α-R, TTC AGG TCC AAG TTT GCG AAG C; PPAR-γ-F, ACC AAA GTG CAA TCA AAG TGG A; PPAR-α-R, ATG AGG GAG TTG GAA GGC TCT; and GAPDH-F, CAT CCC TGC CTC TAC TGG CGC TGC C; GAPDH-R, CCA GGA TGC CCT TGA GGG GGC CCT C. All qPT-PCR reactions were performed using SYBR Premix EX Tag (Takara Bio Inc., Otsu, Japan). Amplification and detection were performed under the following conditions: 950C (10 sec) and 600C (1 min) for 50 cycles. Fold induction values were calculated according to the equation 2ΔΔCt, indicating the differences in cycle threshold numbers between the target gene and glyceraldehyde 3-phosphate dehydrogenase 2 (GAPDH2) where ΔΔCt represents the relative values in the differences between controls and treatments.
Chemicals
Oleoylethanolamide (OEA), GW6471 and GW9662 were purchased from Sigma-Aldrich Chemie GmbH (Steinheim, Germany).
Statistical analysis
The data was analyzed using Welch’s t-test. A probability (p) value < 0.05 was considered statistically significant.
Effect of HELP exposure on metabolites in plasma from healthy humans
CE- and LC-TOFMS analyses were used to measure the abundance of a total of 161 metabolites in the plasma obtained from healthy participants. The results of hierarchical cluster analysis of metabolic patterns are shown in Figure 1. There was a remarkable difference in metabolites before and after HELP (18 kV, 30 min) exposure (Table 1). In total, 31 metabolites were significantly upregulated after HELP exposure which included fatty acid amides (OEA, palmitoylethanolamide, and stearoylethanolamide); fatty acids [oleic acid, linoleic acid, linolenic acid, cis-4,7,10,13,16,19-docosahexaenoic acid, cis-5,8,11,14,17-eicosapentaenoic acid, cis-8,11,14-eicosatrienoic acid, cis-11,14-eicosadienoic acid, cis-11-eicosenoic acid, arachidonic acid, ethyl arachidonate, nervonic acid, FA(22:5), FA(22:4), FA(19:1), FA(17:0), FA(14:0), palmitic acid, stearic acid, and heptadecanoic acid]; amino acids (isethionic acid, N-acetylglycine, N-acetylalanine, and phosphocreatine); steroids (dehydroisoandrosterone 3-sulfate, and etiocholan-3 α-ol-17-one sulfate); UDP; 2-hydroxybutyric acid; and threonic acid. In contrast, 26 metabolites were downregulated after HELP exposure which included fatty acids [lauric acid, decanoic acid, pelargonic acid, octanoic acid, heptanoic acid, hexanoic acid, valenic acid, AC(18:2), AC(16:2), AC(16:1), AC(14:2), AC(14:0), AC(12:1), and AC(12:0)]; amino acids (Ala, Tyr, Phe, Trp, Met, cystine, hydroxyproline, sarcosine, hippuric acid, and γ-butyrobetaine); glycochenodeoxycholic acid; and cholesterol sulfate. Under these conditions, there was no effect of HELP (18 kV, 30 min) exposure against cortisol/cortisone in plasma from healthy participants. In addition, HELP (18 kV, 30 min) exposure had no effect on citric acid and ornithine cycle intermediates.
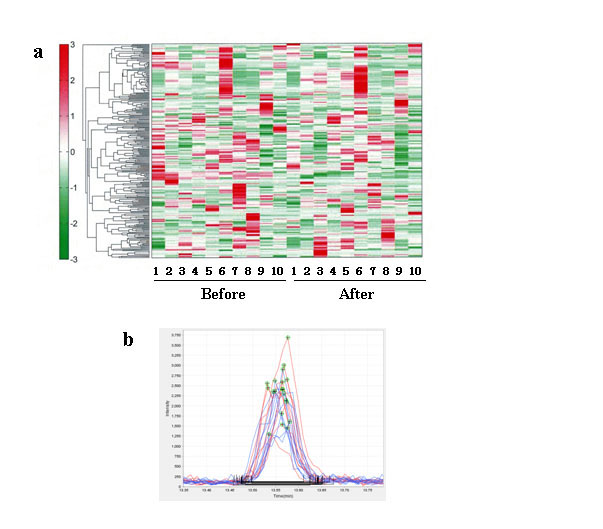
Figure 1. Metabolomic analysis of human healthy plasma between before and after HELP (18 kV) exposure for 30 min. (a) Heat map representation of hierarchical clustering of molecular features found in each sample (B: before, n = 10; A: immediately after exposure, n = 10). Red and green indicate high and low concentrations of metabolites, respectively. (b) Typical OEA peak in healthy human plasma. OEA detected by LC-TOFMS. The figure includes overlaid electropherograms of before (blue) and after (red) samples.
Furthermore, the nature of the OEA responsible for EF strength was investigated. The OEA change in relative ratio of after/before was at 1.17 (p = 0.079) for 9 kV. We also examined the effect of different processing time (60 min), but found no significant changes caused by HELP (18 kV) exposure (1.09-fold; p = 0.422).
Table 1. Non-targeted metabolite profiling in human healthy plasma
Metabolite
N = 10 |
Before
Mean ± SD |
After
Mean ± SD |
Ratio
After/Before p value |
Fatty acid amides |
Oleoylethanolamide |
2.2E-05 ± 5.1E-06 |
2.7E-05 ± 8.4E-06 |
1.24 0.009 ** |
Palmitoylethanolamide |
2.1E-05 ± 4.0E-06 |
2.4E-05 ± 5.3E-06 |
1.12 0.017 * |
Stearoylethanolamide |
9.2E-06 ± 2.5E-06 |
1.0E-05 ± 2.6E-06 |
1.12 0.013 * |
Linoleylethanolamide |
8.4E-06 ± 2.2E-06 |
9.2E-06 ± 3.0E-06 |
1.09 0.265 |
Fatty acids and related metabolites |
Oleic acid |
1.2E-03 ± 7.9E-04 |
1.8E-03 ± 1.1E-03 |
1.52 0.009 ** |
Linoleic acid |
1.2E-03 ± 7.9E-04 |
1.8E-03 ± 1.1E-03 |
1.47 0.017 * |
Linolenic acid |
4.6E-05 ± 2.6E-05 |
6.2E-05 ± 3.2E-05 |
1.35 0.044 * |
Palmitoleic acid |
6.0E-05 ± 5.1E-05 |
8.0E-05 ± 5.6E-05 |
1.34 0.054 |
cis-4,7,10,13,16,19-Docosahexaenoic acid |
3.8E-04 ± 2.9E-04 |
5.8E-04 ± 4.1E-04 |
1.51 0.003 ** |
cis-5,8,11,14,17-Eicosapentaenoic acid |
3.2E-05 ± 2.2E-05 |
4.4E-05 ± 3.0E-05 |
1.35 0.004 ** |
cis-8,11,14-Eicosatrienoic acid |
1.1E-05 ± 3.8E-06 |
1.5E-05 ± 6.0E-06 |
1.38 0.002 ** |
cis-11,14-Eicosadienoic acid |
8.9E-06 ± 5.4E-06 |
1.3E-05 ± 8.1E-06 |
1.46 0.007 ** |
cis-11-Eicosenoic acid |
1.5E-05 ± 9.5E-06 |
2.1E-05 ± 1.5E-05 |
1.44 0.014 * |
Arachidonic acid |
1.0E-04 ± 4.4E-05 |
1.4E-04 ± 7.1E-05 |
1.41 0.004 ** |
Ethyl arachidonate |
2.5E-05 ± 2.1E-05 |
3.5E-05 ± 2.8E-05 |
1.39 0.020 * |
Nervonic acid |
2.0E-06 ± 9.5E-07 |
2.6E-06 ± 8.1E-07 |
1.31 0.001 ** |
Myristoleic acid |
2.3E-04 ± 1.4E-04 |
2.1E-04 ± 1.1E-04 |
0.90 0.299 |
Ricinoleic acid |
7.7E-06 ± 5.5E-06 |
1.0E-05 ± 8.0E-06 |
1.31 0.054 |
FA(22:5) |
2.6E-05 ± 1.6E-05 |
3.8E-05 ± 2.6E-05 |
1.46 0.013 * |
FA(22:4) |
1.4E-05 ± 1.3E-05 |
2.1E-05 ± 1.8E-05 |
1.46 0.014 * |
FA(20:3) |
4.1E-06 ± 5.0E-06 |
5.6E-06 ± 7.3E-06 |
1.38 0.084 |
FA(19:1) |
3.3E-06 ± 1.6E-06 |
4.4E-06 ± 2.5E-06 |
1.35 0.030 * |
FA(17:1) |
4.8E-06 ± 3.1E-06 |
6.2E-06 ± 3.7E-06 |
1.30 0.067 |
FA(14:3) |
5.3E-06 ± 2.4E-06 |
5.3E-06 ± 2.6E-06 |
0.99 0.967 |
FA(17:0) |
3.2E-06 ± 1.4E-06 |
4.4E-06 ± 2.0E-06 |
1.37 0.004 ** |
FA(14:0) |
1.0E-05 ± 7.6E-06 |
1.3E-06 ± 9.1E-06 |
1.28 0.032 ** |
Palmitic acid |
2.5E-04 ± 1.3E-04 |
3.4E-04 ± 1.8E-04 |
1.36 0.019 * |
Stearic acid |
1.3E-04 ± 4.9E-05 |
1.8E-04 ± 8.0E-05 |
1.45 0.003 ** |
Heptadecanoic acid |
4.3E-06 ± 1.7E-06 |
6.0E-06 ± 3.0E-06 |
1.41 0.008 ** |
Lauric acid |
1.9E-03 ± 5.5E-04 |
1.6E-03 ± 4.0E-04 |
0.84 0.008 ** |
Decanoic acid |
7.2E-04 ± 4.0E-04 |
5.1E-04 ± 2.3E-04 |
0.71 0.005 ** |
Pelargonic acid |
9.2E-04 ± 1.3E-04 |
6.4E-04 ± 1.4E-04 |
0.70 0.001 ** |
Octanoic acid |
4.6E-04 ± 1.1E-04 |
3.2E-04 ± 5.9E-05 |
0.70 0.001 ** |
Heptanoic acid |
7.2E-04 ± 1.2E-04 |
4.0E-04 ± 7.9E-05 |
0.57 0.001 ** |
Hexanoic acid |
9.0E-04 ± 1.7E-04 |
5.6E-04 ± 1.2E-04 |
0.63 0.002 ** |
Valeric acid |
1.2E-03 ± 3.6E-04 |
6.4E-04 ± 2.0E-04 |
0.54 0.008 ** |
2-Hydroxyvaleric acid |
1.8E-03 ± 1.9E-03 |
1.9E-03 ± 2.2E-03 |
1.05 0.361 |
11-Aminoundecanoic acid |
1.7E-04 ± 5.1E-05 |
1.7E-04 ± 5.4E-05 |
1.00 0.997 |
Acylcarnitines |
|
AC(20:1) |
9.4E-06 ± 4.3E-06 |
9.1E-06 ± 5.1E-06 |
0.97 0.767 |
AC(20:0) |
5.4E-06 ± 2.1E-06 |
4.8E-06 ± 1.2E-06 |
0.89 0.366 |
AC(18:2) |
8.0E-05 ± 3.0E-05 |
5.9E-05 ± 9.2E-06 |
0.74 0.039 * |
AC(18:1) |
1.7E-04 ± 6.9E-05 |
1.5E-04 ± 5.6E-05 |
0.85 0.178 |
AC(18:0) |
4.9E-05 ± 1.9E-05 |
4.3E-05 ± 1.3E-05 |
0.87 0.270 |
AC(16:2) |
7.5E-06 ± 3.6E-06 |
4.3E-06 ± 2.0E-06 |
0.60 0.003 ** |
AC(16:1) |
2.8E-05 ± 1.3E-05 |
1.9E-05 ± 1.1E-05 |
0.69 0.008 ** |
Palmitoylcarnitine |
1.1E-04 ± 4.5E-05 |
8.5E-05 ± 1.5E-05 |
0.76 0.112 |
AC(14:2) |
3.0E-05 ± 1.9E-05 |
1.3E-05 ± 5.3E-06 |
0.44 0.008 ** |
AC(14:0) |
1.8E-05 ± 8.6E-06 |
1.1E-05 ± 4.9E-06 |
0.63 0.019 * |
AC(13:1) |
4.5E-05 ± 4.6E-05 |
3.1E-05 ± 2.9E-05 |
0.69 0.054 |
AC(12:1) |
2.5E-05 ± 2.1E-05 |
9.1E-06 ± 4.8E-06 |
0.36 0.015 * |
AC(12:0) |
3.2E-05 ± 2.3E-05 |
1.1E-05 ± 5.7E-06 |
0.35 0.007 ** |
Carnitine |
2.7E-02 ± 5.5E-03 |
2.7E-02 ± 5.5E-03 |
1.01 0.614 |
O-Acetylcarnitine |
8.4E-03 ± 1.5E-03 |
8.2E-03 ± 1.8E-03 |
0.98 0.744 |
Phospholipids and relative metabolites |
Sphingosine |
2.9E-05 ± 8.5E-06 |
3.7E-05 ± 2.0E-05 |
1.26 0.168 |
Ethanolamine phosphate |
4.9E-04 ± 1.8E-04 |
4.8E-04 ± 2.3E-04 |
0.98 0.848 |
Ethanolamine |
8.5E-04 ± 1.7E-04 |
8.3E-04 ± 1.7E-04 |
0.98 0.586 |
Glycerol |
9.6E-02 ± 3.7E-02 |
9.6E-02 ± 2.3E-02 |
1.01 0.962 |
Nucleic acids and related metabolites |
|
ATP |
6.7E-04 ± 3.0E-04 |
7.2E-04 ± 3.0E-04 |
1.07 0.716 |
ADP |
8.8E-04 ± 3.5E-04 |
1.0E-03 ± 4.2E-04 |
1.17 0.316 |
AMP |
2.2E-04 ± 1.9E-04 |
2.6E-04 ± 1.4E-04 |
1.15 0.618 |
GDP |
1.0E-04 ± 3.9E-05 |
1.2E-04 ± 5.4E-05 |
1.14 0.341 |
UDP |
5.2E-05 ± 2.0E-05 |
6.7E-05 ± 2.8E-05 |
1.30 0.040 * |
IDP |
6.1E-03 ± 4.6E-04 |
6.2E-03 ± 6.2E-04 |
1.01 0.788 |
Uric acid |
2.8E-02 ± 5.9E-03 |
2.9E-02 ± 7.2E-03 |
1.02 0.185 |
Uridine |
8.6E-04 ± 1.7E-04 |
8.0E-04 ± 1.7E-04 |
0.93 0.310 |
8-Hydroxy-2’-deoxyguanine |
5.7E-04 ± 3.6E-04 |
6.6E-04 ± 4.1E-04 |
1.15 0.541 |
Pyrophosphate |
9.8E-04 ± 1.7E-04 |
1.1E-03 ± 1.1E-04 |
1.10 0.096 |
1-Methylnicotinamide |
1.2E-04 ± 5.9E-05 |
1.2E-04 ± 7.0E-05 |
1.02 0.793 |
Tricarboxylic acid cycle intermediates and relative metabolites |
Citric acid |
1.9E-02 ± 2.9E-03 |
2.0E-02 ± 2.9E-03 |
1.07 0.066 |
Isocitric acid |
1.0E-03 ± 2.9E-04 |
1.0E-03 ± 2.8E-04 |
1.03 0.414 |
Lactic acid |
9.9E-02 ± 5.4E-03 |
1.0E-01 ± 3.8E-02 |
1.05 0.716 |
Succinic acid |
5.4E-04 ± 1.4E-04 |
5.3E-04 ± 8.1E-05 |
0.98 0.731 |
Pyruvic acid |
2.8E-03 ± 1.1E-03 |
2.7E-03 ± 9.8E-04 |
0.97 0.738 |
Malic acid |
7.8E-04 ± 2.0E-04 |
7.4E-02 ± 2.1E-04 |
0.95 0.482 |
cis-Aconitic acid |
1.1E-03 ± 2.9E-04 |
1.1E-03 ± 2.9E-04 |
0.99 0.811 |
Urea cycle |
|
Ornithine |
1.1E-02 ± 4.2E-03 |
9.9E-03 ± 3.5E-03 |
0.93 0.234 |
Citrulline |
5.7E-03 ± 1.2E-03 |
5.8E-03 ± 1.3E-03 |
1.01 0.450 |
Urea |
4.3E-01 ± 6.9E-02 |
4.2E-01 ± 8.2E-02 |
0.99 0.717 |
Arg |
2.9E-02 ± 8.7E-03 |
2.8E-02 ± 8.1E-03 |
0.97 0.605 |
Guanidoacetic acid |
8.4E-04 ± 3.6E-04 |
7.8E-04 ± 2.9E-04 |
0.93 0.089 |
Glyceric acid |
1.2E-03 ± 2.5E-04 |
1.1E-03 ± 2.7E-04 |
0.89 0.056 |
Amino acids and related metabolites |
Ala |
8.6E-02 ± 3.1E-02 |
7.7E-02 ± 2.5E-02 |
0.90 0.016 * |
b-Ala |
5.8E-04 ± 2.2E-04 |
5.5E-04 ± 1.6E-04 |
0.94 0.331 |
Asn |
7.4E-03 ± 1.4E-03 |
7.2E-03 ± 1.3E-03 |
0.97 0.307 |
Asp |
1.6E-03 ± 4.5E-04 |
1.5E-03 ± 4.7E-04 |
0.99 0.866 |
Tyr |
1.9E-02 ± 3.8E-03 |
1.8E-02 ± 4.2E-03 |
0.92 0.033 * |
Phe |
3.1E-02 ± 4.1E-03 |
2.9E-02 ± 3.4E-03 |
0.91 0.013 ** |
Trp |
2.1E-02 ± 2.9E-03 |
1.9E-02 ± 2.6E-03 |
0.90 0.002 ** |
Lys |
5.6E-02 ± 1.1E-02 |
5.5E-02 ± 1.1E-02 |
0.98 0.531 |
Ile |
4.4E-02 ± 1.4E-02 |
4.0E-02 ± 9.9E-03 |
0.90 0.090 |
Met |
6.2E-03 ± 1.6E-03 |
5.1E-03 ± 1.4E-03 |
0.82 0.023 * |
Cystine |
2.3E-03 ± 7.2E-04 |
1.7E-03 ± 6.5E-04 |
0.77 0.038 * |
Leu |
8.3E-02 ± 2.1E-02 |
7.6E-02 ± 1.4E-02 |
0.92 0.131 |
His |
2.2E-02 ± 2.8E-03 |
2.2E-02 ± 2.6E-03 |
0.99 0.799 |
Thr |
2.8E-02 ± 9.8E-03 |
2.8E-02 ± 9.9E-03 |
0.98 0.529 |
Val |
1.1E-01 ± 2.1E-02 |
1.1E-01 ± 1.8E-02 |
0.96 0.282 |
Ser |
1.6E-02 ± 5.4E-03 |
1.6E-02 ± 5.2E-03 |
1.02 0.571 |
Glu |
3.4E-02 ± 2.1E-02 |
3.6E-02 ± 2.0E-02 |
1.05 0.343 |
Gln |
1.1E-01 ± 3.2E-02 |
1.1E-01 ± 3.0E-02 |
1.02 0.602 |
Gly |
3.1E-02 ± 8.5E-03 |
3.1E-02 ± 9.1E-03 |
1.00 0.952 |
Pro |
6.8E-02 ± 2.4E-02 |
6.5E-02 ± 2.2E-02 |
0.95 0.115 |
Hydroxyproline |
2.9E-03 ± 1.7E-03 |
2.7E-03 ± 1.7E-03 |
0.95 0.042 * |
5-Oxoproline |
1.8E-03 ± 4.1E-04 |
2.9E-03 ± 3.9E-03 |
1.62 0.390 |
Taurine |
5.6E-03 ± 1.7E-03 |
5.3E-03 ± 1.5E-03 |
0.95 0.524 |
Hypotaurine |
4.2E-04 ± 1.3E-04 |
4.0E-04 ± 9.6E-05 |
0.94 0.527 |
Isethionic acid |
1.8E-04 ± 2.2E-05 |
1.9E-04 ± 2.8E-05 |
1.08 0.040 * |
Kynurenine |
4.3E-04 ± 1.2E-04 |
3.9E-04 ± 8.9E-05 |
0.92 0.109 |
Sarcosine (N-methylglycine) |
4.4E-04 ± 1.2E-04 |
4.0E-04 ± 1.3E-04 |
0.90 0.036 * |
N,N-Dimethylglycine |
1.0E-03 ± 1.7E-04 |
9.8E-04 ± 2.3E-04 |
0.97 0.289 |
N-Acetylglycine |
1.6E-04 ± 3.4E-05 |
1.8E-04 ± 4.6E-05 |
1.14 0.026 * |
N-Acetylalanine |
1.7E-04 ± 1.6E-05 |
1.9E-04 ± 2.7E-05 |
1.14 0.027 * |
N6-Metyllysine |
8.3E-04 ± 4.7E-04 |
8.3E-04 ± 5.3E-04 |
1.00 0.901 |
S-Metylcysteine |
9.2E-04 ± 3.1E-04 |
8.7E-04 ± 2.9E-04 |
0.94 0.117 |
3-Metylhistidine |
2.9E-03 ± 2.2E-03 |
2.6E-03 ± 2.0E-03 |
0.93 0.091 |
2-Aminobutyric acid |
5.9E-03 ± 2.0E-03 |
6.0E-03 ± 2.1E-03 |
1.02 0.518 |
3-Aminobutyric acid |
1.2E-04 ± 3.4E-05 |
1.2E-04 ± 2.7E-05 |
0.99 0.928 |
3-Aminoisobutyric acid |
5.7E-04 ± 3.6E-04 |
5.9E-04 ± 3.7E-04 |
1.03 0.242 |
4-Methyl-2-oxovaleric acid |
1.1E-02 ± 3.8E-03 |
1.1E-02 ± 3.1E-03 |
0.96 0.424 |
5-Methoxyindoleacetic acid |
1.3E-04 ± 4.2E-05 |
1.2E-04 ± 5.2E-05 |
0.94 0.204 |
Indole-3-acetic acid |
1.6E-04 ± 6.5E-05 |
1.5E-04 ± 5.0E-05 |
0.91 0.104 |
2-Oxoisovaleric acid |
1.6E-03 ± 3.8E-04 |
1.6E-03 ± 3.2E-04 |
1.00 0.999 |
2-Aminoadipic acid |
1.8E-04 ± 4.1E-05 |
1.7E-04 ± 3.3E-05 |
0.96 0.304 |
Homovanillic acid |
1.7E-04 ± 7.0E-05 |
1.8E-04 ± 8.0E-05 |
1.06 0.251 |
Pipecolic acid |
8.1E-04 ± 4.0E-04 |
7.7E-04 ± 3.8E-04 |
0.96 0.276 |
Hippuric acid |
5.4E-04 ± 3.7E-04 |
4.6E-04 ± 3.3E-04 |
0.85 0.022 * |
Methionine sulfoxide |
5.4E-04 ± 1.8E-04 |
5.4E-04 ± 1.6E-04 |
0.99 0.893 |
Sufotyrosine |
7.4E-05 ± 2.3E-05 |
6.8E-05 ± 1.8E-05 |
0.92 0.565 |
Creatine |
1.3E-02 ± 7.0E-03 |
1.2E-02 ± 5.6E-03 |
0.93 0.218 |
Creatinine |
2.1E-02 ± 4.5E-03 |
2.1E-02 ± 4.3E-03 |
0.99 0.671 |
Phosphocreatine |
8.7E-05 ± 2.6E-05 |
1.0E-04 ± 2.3E-05 |
1.16 0.047 * |
Phosporylcholine |
23.0E-04 ± 7.7E-05 |
3.0E-04 ± 8.1E-05 |
1.00 0.999 |
Glycerophosphocholine |
3.3E-04 ± 1.2E-04 |
3.0E-04 ± 8.9E-05 |
0.89 0.362 |
Choline |
6.5E-03 ± 1.3E-03 |
6.4E-03 ± 1.3E-03 |
0.99 0.776 |
Betaine |
2.3E-02 ± 4.6E-03 |
2.3E-02 ± 4.8E-03 |
0.99 0.642 |
g-Butyrobetaine |
8.2E-04 ± 1.4E-04 |
7.8E-04 ± 1.5E-04 |
0.95 0.046 * |
2-Hydroxyglutaric acid |
1.5E-04 ± 5.3E-05 |
1.7E-04 ± 4.2E-05 |
1.10 0.365 |
Bile acids |
Deoxycholic acid |
5.9E-05 ± 4.4E-05 |
5.5E-05 ± 4.1E-05 |
0.93 0.413 |
Chenodeoxycholic acid |
4.1E-05 ± 4.9E-05 |
3.6E-05 ± 4.7E-05 |
0.87 0.101 |
Taurodeoxycholic acid |
8.7E-06 ± 9.4E-06 |
5.5E-06 ± 6.2E-06 |
0.63 0.110 |
Taurochenodeoxycholic acid |
1.4E-05 ± 1.1E-05 |
8.3E-06 ± 6.5E-06 |
0.60 0.066 |
Glycochenodeoxycholic acid |
8.8E-05 ± 6.0E-05 |
5.7E-05 ± 3.8E-05 |
0.65 0.046 * |
Glycodeoxycholic acid |
2.9E-05 ± 2.2E-05 |
2.1E-05 ± 1.6E-05 |
0.73 0.120 |
Glycoursodeoxycholic acid |
1.2E-05 ± 1.1E-05 |
9.3E-06 ± 7.4E-06 |
0.78 0.313 |
Steroids and related metabolites |
Cortisol |
8.0E-05 ± 3.3E-05 |
7.3E-05 ± 2.3E-05 |
0.91 0.371 |
Cortisone |
1.9E-05 ± 6.8E-06 |
1.9E-05 ± 5.7E-06 |
1.00 0.963 |
Pregnenolone sulfate |
3.1E-05 ± 1.1E-05 |
2.9E-05 ± 8.8E-06 |
0.94 0.386 |
Cholesterol sulfate |
5.9E-05 ± 1.5E-05 |
5.4E-05 ± 1.5E-05 |
0.93 0.023 * |
Cholesterol |
1.2E-03 ± 2.8E-04 |
1.1E-03 ± 3.3E-04 |
0.87 0.290 |
7-Dehydrocholesterol |
9.5E-06 ± 2.9E-06 |
8.8E-06 ± 2.2E-06 |
0.93 0.578 |
Dehydroisoandrosterone 3-sulfate |
1.0E-03 ± 3.0E-04 |
1.1E-03 ± 2.8E-04 |
1.08 0.004 ** |
Etiocholan-3a-ol-17-one |
7.1E-06 ± 3.7E-06 |
7.9E-06 ± 3.8E-06 |
1.12 0.058 |
Etiocholan-3a-ol-17-one sulfate |
5.0E-04 ± 2.4E-04 |
5.3E-06 ± 2.5E-04 |
1.07 0.034 * |
Other metabolites |
Gluconic acid |
3.4E-04 ± 7.1E-05 |
3.6E-04 ± 6.6E-05 |
1.05 0.348 |
Mucic acid |
1.2E-04 ± 3.8E-05 |
1.2E-04 ± 3.2E-05 |
1.02 0.635 |
Threonic acid |
1.9E-03 ± 1.2E-03 |
2.2E-03 ± 1.3E-03 |
1.15 0.014 * |
Trimethylamine N-oxide |
1.3E-03 ± 5.8E-04 |
1.2E-03 ± 5.5E-04 |
0.91 0.097 |
Indole-3-carboxaldehyde |
1.9E-05 ± 6.1E-06 |
2.0E-05 ± 5.1E-06 |
1.06 0.295 |
3-Indoxysulfuric acid |
5.7E-04 ± 2.9E-04 |
5.8E-04 ± 3.3E-04 |
1.03 0.631 |
a-Tocopherol |
2.6E-04 ± 1.0E-04 |
2.4E-04 ± 8.2E-05 |
0.94 0.405 |
2-Hydroxybutyric acid |
3.2E-03 ± 1.4E-03 |
4.4E-03 ± 2.1E-03 |
1.40 0.002 ** |
3-Hydroxybutyric acid |
4.8E-03 ± 7.2E-03 |
6.4E-03 ± 8.3E-03 |
1.32 0.099 |
* Indicates a significant difference (* p < 0.05, ** p < 0.01, t-test). |
Docking of OEA on the nuclear receptor PPAR-
OEA is a fatty acid amide known to induce lipolysis as a putative endogenous ligand of PPAR-14, 20-21]; therefore we hypothesized that increased plasma OEA levels after EF exposure may be linked to changes in the fatty acid content in plasma. We next examined the binding mode study of OEA in active site of PPAR- using Sybyl-X2.0 software. As shown in Figure 2, OEA formed hydrogen bonds with Ser280, Tyr314, and Phe273. The results indicated that OEA would bind to PPAR-.
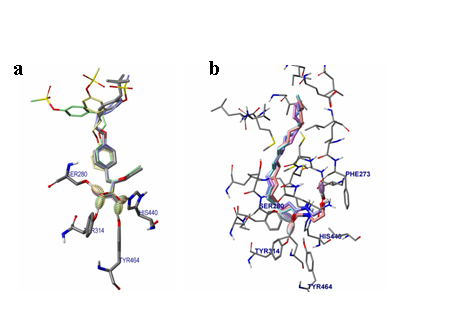
Figure 2. View of the conformation of OEA docked in the PPAR-α active site. (a) Binding mode of AZ242 in PPAR-α. (b) Binding mode of OEA in PPAR-α.
Gene expression analysis of human-derived adipocytes
In order to determine whether the docking of OEA on the nuclear receptor PPAR- reflected a change in the human cellular function, we tested the effect of OEA on gene expression using the Affymetrix GeneChip human genome U133 Plus 2.0 array. The addition of 10 M OEA to human subcutaneous adipocytes significantly affected the expression of 1013 genes (556 upregulated and 457 downregulated). In particular, genes associated with lipid metabolic process exhibited significant changes in response to OEA treatment (Table 2).
Because FAT/CD36, acyl-CoA synthetase long-chain family member 3 (ACSL3), and ACOX1 are PPAR-responsive genes, we next confirmed the effect of OEA (10 M) on the target proteins at the mRNA level by qRT-PCR. qRT-PCR showed increased expression of about 1.65-fold, 1.51-fold, 1.54-fold and 1.88-fold for FAT/CD36, ACSL3, HDLBP, and ACOX1, respectively (Figure 3a-d). We further evaluated whether the PPAR- antagonist GW6471 or the PPAR-/ antagonist GW9662 attenuated the effect of OEA-stimulated ACOX1 expression. OEA (10 M) -stimulated ACOX1 response was almost completely abolished by 10 M GW9662 or 10 M GW6471 (Figure 3e). To determine the possible effects of OEA on specificity against PPAR, we next examined the effect of OEA on the gene expression of PPAR- or PPAR-. OEA (10 M) treatment produced about a 1.6-fold increase when measured by qRT-PCR (Figure 3f). In contrast, PPAR- had no effect (Figure 3g).
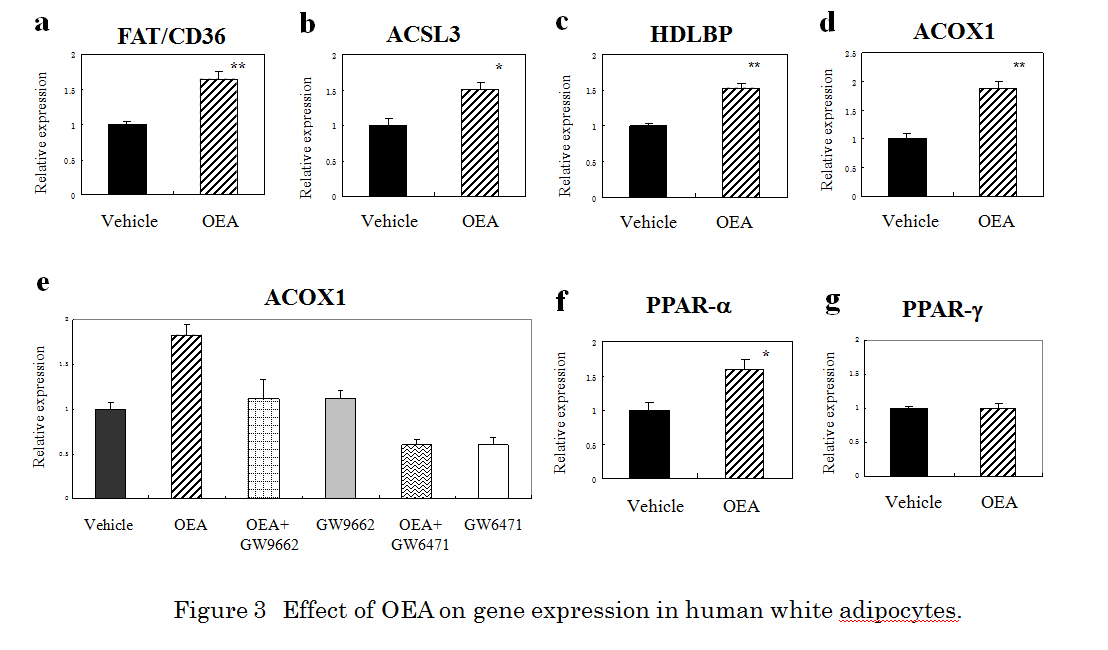
Figure 3. Effect of OEA on gene expression in human white adipocytes. qRT-PCR analysis of FAT/CD36 (a), ACSL3 (b), HDLBP (c), ACOX1 (d), PPARα (f), and PPAR-γ (g) mRNA in human adipocytes treated with 10 µM OEA for 24 h. * Indicates a significant difference (*p < 0.05, **p < 0.01, t-test) between the OEA (10 µM)- and the vehicle (0.1 % DMSO)-treated cells. (e) The effect of GW6471 on OEA-induced activation of ACOX1 expression in human adipocytes. GW9662 (10 µM) or GW6471 (10 µM) was added to cultured cells 30 min prior to and during OEA (10 µM) incubation (24 h). Glyceraldehyde 3-phosphate dehydrogenase (GAPDH) was included as an internal control. Results are presented means ± SEMs (n = 3).
Table 2. Expression of selected gene exhibiting > 1.5-fold or < 0.67-fold changes in human subcutaneous adipocytes after exposure to 10 µM OEA for 24 h
Accession no. |
Gene symbol |
Gene description |
Fold change |
Lipid metabolic process |
Up-regulated gene |
NM_002732 |
PRKACG |
protein kinase, cAMP-dependent, catalytic, gamma |
8.04 |
NM_001243900 |
HDLBP |
high density lipoprotein binding protein |
6.00 |
NM_000949 |
PRLR |
prolactin receptor |
5.43 |
NM_001204051 |
SLC25A27 |
solute carrier family 25, member 27 |
5.21 |
NM_022898 |
BCL11B |
B-cell CLL/lymphoma 11B |
5.09 |
NM_000198 |
HSD3B2 |
hydroxy-delta-5-sterold dehydrogenase, 3 beta- and steroid delta-isomerase |
4.88 |
NM_002649 |
PIK3CG |
phosphoinositide-3-kinase, catalytic, gamma polypeptide |
4.60 |
NM_004457 |
ACSL3 |
acyl-CoA synthetase long-chain family member 3 |
4.29 |
NM_018327 |
SPTLC3 |
serine palmitoyltransferase, long chain base subunit 3 |
3.89 |
NM_002011 |
FGFR4 |
fibroblast growth factor receptor 4 |
3.84 |
NM_001098537 |
PNPLA7 |
patatin-like phospholipase domain containing 7 |
3.82 |
NM_001127178 |
PIGG |
phosphatidylinositol glycan anchor biosynthesis, class G |
3.73 |
NM_030791 |
SGPP1 |
sphingosine-1-phosphate phosphatase 1 |
3.55 |
NM_007253 |
CYP4F8 |
cytochrome P 450, family 4, subfamily F, polypeptide 8 |
3.45 |
NM_024419 |
PGS1 |
phosphatidylglycerophosphate synthase 1 |
3.10 |
NM_203347 |
LCN15 |
lipocalin 15 |
3.04 |
NM_001040442 |
FABP6 |
fatty acid binding protein 6, ileal |
2.79 |
NM_000778 |
CYP4A11 |
cytochrome P 450, family 4, subfamily A, polypeptide 11 |
2.75 |
NM_001185039 |
ACOX1 |
acyl-CoA oxidase 1, palmitoyl |
2.70 |
NM_018667 |
SMPD3 |
sphingomyelin phosphodiesterase 3, neutral membrane |
2.64 |
NM_014602 |
PIK3R4 |
phosphoinositide-3-kinase regulatory subunit 4 |
2.51 |
NM_015879 |
ST8SIA3 |
ST8 alpha-N-acetyl-neuraminide alpha-2,8-sialyltransferase 3 |
2.40 |
NM_024870 |
PREX2
factor 2 |
phosphatidylinositol-3,4,5-triphosphate-dependent Raexchange |
2.16 |
NM_012400 |
PLA2G2D |
phospholipase A2, group IID |
2.16 |
NM_005050 |
ABCD4 |
ATP-binding cassette sub-family D member 4 |
2.08 |
NM_001127458 |
CRLS1 |
cardiolipin synthase 1 |
1.74 |
NM_198531 |
ATP9B |
ATPase, class II, type 9B |
1.70 |
NM_001144772 |
NSMAF |
neutral sphingomyelinase activation associated factor |
1.69 |
NM_001144382 |
PLCL2 |
phospholipase C-like 2 |
1.61 |
NM_000072 |
CD36 |
fatty acid translocase/CD36 |
1.58 |
Down-regulated genes |
NM_001756 |
SERPINA6 |
serpin peptidase inhibitor, clade A, member 6 |
0.14 |
NM_000545 |
HNF1A |
HNF1 homeobox A |
0.15 |
NM_024586 |
OSBPL9 |
oxysterol binding protein-like 9 |
0.16 |
NM_001831 |
CLU |
clusterin |
0.16 |
NM_022060 |
ABHD4 |
abhydrolase domain containing 4 |
0.19 |
NM_032047 |
B3GNT5 |
UDP-GlcNAc:betaGal beta-1,3-N-acetylglucosaminyltransferase 5 |
0.19 |
NM_153343 |
ENPP6 |
ectonucleotide pyrophosphatase/phosphodiesterase 6 |
0.25 |
NM_015974 |
CRYL1 |
crystallin, lamda 1 |
0.25 |
NM_006330 |
LYPLA1 |
lysophospholipase I |
0.28 |
NM_001160147 |
DDHD1 |
DDHD domain containing 1 |
0.39 |
NM_153240 |
NPHP3 |
nephronophthisis 3 (adolescent) |
0.44 |
NM_003080 |
SMPD2 |
sphingomyelin phosphodiesterase 2, neutral membrane |
0.45 |
NM_016466 |
ANKRD23 |
ankyrin repeat domain 23 |
0.54 |
NM_001039667 |
ANGPTL4 |
angiopoietin-like 4 |
0.55 |
NM_016174 |
CERCAM |
cerebral endothelial cell adhesion molecule |
0.56 |
NM_001101667 |
ACOX3 |
acyl-CoA oxidase 3, pristanoyl |
0.58 |
NM_003702 |
PPAP2A |
phosphatidic acid phosphatase type 2A |
0.59 |
NM_001143835 |
NFRKB |
nuclear factor related to kappa B binding protein |
0.62 |
NM_003105 |
SORL1 |
sortilin-related receptor, L (DLR class) A repeats containing |
0.64 |
The results of the present study clearly indicate that plasma fatty acids in healthy human subjects are sensitive to acute EF exposure. Interestingly, 60 % or more of significant increase following EF exposure was fatty acid family in plasma. In contrast, about 30 % of significant decrease following EF exposure was acylcarnitine family in plasma. It is notable that EF exposure did not seem to adversely alter physiological parameters of the healthy volunteers, at least in terms of citric acid or ornithine cycles. Moreover, a stress-responsive hormone cortisol was not affected by EF exposure. Our findings also clarified that EF exposure elicits an increase in plasma OEA, a fatty acid ethanolamide. In contrast, LoVerme et al. reported that cold exposure increased the OEA content in white adipose tissue, but not plasma [22]. Therefore, it is possible that the physiology differs is different between cold exposure and EF exposure. on the other hand, Fu et al. have reported that 24-h food deprivation induced an increase in the OEA levels in the plasma (1.34-fold), liver (1.69-fold), and white adipose tissue (1.24-fold) of rats [23]. The results of the present study showed that EF exposure induced a 1.24-fold increase in human plasma OEA levels. OEA is reportedly an endogenous ligand of the nuclear receptor PPAR-αthat induces lipolysis [14,20,21]. Therefore, the increase in fatty acid levels of healthy human plasma observed in this study was reasonable. At present, it remains unclear whether the increase in plasma OEA was controlled individually or collectively by the liver, intestine, and adipose tissues.
The changes in OEA levels that were observed following EF exposure are complex and can be interpreted in several ways. Voltage-sensing is reportedly coupled to protein phosphatase which is an enzyme responsible for the generation of arachidonoyl ethanolamide (anandamide) from its phosphorylated precursor [22-25]. Thus, the increase in OEA after exposure of EF is conceivable. However, it remains unclear whether similar voltage-sensitive phosphatases might be involved in OEA production. It will be of interest to assess phosphoinositide phosphatase activity coupled to an intrinsic voltage sensor in human tissue in the regulated synthesis of the fatty acid amide OEA in a future study.
In the present study, OEA binding to PPAR-α was stabilized through the formation of hydrogen bouds with Ser280, Tyr314, and Phe273, whereas a previous study reported hydrogen bounding with Ser280 and His440 [26]. This apparent discrepancy may have resulted from differences in model systems; e.g., 1i7g (crystal structure of the ligand binding domain from human PPAR-α in complex with the agonist AZ242) versus 1k7l (crystal structure of the human PPAR-αligand binding domain bound with GW409544 and a co-activator peptide) [26].
Another goal of the present study was to gain insights into the genetic components affected by OEA through a large-scale analysis of gene expression analysis. In human white subcutenous adipocytes, FAT/CD36, ACSL3, HDLBP, ACOX1, and PPAR-α were upregulated in response to OEA. In contrast to PPAR-α, PPAR-γ had no effect. ACOX1, CYP4A11, ACSL3, and FAT/CD36 are reportedly involved in lipid metabolism genes induced by a PPAR-α agonist [27]. Guzman et al. reported an increased gene expression of FAT/CD36, fatty acid-binding protein, uncoupling protein-2, and PPAR-αin the adipose tissue of rats after OEA administration [22]. In our study, the response of OEA on ACOX1 mRNA expression was inhibited by the PPAR-α antagonist GW6471. Thus, the stimulation of human adipocytes with OEA might involve, at least in part, the PPAR-α signaling cascade.
An experimental pretest-posttest design study by Sirikulchayanonta et al. found that EF exposure (30 min/day for 30 days) reduced low density lipoprotein cholesterol (LDL-C) levels and increased high density lipoprotein cholesterol (HDL-C) levels in the serum of 41 middle-aged patients [6]. It is reasonable to speculate that repetitive stimulation with OEA might alleviate abnormal levels of LDL-C and HDL-C through the PPAR-α nuclear receptor-mediated pathway in humans. Yanamoto et al. recently reported that EF treatment for 12 months reduced the body weight of human volunteers [28]. Although repetitive EF treatment was not performed in the present study, EF therapy may induce weight loss in humans, at least in part, through the activation of the PPAR-α signaling pathway by OEA. Therefore, further studies are warranted to elucidate whether the EF-induced OEA-dependent signaling pathway might affect potential therapeutic intervention.
OEA might have additional functions as an agonist or activator against the transient receptor potential vanilloid type-1 (TRPV1), GPR119, or GPR55 [29-34]. However, further studies are needed to elucidate whether the OEA-dependent signaling pathway induced by EF exposure might affect the alleviation of circadian rhythm sleep disorders and inflammatory pain [35,36].
In conclusions, acute EF exposure induced notable effects on plasma OEA levels in healthy subjects. In human subcutaneous adipocytes, ACOX1 gene expression induced by OEA was sensitive to the PPAR-α antagonist GW6471. Our findings not only provide a clear example to understand the molecular mechanisms of health merit induced by EF therapy, but might also be important to the development of alternative medicine therapies and electroceuticals.
YN-Y, HH and AH are employed by Hakuju Institute for Health Science Co., Ltd., TF is employed by Human Metabolome Technologies Inc., TY is employed by Acel Inc., and AM is employed by World Fusion Co., Ltd. All other authors have no competing interests.
YN-Y designed and supervised the research, and wrote the manuscript. YN-Y, HH, and AH performed the EF exposure and biochemical experiments. TF performed the metabolome analysis. TY performed the GeneChip experiment. AM performed the molecular modeling. All authors read and approved the final version of the manuscript.
- 1. Kimura R (1988) The effect of high-intensity electric-field exposure on lipid peroxidation in blood and organs in rats. Electromagnetic Biol Med 7: 77-88.
- 2. Harakawa S, Takahashi I, Doge F, Martin DE (2004) Effect of a 50 Hz electric field on plasma ACTH, glucose, lactate, and pyruvate levels in stressed rats. Bioelectromagnetics 25: 346-351. [Crossref]
- 3. Hori T, Harakawa S, Herbas SM, Ueta YY, Inoue N, et al. (2012) Effect of 50 Hz electric field in diacylglycerol acyltransferase mRNA expression level and plasma concentration of triacylglycerol, free fatty acid, phospholipid and total cholesterol. Lipids in Health and Disease 31: 68. [Crossref]
- 4. Hara H (1961) On the effect of AC. electrostatic high voltage potential load upon the blood-electrolytes (in Japanese). Niigata Medical J 75: 265 -273.
- 5. Ito F, Furuya K (1981) The effect of high voltage alternating current upon a human body the change of blood pressure, endocrine system and serum lipids (in Japanese). J Jpn Sci Balneol Climatol Phys Med 45: 6 -17.
- 6. Sirikulchayanonta C et al. (2001) The effect of Healthtron on serum lipid levels among the middle-aged: Preliminary report. J Public Health (Bangkok) 31: 63-70.
- 7. Ito F (2000) The role of electric field therapeutic device (Healthtron) in the therapy of acute low back pain (in Japanese). J Jpn Sci Balneol Climatol Phys Med 63: 127 -137.
- 8. Shinba T et al. (2012) A pilot study on electric field therapy for chronic pain with no obvious underlying diseases (in Japanese). Soc Integrative Med Jpn 5: 68-72.
- 9. Naito Y, Yamaguchi S, Mori Y, Nakajima K, Hashimoto S, et al. (2013) A randomized, double-blind, sham-controlled study of static electric field therapy by high voltage alternating current for active rheumatoid arthritis. J Clin Biochem Nutr 53: 63-67. [Crossref]
- 10. Astarita G, Piomelli D (2009) Lipidomic analysis of endocannabinoid metabolism in biological samples. J Chromatogr B Analyt Technol Biomed Life Sci 877: 2755-2767. [Crossref]
- 11. Sugimoto M, Wong DT, Hirayama A, Soga T, Tomita M (2010) Capillary electrophoresis mass spectrometry-based saliva metabolomic identified oral, breast and pancreatic cancer-specific profiles. Metabolomics 6: 78-95. [Crossref]
- 12. Psychogios N, Hau DD, Peng J, Guo AC, Mandal R, et al. (2011) The human serum metabolome. PLoS One 6: e16957. [Crossref]
- 13. Patti GJ, Yanes O, Shriver LP, Courade JP, Tautenhahn R, et al. (2012) Metabolomics implicates altered sphingolipids in chronic pain of neuropathic origin. Nat Chem Biol 8: 232-234.[Crossref]
- 14. Fu J, Gaetani S, Oveisi F, Lo Verme J, Serrano A, et al. (2003) Oleoylethanolamide regulates feeding and body weight through activation of the nuclear PPAR-α. Nature 425: 90-93. [Crossref]
- 15. Isaka K. et al. (1998) Dosimetry and exposure experiments for extremely low frequency high-tension electric field therapy. EMC’98 Rome International Symposium on Electromagnetic Compatibility D: 204-207.
- 16. Soga T, Heiger DN (2000) Amino acid analysis by capillary electrophoresis electrospray ionization mass spectrometry. Anal Chem 72: 1236-1241. [Crossref]
- 17. Soga T, Ohashi Y, Ueno Y, Naraoka H, Tomita M, et al. (2003) Quantitative metabolome analysis using capillary electrophoresis mass spectrometry. J Proteome Res 2: 488-494. [Crossref]
- 18. Cronet P, Petersen JF, Folmer R, Blomberg N, Sjöblom K, et al. (2001) Structure of the PPARalpha and -gamma ligand binding domain in complex with AZ 242; ligand selectivity and agonist activation in the PPAR family. Structure 9: 699-706. [Crossref]
- 19. Nakagawa-Yagi Y, Sato Y, Matsumoto E, Nakatsuka S, Sakaki T, et al. (2012) Pharmacological modulation of histone demethylase activity by a small molecule isolated from subcritical water extracts of Sasa senanensis leaves prolongs the lifespan of Drosophila melanogaster. BMC Complement Altern Med 12: 101. [Crossref]
- 20. Guzmán M, Lo Verme J, Fu J, Oveisi F, Blázquez C, et al. (2004) Oleoylethanolamide stimulates lipolysis by activating the nuclear receptor peroxisome proliferator-activated receptor alpha (PPAR-alpha). J Biol Chem 279: 27849-27854. [Crossref]
- 21. Fu J, Oveisi F, Gaetani S, Lin E, Piomelli D (2005) Oleoylethanolamide, an endogenous PPAR-alpha agonist, lowers body weight and hyperlipidemia in obese rats. Neuropharmacology 48: 1147-1153. [Crossref]
- 22. LoVerme J, Guzmán M, Gaetani S, Piomelli D (2006) Cold exposure stimulates synthesis of the bioactive lipid oleoylethanolamide in rat adipose tissue. J Biol Chem 281: 22815-22818. [Crossref]
- 23. Fu J, Astarita G, Gaetani S, Kim J, Cravatt BF, et al. (2007) Food intake regulates oleoylethanolamide formation and degradation in the proximal small intestine. J Biol Chem 282: 1518-1528. [Crossref]
- 24. Murata Y, Iwasaki H, Sasaki M, Inaba K, Okamura Y (2005) Phosphoinositide phosphatase activity coupled to an intrinsic voltage sensor. Nature 435: 1239-1243. [Crossref]
- 25. Liu J, Wang L, Harvey-White J, Osei-Hyiaman D, Razdan R, et al. (2006) A biosynthetic pathway for anandamide. Proc Natl Acad Sci U S A 103: 13345-13350. [Crossref]
- 26. Decara JM, Romero-Cuevas M, Rivera P, Macias-González M, Vida M, et al. (2012) Elaidyl-sulfamide, an oleoylethanolamide-modelled PPAR-α agonist, reduces body weight gain and plasma cholesterol in rats. Dis Model Mech 5: 660-670.[Crossref]
- 27. Kane CD, Stevens KA, Fischer JE, Haghpassand M, Royer LJ, et al. (2009) Molecular characterization of novel and selective peroxisome proliferator-activated receptor-α agonists with robust hypolipidemic activity in vivo. Mol Pharmacol 75: 296-306. [Crossref]
- 28. Yanamoto H, Nakajo Y, Kataoka H, Iihara K (2013) High voltage electric potentials to enhance brain-derived neurotrophic factor levels in the brain. Front Neurol Neurosci 32: 129-138. [Crossref]
- 29. Ahern GP (2003) Activation of TRPV1 by the satiety factor oleoylethanolamide. J Biol Chem 278: 30429-30434. [Crossref]
- 30. AlSuleimani YM, Hiley CR (2013) Mechanisms of vasorelaxation induced by oleoylethanolamide in the rat small mesenteric artery. Eur J Pharmacol 702: 1-11. [Crossref]
- 31. Overton HA, Babbs AJ, Doel SM, Fyfe MC, Gardner LS, et al. (2006) Deorphanization of a G protein-coupled receptor for oleoylethanolamide and its use in the discovery of small-molecule hypophagic agents. Cell Metabolism 3: 167-175. [Crossref]
- 32. Suardíaz M, Estivill-Torrús G, Goicoechea C, Bilbao A, Rodríguez de Fonseca F (2007) Analgesic properties of oleoylethanolamide (OEA) in visceral and inflammatory pain. Pain 133: 99-110. [Crossref]
- 32. Suardíaz M, Estivill-Torrús G, Goicoechea C, Bilbao A, Rodríguez de Fonseca F (2007) Analgesic properties of oleoylethanolamide (OEA) in visceral and inflammatory pain. Pain 133: 99-110. [Crossref]
- 33. Lauffer LM, Iakoubov R, Brubaker PL (2009) GPR119 is essential for oleoylethanolamide-induced glucagon-like peptide-1 secretion from the intestinal enteroendocrine L-cell. Diabetes 58: 1058-1066. [Crossref]
- 34. Ryberg E, Larsson N, Sjögren S, Hjorth S, Hermansson NO, et al. (2007) The orphan receptor GPR55 is a novel cannabinoid receptor. Br J Pharmacol 152, 1092-1101. [Crossref]
- 35. Shirai H, Oishi K, Kudo T, Shibata S, Ishida N (2007) PPARalpha is a potential therapeutic target of drugs to treat circadian rhythm sleep disorders. Biochem Biophys Res Commun 357: 679-682. [Crossref]
- 36. Suardíaz M, Estivill-Torrús G, Goicoechea C, Bilbao A, Rodríguez de Fonseca F (2007) Analgesic properties of oleoylethanolamide (OEA) in visceral and inflammatory pain. Pain 133: 99-110. [Crossref]