We have performed a comparison of computer-generated random sequences with tRNAs nucleotide sequences present in Bacteria represented as random walks. Nucleotide sequence data of tRNA genes were obtained from the Institute for Genomic Research (TIGR) and the GeneBank library. Random sequence data (white noise) were obtained from the algorithm by Press and Teukolsky. Random walks of nucleotide sequences were obtained by letting the orbit walk a unit step in one of four directions (down, left, right, and up), depending upon the next base (A,C,G, and T) in the sequence, and the distances from the origin calculated. The Visual Basic routines here applied to perform the analysis are presented. Relative Lempel-Ziv complexity. Entropy (sum of the positive Lyapunov indexes) and Hurst indexes of nucleotide sequences and of computer-generated random data were evaluated over the distances of their random walk. Our data show that the values of nonlinear parameters obtained from the bacteria are lower than the values of randomly generated sequences (p<0.01, p<0.05, p<0.01), meaning that the tRNA sequence is more ordered than a pure destructured random data and it owns a “memory”. The observed deviation from pure randomness should be arisen from some constraints like the secondary structure of this biologic macromolecule and/or from the peculiar origin of this macromolecule by repeated subunits. These data indicate that evolution earlier chose nonrandom “alphabets”: order together randomness were present at the dawn of life. Our method, here presented and described, provides an efficient tool to assess the amount of order/disorder in the primary structure of nucleic acid sequences.
random walks, tRNA, nonlinear analysis, genomic sequences
Billions years ago, according to the exon theory of genes [1] small RNAs translated into peptides of 15-20 amino acids: minigenes of pre-tRNAs codifying RNA hairpin structures. The dimerization of two equal RNA hairpin structures may have lead to the formation of the cruciform structure of the tRNA molecule: tRNA reflects the primordial genes of that era. Prokaryotic cells lived during the earliest time (3.5 billion years ago): these microorganisms retain ancestral signatures in their tRNAs [2,3]. In order to test the hypothesis that the nucleotide sequences of the primitive informational polymers (tRNAs) might not be chosen randomly, we introduce the comparison of computer-generated random sequences with tRNAs nucleotide sequences present in the bacterial genomes based on the description of nucleic acid sequences as random walks and their analysis by nonlinear approaches over the distances from the origin.
Nucleotide sequences
Nucleotide sequences of bacterial nonintronic tRNAs were obtained from the GenBank library [http://www.ncbi.nlm.nih.gov/genbank]. Fifty sequences of five tRNAs (tRNA-gly, tRNA-val, tRNA-glu, tRNA-arg, tRNA-ala), the oldest tRNA known, collected from ten Bacteria (Acaryochloris m, Bacillus c, Burkholderia m, Chromohalobacter s, Clostridium b, Deinococcus r, Ehrlichia r, Escherichia c, Magnetococcus_MC-1, Staphylococcus a) were analyzed.
Random data
Random data (white noise) were obtained from the algorithm by Press and Teukolsky [4] and their orbit walks were obtained generating an uniformly and randomly distributed data points over the unit interval (0 to 1). Based on the graphical approaches by Hamori & Ruskin and Mizrahi & Ninio [5,6], we have analyzed nucleotide sequences of nonintronic tRNAs and of computer-generated random data describing them as random walks [7] by means of softwares developed in Visual Basic language by the first Author of the paper (Figures 1 and 2).
Random walks
Random walks of nucleotide sequences were obtained by letting the orbit walk a unit step in one of four directions (down, left, right, and up), depending upon the next base (A,C,G, and T) in the sequence, and the distances from the origin calculated (Figure 1).
Transforming Nucleotide Sequences in Random Walks
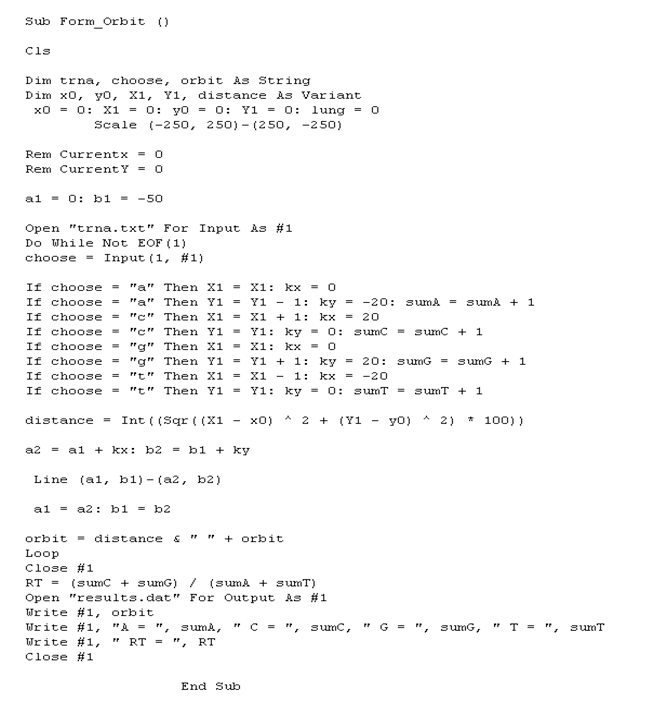
Figure 1. Visual Basic subroutine: tRNA random walk (“orbit” that collect distances from the origin for each base). Base ratio, RT, of nucleotide sequence data was also calculated (trna.txt)
To obtain the random walks of random data, the sequence was divided in 4 intervals to which A,C,G,T letters were attributed (Figure 2) and distances from the origin over the random walk obtained as above (Figure 1). Fifty random sequences (length, n = 80) were evaluated.
Transforming Random Data in Random Nucleotide Sequences
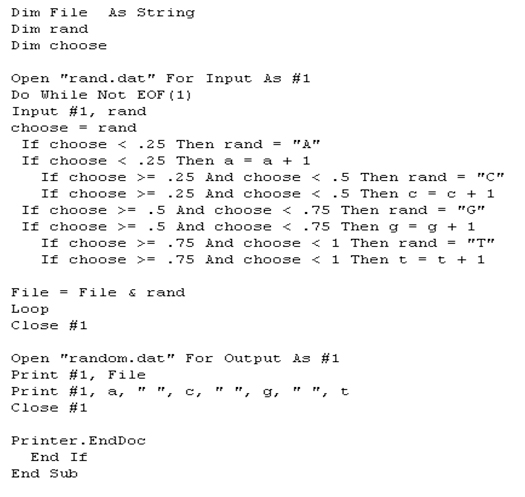
Figure 2. Visual Basic subroutine: a string of random data is transformed in a random nucleotide sequences.
Nonlinear parameters
Relative LZ complexity and Entropy (sum of the positive Lyapunov exponent), have been calculated (Chaos Data Analyzer Pro v. 2.0 [8]) from the distances calculated over the random walks.
Relative LZ complexity, LZ: Relative LZ complexity is a measure of the algorithmic complexity of a time series. According to the Kaspar and Schuster algorithm [9], each data point is converted to a single binary digit according to whether the value is less than, or greater than, the median value of a set of data points.
White noise (a pure random signal, common in physical systems, that exhibits equal power across all the component frequencies of the signal), has an LZ value that is close to 1.0. Pink noise (flicker noise or 1/f noise), exhibits decreasing power as frequency increases, and is associated with a relatively low LZ value; it is common in biological systems (e.g. heart rate). A sine function with 10% superimposed Gaussian white noise yields an LZ value that is close to zero. The algorithm for calculating LZ, applied in the present paper, converts it to a single binary digit which indicates whether the value was less than, or greater than, the median value of the set of such data points.
Entropy, K: The entropy index chosen here [10] is a measure of the disorder in a data set and was calculated as the sum of the positive Lyapunov exponents.
Randomness is indicated by numerically high values of entropy. Ordered series like the sine function exhibit values that are close to 0.
Hurst exponent, H: The Hurst exponent is the slope of the root-mean-square displacement of each data point versus time. The H value for white noise is equal to 0. If H ≠ 0.5, then correlation exists, the noise is “colored” and the process exhibits a “memory”: if the exponent is greater than 0.5, persistence occurs (past trends will statistically persist in the future, see sine function), and, vice versa, if H is less than 0.5, anti-persistence occurs (past trends tend to reverse in the future, e.g., pink noise and biological signals such as heart rate). For Brownian motion, a random process in which, on average, each point moves away from its initial condition by an amount that is proportional to the square root of time, the Hurst exponent exhibits a value which is close to 0.5 (no memory) [11].
Mann-Whitney U test was used to ascertain the difference between the groups.
Two-dimensional random walks of bacterial tRNAs appear less “diffused” than the ones of computer-generated random data (Figure 3). Relative Lempel-Ziv, Entropy and Hurst indexes calculated over the distances of random walks in bacterial tRNAs are statistically lower than the ones of computer-generated random data (p<0.01, p<0.05). Table 1 summarize the results.
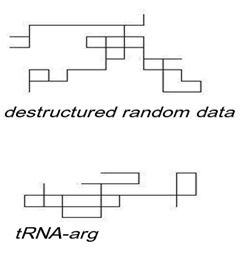
Figure 3. Random Walks of Computer-Generated Random Data and of tRNA
Graphical representations of computer-generated random data (top) and of a tRNA (bottom) as random walks. The sequence begins at the origin in the lower right corner of the graph. tRNA random walk appears less “dispersed” than computer-generated random sequences.
Table 1. Nonlinear analysis of the distances over random walks: tRNAs of Bacteria vs. computer-generated random data (mean values (SD))
|
random data
(white noise) |
bacterial tRNAs |
LZ |
0.74 (0.04) |
0.49 (0.03) **1 |
Entropy |
0.44 (0.1) |
0.33 (0.03) *1 |
Hurst |
0.49 (0.02) |
0.35 (0.02) **1 |
Relative Lempel-Ziv, Entropy and Hurst indexes calculated over the orbit walk (distances) of bacterial tRNAs present significant lower values compared to the ones of random sequence data (**1, p<0.01; *1, p<0.05), meaning a more ordered structure in the nucleic acid sequences than in destructured random data. Moreover, the tRNA sequence owns a “memory” (H ≠0.5)
A number of studies have been devoted to examining the structure of nucleic acids sequences subjected to a variety of mathematical transforms, in order to uncover pattern irregularities in the DNA, that often result from constraints and are therefore frequently associated with function [12-19], also using graphical approaches [5,6]. By our approach, ancient informational polymers, old bacterial tRNAs [20], present significant lower values of LZ complexity, Entropy and Hurst indexes than random sequence data (white noise). These data reveal a significant shift from destructured randomness (white noise), i.e. a more ordered structure than a pure random sequence, also confirming our previous results performed with different nonlinear indexes [21].
The observed deviation from pure randomness may be arisen from some constraints like the secondary structure of this biologic macromolecule and/or from the peculiar origin of this macromolecule by repeated subunits [1].
Gayle and Freeland [22] showed that the 20 amino acids present in the LUCA were not chosen randomly and O. Weiss et al. [23] showed a significant small reduction of the Shannon entropy (-1%) in protein sequences compared to random polypeptides. Together with our results, these data seems indicate that evolution earlier chose nonrandom “alphabets”: order together randomness were present at the dawn of life.
It has been shown that tRNAs sequences are more ordered than destructured random ones (white noise). Lempel-Ziv and Entropy evaluations of nucleic acids sequences described as random walks provides an efficient tool to assess the amount of order/disorder in the primary structure of nucleic acid sequences.
- Di Giulio M (1998) Reflections on th2021 Copyright OAT. All rights reservhesis. J Theor Biol 191: 191-196. [Crossref]
- Eigen M, Lindemann BF, Tietze M, Winkler-Oswatitsch R, Dress A, et al. (1989) How old is the genetic code? Statistical geometry of tRNA provides an answer. Science 244: 673-679. [Crossref]
- Ciccarelli FD, Doerks T, von Mering C, Creevey CJ, Snel B, et al. (2006) Toward automatic reconstruction of a highly resolved tree of life. Science 311: 1283-1287. [Crossref]
- WH Press, S.A (1992) Teukolsky, Portable Random Number Generators. Computers in Physics 6: 522-524.
- Hamori E, Ruskin J (1983) H curves, a novel method of representation of nucleotide series especially suited for long DNA sequences. J Biol Chem 258: 1318-1327. [Crossref]
- Mizraji E, Ninio J (1985) Graphical coding of nucleic acid sequences. Biochimie 67: 445-448. [Crossref]
- W Feller, An introduction to Probability Theory and its Applications (Vol.1, chapter 3), 3rd edition, Wiley Series in Probability and Mathematical Statistics, Wiley, 1968.
- Sprott JC, Rowlands G (1995) Chaos data Analyzer, Physics Academic Software.
- Kaspar F, Schuster HG (1987) Easily calculable measure for the complexity of spatiotemporal patterns. Phys Rev A 36: 842-848. [Crossref]
- Grassberger P, Procaccia I (1983) Estimation of the Kolmogorov entropy from a chaotic signal. Phys Rev A 28: 2591-2593.
- Feder J. Fractals. Plenum, New York and London, 1988.
- Arneodo A, Bacry E, Graves PV, Muzy JF (1995) Characterizing long-range correlations in DNA sequences from wavelet analysis. Phys Rev Lett 74: 3293-3296. [Crossref]
- Claverie JM (1997) Computational methods for the identification of genes in vertebrate genomic sequences. Hum Mol Genet 6: 1735-1744. [Crossref]
- Anastassiou D (2001) Genomic signal processing. IEEE Signal Proc 18: 8–20.
- Berger JA, Mitra SK, Carli M, Neri A (2002) New approaches to genome sequence analysis based on digital signal processing. IEEE Workshop on GENSIPS. 1-4.
- Berger JA, Mitra SK, Carli M, Neri A (2004) Visualization and analysis of DNA sequences using DNA walks. J Franklin Inst 341: 37–53.
- Haimovich AD, Byrne B, Ramaswamy R, Welsh WJ (2006) Wavelet analysis of DNA walks. J Comput Biol 13: 1289-1298. [Crossref]
- Fasold M, Langenberger D, Binder H, Stadler PF, Hoffmann S (2011) DARIO: a ncRNA detection and analysis tool for next-generation sequencing experiments. Nucleic Acids Res 39: W112-117. [Crossref]
- Videm P, Rose D, Costa F, Backofen R (2014) BlockClust: efficient clustering and classification of non-coding RNAs from short read RNA-seq profiles. Bioinformatics 30: i274-282. [Crossref]
- Rodin AS, Szathmáry E, Rodin SN (2011) On origin of genetic code and tRNA before translation. Biol Direct 6: 14. [Crossref]
- Bianciardi G, Borruso L (2015) Nonlinear Analysis of tRNAs Nucleotide Sequences by Random Walks: Randomness and Order in the Primitive Informational Polymers. J Mol Evol 80. [Crossref]
- Philip GK, Freeland SJ (2011) Did evolution select a nonrandom "alphabet" of amino acids? Astrobiology 11: 235-240. [Crossref]
- Weiss O, Jiménez-Montaño MA, Herzel H (2000) Information content of protein sequences. J Theor Biol 206: 379-386. [Crossref]