Abstract
Purpose
The aim of this project was to explore a novel description of the spatial distribution of the macular pigment optical density (MPOD) spatial profile using customized heterochromatic flicker photometry (cHFP) and assess the variability within a young, healthy subject sample.
Methods
A novel device capable of measuring MPOD across the central 16º of retina along 4 principle radii using cHFP at eccentricities of 0º, 2º, 4º, 6º and 8º was built. MPOD was measured at each retinal locus for a 33 subject sample. Individual and mean values at each retinal locus were fit to both Gaussian and Lorentzian functions. Area under the curve (AUC) and kurtosis values were then calculated for each resulting function.
Results
The cHFP identified reliable MPOD spatial distribution maps demonstrating a 1st order exponential decay curve as a function of increasing eccentricity along each radii out to 8º. Significant correlations were found between all four radii at each respective eccentricity possible supporting the use of a single radius in the determination of MPOD spatial distribution. Mean MPOD spatial distribution for the study sample was best-fit by a Lorentzian function. Correlations between MPOD spatial distribution described by kurtosis values and integrated area under the curve across the central 16º of retina were non-significant.
Conclusions
MPOD spatial distribution mapping using cHFP across the central 16o is most accurately described by a Lorentzian function supporting previous. A single measurement of MPOD may be insufficient and accurate evaluation of the spatial distribution may be possible using a single meridian. Kurtosis as a description of MPOD spatial distribution is a novel method and may provide an alternate method to predict visual performance measures.
Key words
macular pigment optical density, spatial distribution, area under the curve, kurtosis
Introduction
Previous studies of macular pigment (MP) spatial distribution have utilized a number of descriptions including exponential decay functions [1], bimodal exponential functions [2], Gaussian distributions [3] and Lorentzian functions [4]. Four discrete MP distributions have been described by Trieschmanet al.[5] while Bernstein et al.[6] categorized five distinct MP distribution subgroups.
Measurement of MP distribution has been performed using a number of both objective and subjective techniques. Objective techniques have included 2-wavelength fundus reflectometry [7,8] , 2-wavelength autofluorescence [9,10] and Raman resonance spectroscopy [11,12]. Subjective techniques of MP spatial distribution have included spectral sensitivity differences [13], dichroism-based difference measurements [14], heterochromatic flicker photometry [15], color matching [16], and minimum motion photometry [17].
Past research has identified the constituents of human macular pigment (MP) as lutein (L), zeaxanthin (Z), and a lutein-metabolite, meso-zeaxanthin (MZ) [18]. Within the retina, MP is primarily a membrane-bound compound found primarily within the photoreceptor axons (Henle fiber layer in macular region) and the inner plexiform layerand, to a lesser extent, at the level of the retinal pigmented epithelium (RPE) [19] and photoreceptor outer segments [20,21]. Robson et al.[17] reported that central measures of MPOD show a weak association with MPOD measured across the entire macula. Trieschmann et al. found that MPOD spatial distribution varies substantially among individuals [22]. Wenzel et al.[23] concluded that integrated measures of MPOD are potentially more useful than a single, central measure. Certain spatial distributions may show significantly different foveal versus parafoveal measurements and quantification of foveal MPOD levels in isolation may poorly reflect total levels of MP within the central retina. This underscores the importance of determining the complete spatial distribution profile of MPOD
Macular pigment optical density (MPOD) peaks at the fovea and falls to negligible levels outside 7ºof foveal eccentricity[24].L is found in greater levels within the peripheral retina as the ratio of L:Z changes from approximately 1:2.4 at the fovea to 1.8:1 in the parafovea to 2.7:1 in the peripheral retina [24]. The inversion of the L:Z ratio with eccentricity parallels the rod:cone ratio demonstrated by Osterberg [25]and Curcioet al.[26] suggestive of a possible underlying process which promotes structure-specific accumulation. Bone et al. suggested that MP spatial distribution is highly correlated with cone photoreceptor distribution possibly indicating a role in photoreceptor function [27]. Nolan et al. [28] proposed that foveal anatomical structure directly influences L and Z distribution. Their results found that foveal levels of MP integrated under the spatial distribution curve shared a significant relationship with foveal width measured as foveal crest to foveal crest. Westrup et al. hypothesized that the density differences of photoreceptor axons at the foveal center versus the parafovea underlies the spatial distribution pattern of MP [29]. Their findings support that the foveal peak of MP is due to the Müller glial cells and the spatial distribution decline of MP is a result of the higher density of photoreceptor axons within the Henle fiber layer creating an integration of two structures incorporating L and Z: Müller glial cells in the foveal center and the Henle fiber layer in the parafovea producing a monotonous, exponential decline with eccentricity. Gasset al.[30] postulated that a layer of Müller glial cells exists between the internal limiting membrane and the Henle fiber layer specifically at the base of the foveal depression. Work performed by Reichenbach et al. identified a relationship between Müller glial functions and MP deposition and transport within the central macula [31].
Currently, clinically MPOD measurements involve a single central value. The measurement of an isolated, central value may be an incomplete description of the high degree of variability in MPOD spatial distribution seen among the population. The results shown here identify a novel description of MPOD spatial distribution that may be used to predict visual performance and response to dietary supplementation.
Methods
The current study included a total of 33 subjects with a mean age of 24.2 years (s = 2.7). Subjects performed all testing over a 4 week period. Study inclusion criteria required no evidence of ocular pathology and best corrected visual acuity of 20/25 in the right eye and age less than 34 in order to avoid any presbyopic effects. All subjects were current optometry students familiar with the devices and techniques presented during testing. All procedures were approved by the UMSL Institutional Review Board.
This study utilized a novel device based on the Wooten et al. heterochromatic flicker photometer (HFP) [32]. However, our device incorporated customized heterochromatic flicker photometry (cHFP) using each subject’s individual foveal CFF to model the spatial distribution of MP across the central 16ºof the retina. The device was designed to create a spatial map of MPOD along eight meridians (0º, 90º, 180º, 270º) at 0º, 2º, 4º, 6º, and 8º eccentricities. This radial pattern was used to generate a spatial profile of an individual subject’s MPOD. A full review of the cHFP device and methods can be found in a previous paper [33].
MPOD spatial distribution measurements were fit to a 1st-order exponential decay curve and variability in the data was described by the r2 value. MPOD mean values for each retinal locus (0º, 2º, 4º and 6º) were fit to a Gaussian and Lorentzian distribution using OriginPro9 software (Northampton, MA). For the resulting two distributions, MPOD values were calculated as area under the curve integrated across the central16º.Individual Gaussian and Lorentzian distribution functions were fit for each of the 33 subjects.
Results
The cHFP device identified reliable MPOD spatial distribution maps and showed a 1st order exponential decay function with eccentricity across the 33 subject study sample. Standard error of the mean measured for 0º eccentricity was less than 0.01 log unit, 2º eccentricity was 0.01, 4º eccentricity was 0.01 and 6º eccentricity was 0.02 log unit. Correlations of MPOD at each eccentricity were performed among the superior, inferior, temporal, and nasal locations. Correlation values among the four measured meridians at 2º, 4º and 6ºeccentricity were significant providing support of a high level of symmetry among measured meridians. For details of the correlation analysis and results, see Putnam et al.[33]The high correlation values among the four measured meridians at each eccentricity allowed resulting MPOD values at each retinal loci to be calculated as a mean of the superior inferior, nasal and temporal measurements.
MPOD mean values for each retinal locus were fit to an exponential decay function resulting in a covariance value of 0.912. The exponential functions were fit using 5 points including the 8º eccentricity. The 8ºeccentricity point is assumed to be outside the region of MP deposition [15,34]and is used in the calculation of MPOD as the parafoveal reference point. Due to this, the 8ºeccentricity is given a near negligible value for each meridian of every subject artificially pinning the exponential function to the 8º point on the curve. To evaluate the influence of this assumption, the exponential decay function was also plotted using only the measured retinal points of MPOD: 0º, 2º, 4º and 6º. The resulting exponential function demonstrated a similar covariance value of 0.853. The resulting functions reproduced from the original article are shown below [33](Figure 1). Gaussian and Lorentzian curves were fit for each subject resulting in substantial variability across the 33 subject sample(Figure 2). The kurtosis value and AUC for each subject was also calculated and is shown in a tabular format below (Table 1).

Figure 1: MPOD spatial distrbution demonstaring a 1st-order exponential decay function assuming a fixed, negligible parfoveal reference MPOD. The resulting exponential fit equation was y = 0.451e-0.543x with a covariance value of r2 = 0.912. (Left Figure) MPOD spatial distribution demonstarting a 1st-order exponential decay function allowing the exponential function to float using only measured eccentricites. The resulting exponential fit equation was y = 0.343e-0.404x with a covariance value of r2 = 0.853.
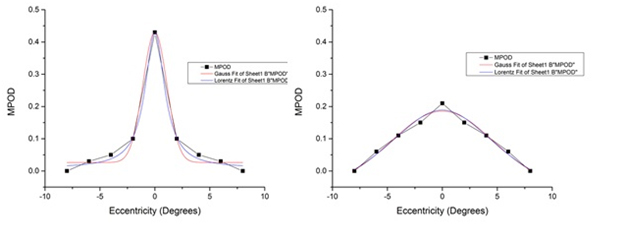
Figure 2: MPOD spatial distributions were fit to both Gaussian and Lorentzian distributions assuming stimulus center and stimulus point of highest retinal sensitivity for each subject. Substantial variability within the sample was seen from highly leptokurtic distributions demonstrated by subject #20 (left) to highly platykurtic distributions demonstrated by subject #21 (right).
|
Kurtosis Value |
Integrated AUC Stimuli |
Subject 1 |
5.166 |
1.762 |
Subject 2 |
2.554 |
1.879 |
Subject 3 |
4.577 |
2.133 |
Subject 4 |
4.308 |
1.765 |
Subject 5 |
3.042 |
2.098 |
Subject 6 |
2.175 |
1.912 |
Subject 7 |
3.363 |
2.448 |
Subject 8 |
1.704 |
1.954 |
Subject 9 |
1.837 |
1.988 |
Subject 10 |
2.271 |
1.781 |
Subject 11 |
5.313 |
1.551 |
Subject 12 |
5.215 |
1.881 |
Subject 13 |
0.399 |
1.831 |
Subject 14 |
4.312 |
1.498 |
Subject 15 |
2.731 |
2.571 |
Subject 16 |
5.395 |
1.633 |
Subject 17 |
0.806 |
2.018 |
Subject 18 |
3.302 |
1.505 |
Subject 19 |
2.392 |
1.638 |
Subject 20 |
7.154 |
1.513 |
Subject 21 |
-0.763 |
1.705 |
Subject 22 |
1.627 |
2.371 |
Subject 23 |
4.603 |
1.666 |
Subject 24 |
1.937 |
1.579 |
Subject 25 |
2.112 |
2.135 |
Subject 26 |
2.246 |
0.851 |
Subject 27 |
0.825 |
1.245 |
Subject 28 |
1.222 |
1.087 |
Subject 29 |
3.719 |
1.346 |
Subject 30 |
2.591 |
2.587 |
Subject 31 |
1.049 |
1.693 |
Subject 32 |
3.102 |
1.566 |
Subject 33 |
-0.503 |
1.487 |
Mean |
2.781 |
1.778 |
StdDev |
1.809 |
0.393 |
Table 1: Calculated values for kurtosis, integrated AUC assuming stimulus center and integrated AUC for the 33 subject sample using MPOD values measured at 0º, 2º, 4º, 6º and 8º eccentricity. The kurtosis values showed a non-significant relationship with AUC calculations (r = -0.004, p=0.984) across the 33 subject sample.
The AUC calculations showed a non-significant relationship with kurtosis values (r = -0.004, p=0.984) across the 33 subject sample.
Conclusions
The spatial distribution of MPOD in this sample as measured by cHFP was well-described by a first-order exponential function originating at the foveal center in agreement with ex vivoHPLC studies [35]and a Lorentzian function across the macula [4,19]. Previous studies have identified an edge effect in the measurement of MPOD using HFP techniques [9,15]. Bone et al. [36] disputed the edge effect measurement of HFP citing that involuntary microsaccadic activity was responsible for the apparent edge effect. Hammond et al. [37] found strong agreement for the edge effect measurement by HFP but only within the central 1o with considerable, non-systematic variability was identified outside of 1 degree. Spatial distribution results from this study show a high covariance value (r2 = 0.869) using only measured at retinal loci at 0º, 2º, 4º and 6ºeccentricity and allowing the 8ºparafoveal reference point unpinned. Although the study sample distribution is best fit by a Lorentzian function across the macula, large individual differences in distribution shape are seen.
The study sample demonstrates a mean positive kurtosis (i.e. leptokurtic) value. This offers support of the Lorentzian fit to MPOD spatial distribution over a Gaussian fit due to the higher central peak of the Lorentzian function. The relatively large variance in the kurtosis values also supports the large variability in individual MPOD spatial distributions when fit to a Lorentzian function. Methods of MPOD spatial distribution including kurtotic descriptions and integratedAUC calculations show substantial variability among individuals and within the substantial variability is where differences in visual performance measures may lie.
The overall distribution measure of MPOD shows an inverse association with retinal eccentricity. The trend of decreasing MPOD as a function of eccentricity has been documented by both ex vivo studies [7,26]and in vivostudies [1,38]of the MP spatial distribution. The results of this experiment support and confirm the previously identified first order exponential decay curve exhibited by MP as a function of retinal eccentricity. Several studies have described a secondary peak or ring-like structure of MPOD that is found between approximately 0.500 and 0.85º eccentric to fovea in 10-20% of the general population [39,40]. The cHFP device designed and built for this project focused on the overall spatial distribution from 0º to 8º eccentricity measured with a 1º stimulus at 2º intervals. Due to this device design, measurement and verification of predicted ring-like MPOD findings is not within the scope of the current project but design modifications to the existing cHFP device would allow such a measurement.
Anatomic structure has also been demonstrated to influence MPOD spatial profiles. Specifically, Nolan et al. found that foveal width was associated with non-typical MP spatial distribution [41]. Increased foveal width was significantly related to MP spatial profiles due in part to increased length of the foveal cone axons. The slope of the foveal depression was also shown to influence the slope of the MPOD spatial distribution. Steep foveal depressions were significantly related to steep MPOD spatial distributions.
Risk factors such as age and increased oxidative stress along with differences in foveal anatomic architecture have been shown to create non-exponential declines in MPOD spatial distribution with increasing eccentricity. Assessment of MPOD spatial distribution for these individuals would likely be better expressed as an integrated area under the curve. Results from the current experiment across 33 subjects ages 22-34 supported a monotonic exponential decay curve consistent with Kirby et al. which found that younger subjects tended to exhibit a typical exponential decay function with increasing eccentricity when measured by HFP [42]. Kirby et al.also hypothesized that changes in the typical exponential function of MPOD distribution with age may be in part to cumulative short-wavelength visible light absorption.
The high level of agreement in MPOD among the 4 measured meridians supports a symmetrical, concentric spatial distribution pattern in subjects without evidence of retinal pathology. This lends support to the use of a single meridian to measure the MPOD spatial distribution using cHFP techniques. The use of a single, horizontal meridian to determine the overall MPOD spatial distribution may allow cHFP to become an inexpensive, viable method in clinical practice. Additionally, using kurtosis values in combination with calculated AUC may provide a more complete picture regarding spatial distribution of MPOD.
MP spatial distribution variability among the population is underrepresented by single, central measurements. Foveal secondary peaks have been identified by several studies that have ascribed an overall bimodal distribution. Using autofluorescence techniques, Deloriet al.[43] refer to an exponential-like decay function with a superimposed annulus if increased density at approximately 0.7ºeccentricitywhile Berendschotet al.[39] using a combination of both autofluorescence and fundus reflectance, described an exponential decay function in combination with a Gaussian distributed ring pattern at approximately 0.7º eccentricity. HFP methods employed by Kirby et al.[40] identified in a small portion of their subjects a lack of a typical central peak with a central distribution dipand 2 wavelength autofluorescence utilized by Dietzelet al.[44] found a central peak of MPOD surrounded by a ring of increased density extending from 0.5º to 0.85ºeccentricity [44]. Other studies have described broad areas of increased MPOD at eccentricities outside the foveola. Using fundus reflectometry, Chen et al.[3] demonstrated MPOD shoulders at 4º from foveal centerand Robson et al.[17] recognized similar MPOD increases around 4o eccentricity in 10% of their subjects.
Hammond et al. measured MPOD spatial distribution out to 4º eccentricity using a parafoveal reference point of 5.5º identifying a half-maximum at 1.03º (0.38º) [1].Wooten et al.[38] measured MPOD spatial distribution out to 2º using a parafoveal reference point of 4º identifying a half-maximum at 0.7º (0.15o). Nolan et al.[41] utilized measurements to 5o eccentricity with a 7oparafoveal reference point with a half-maximum, inferred from their sample mean spatial profile, of approximately 1-1.1o eccentricity. The design of our cHFP device allowed a greater extent of the MPOD spatial distribution to be directly measured. The previously established exponential decay function of MPOD spatial distribution was confirmed out to 6o.
2021 Copyright OAT. All rights reserv
Further studies are warranted to investigate the relationship of kurtosis and AUC calculations using an objective measure of MPOD such as autofluorescence or fundus reflectometry to confirm the large variability of individual spatial distribution maps among subjects. Eccentric flicker rates were determined using the subject’s CFF and an algorithm look-up table consistent with reported eccentric flicker rates reported by Hammond et al.[37], Snodderlyet al.[45]and Stringhamet al.[46]Non-exponential distribution patterns may be a result of non-optimal eccentric stimulus flicker rates for these subjects. Symmetry along both horizontal and vertical meridians was demonstrated out to a 6o eccentricity.
A single meridian measure, likely a horizontal meridian, provides a viable option to incorporate spatial distribution measurements in to clinical applications using cHFP techniques and a combination of AUC and kurtosis values may be a more valuable measure of total MP within a defined spatial area. The high symmetry of all measured meridians may also allow for a complete 3-dimensional modeling of MPOD across the central 16o using cHFP assessments along a single radius. Further work is on-going to identify relationships between 3-dimensional topographic mapping of MPOD using cHFP and measures of visual performance.
Acknowledgements
The author wants to thank Wayne Garver and Michael Howe for their engineering and mechanical expertise during the development of the UMSL customized heterochromatic flicker photometer.
References
- Hammond BR Jr, Wooten BR, Snodderly DM (1997) Individual variations in the spatial profile of human macular pigment.J Opt Soc Am A Opt Image Sci Vis14: 1187-1196. [Crossref]
- Elsner AE, Burns SA, Beausencourt E, Weiter JJ (1998) Foveal cone photopigment distribution: small alterations associated with macular pigment distribution.Invest Ophthalmol Vis Sci39: 2394-2404. [Crossref]
- Chen SF, Chang Y, Wu JC (2001) The spatial distribution of macular pigment in humans.Curr Eye Res23: 422-434. [Crossref]
- Stringham JM, Fuld K, Wenzel AJ (2003) Action spectrum for photophobia.J Opt Soc Am A Opt Image Sci Vis 20: 1852-1858. [Crossref]
- Trieschmann M, Spital G, Lommatzsch A, van Kuijk E, Fitzke F, et al.(2003) Macular pigment: quantitative analysis on autofluorescence images.Graefes Arch ClinExpOphthalmol241: 1006-1012. [Crossref]
- Bernstein PS, Ahmed F, Liu A, Sharifzadeh M, Ermakov I, et al.(2009) Macular Pigment Imaging in AREDS II Participants: Baseline Studies From an Ancillary Study of AREDS II Subjects Enrolled at the Moran Eye Center. Invest Ophthal Vis Sci50. [Crossref]
- Kilbride PE, Alexander KR, Fishman M, Fishman GA (1989) Human macular pigment assessed by imaging fundus reflectometry.Vision Res29: 663-674. [Crossref]
- Berendschot TT, Goldbohm RA, Klöpping WA, van de Kraats J, van Norel J, et al.(2000) Influence of lutein supplementation on macular pigment, assessed with two objective techniques.Invest Ophthalmol Vis Sci 41: 3322-3326. [Crossref]
- Delori FC, Goger DG, Hammond BR, Snodderly DM, Burns SA (2001) Macular pigment density measured by autofluorescence spectrometry: comparison with reflectometry and heterochromatic flicker photometry. J Opt Soc Am A Opt Image Sci Vis18:1212-1230. [Crossref]
- Trieschmann M, Heimes B, Hense HW, Pauleikhoff D (2006) Macular pigment optical density measurement in autofluorescence imaging: comparison of one-and two-wavelength methods. Graefe's Arch ClinExpOphthal 244:1565-1574. [Crossref]
- Bernstein PS, Zhao DY, Wintch SW, Ermakov IV, McClane RW, et al.(2002) Resonance Raman measurement of macular carotenoids in normal subjects and in age-related macular degeneration patients. Ophthal 109:1780-1787. [Crossref]
- Gellermann W, Ermakov IV, Ermakova MR, McClane RW, Zhao DY, et al. (2002) In vivo resonant Raman measurement of macular carotenoid pigments in the young and the aging human retina. J Opt Soc Am A Opt Image Sci Vis 19:1172-1186. [Crossref]
- Pease PL, Adams AJ, Nuccio E (1987) Optical density of human macular pigment.Vision Res27: 705-710. [Crossref]
- Bone RA, Landrum JT, CainsA (1992) Optical density spectra of the macular pigment in vivo and in vitro.Vision Res32: 105-110. [Crossref]
- Hammond BR Jr, Johnson EJ, Russell RM, Krinsky NI, Yeum KJ, et al. (1997) Dietary modification of human macular pigment density.Invest Ophthalmol Vis Sci38: 1795-1801. [Crossref]
- Davies NP, Morland AB (2002) Color matching in diabetes: optical density of the crystalline lens and macular pigments.Invest Ophthalmol Vis Sci43: 281-289. [Crossref]
- Robson AG, Moreland JD, Pauleikhoff D, Morrissey T, Holder GE, et al. (2003) Macular pigment density and distribution: comparison of fundus autofluorescence with minimum motion photometry.Vision Res43: 1765-1775. [Crossref]
- Bone RA, Landrum JT, Tarsis SL (1985) Preliminary identification of the human macular pigment.Vision Res 25: 1531-1535. [Crossref]
- Bernstein PS, Khachik F, Carvalho LS, Muir GJ, Zhao DY, et al. (2001) Identification and quantitation of carotenoids and their metabolites in the tissues of the human eye.Exp Eye Res72: 215-223. [Crossref]
- Rapp LM, Maple SS, Choi JH (2000) Lutein and zeaxanthin concentrations in rod outer segment membranes from perifoveal and peripheral human retina.Invest Ophthalmol Vis Sci41: 1200-1209. [Crossref]
- Sommerburg OG, Siems WG, Hurst JS, Lewis JW, Kliger DS, et al.(1999) Lutein and zeaxanthin are associated with photoreceptors in the human retina.Curr Eye Res19: 491-495. [Crossref]
- Trieschmann M, Heimes B, Hense HW, Pauleikhoff D (2006) Macular pigment optical density measurement in autofluorescence imaging: comparison of one- and two-wavelength methods.Graefes Arch ClinExpOphthalmol 244: 1565-1574. [Crossref]
- Wenzel AJ, Fuld K, Stringham JM, Curran-Celentano J (2006) Macular pigment optical density and photophobia light threshold.Vision Res46: 4615-4622. [Crossref]
- Bone RA, Landrum JT, Friedes LM, Gomez CM, Kilburn MD, et al.(1997) Distribution of lutein and zeaxanthin stereoisomers in the human retina.Exp Eye Res64: 211-218. [Crossref]
- Osterberg G (1935) Topography of the layer of rods and cones in the human retina. ActaOphthalSupplement 6: 1.
- Curcio CA, Sloan KR, Kalina RE, Hendrickson AE (1990) Human photoreceptor topography.J Comp Neurol292: 497-523. [Crossref]
- Bone RA, Landrum JT, Cao Y, Howard AN, Alvarez-Calderon F (2007) Macular pigment response to a supplement containing meso-zeaxanthin, lutein and zeaxanthin.NutrMetab (Lond)4: 12. [Crossref]
- Nolan JM, Stringham JM, Beatty S, Snodderly DM (2008) Spatial profile of macular pigment and its relationship to foveal architecture.Invest Ophthalmol Vis Sci49: 2134-2142. [Crossref]
- Meyer zuWestrup V, Dietzel M, Pauleikhoff D, Hense HW (2014) The association of retinal structure and macular pigment distribution.Invest Ophthalmol Vis Sci55: 1169-1175. [Crossref]
- Gass JD (1999) Müller cell cone, an overlooked part of the anatomy of the fovea centralis: hypotheses concerning its role in the pathogenesis of macular hole and foveomacualrretinoschisis.Arch Ophthalmol117: 821-823. [Crossref]
- Reichenbach A, Bringmann A (2013) New functions of Müller cells.Glia 61: 651-678. [Crossref]
- Wooten BR, Hammond BR Jr, Land RI, Snodderly DM (1999) A practical method for measuring macular pigment optical density.Invest Ophthalmol Vis Sci 40: 2481-2489. [Crossref]
- Putnam CM, Bassi CJ. Macular pigment spatial distribution effects on glare disability. J Optom. http://dx.doi.org/10.1016/j.optom.2014.12.004
- Moreland JD, Bhatt P (1984) Retinal distribution of macular pigment. Colour Vision Deficiencies7: 127-132.
- Handelman GJ, Dratz EA, Reay CC, van Kuijk JG (1988) Carotenoids in the human macula and whole retina.Invest Ophthalmol Vis Sci29: 850-855. [Crossref]
- Bone RA, Landrum JT, Gibert JC (2004) Macular pigment and the edge hypothesis of flicker photometry.Vision Res44: 3045-3051. [Crossref]
- Hammond BR Jr, Wooten BR, Smollon B (2005) Assessment of the validity of in vivo methods of measuring human macular pigment optical density.Optom Vis Sci82: 387-404. [Crossref]
- Wooten BR, Hammond BR Jr (2005) Spectral absorbance and spatial distribution of macular pigment using heterochromatic flicker photometry.Optom Vis Sci82: 378-386. [Crossref]
- Berendschot TT, van Norren D (2006) Macular pigment shows ringlike structures.Invest Ophthalmol Vis Sci 47: 709-714. [Crossref]
- Dietzel M, Zeimer M, Heimes B, Pauleikhoff D, Hense HW (2011) Theringlike structure of macular pigment in age-related maculopathy: results from the Muenster Aging and Retina Study (MARS). Invest Ophthal Vis Sci52:8016-24. [Crossref]
- Nolan JM, Stringham JM, Beatty S, Snodderly DM (2008) Spatial profile of macular pigment and its relationship to foveal architecture.Invest Ophthalmol Vis Sci49: 2134-2142. [Crossref]
- Kirby ML, Beatty S, Loane E, Akkali MC, Connolly EE, et al.(2010) A central dip in the macular pigment spatial profile is associated with age and smoking.Invest Ophthalmol Vis Sci51: 6722-6728. [Crossref]
- Delori FC, Goger DG, Keilhauer C, Salvetti P, Staurenghi G (2006) Bimodal spatial distribution of macular pigment: evidence of a gender relationship.J Opt Soc Am A Opt Image Sci Vis23: 521-538. [Crossref]
- Kirby ML, Galea M, Loane E, Stack J, Beatty S, et al.(2009) Foveal anatomic associations with the secondary peak and the slope of the macular pigment spatial profile.Invest Ophthalmol Vis Sci50: 1383-1391. [Crossref]
- Snodderly DM, Mares JA, Wooten BR, Oxton L, Gruber M, et al.(2004) Macular pigment measurement by heterochromatic flicker photometry in older subjects: the carotenoids and age-related eye disease study. Invest Ophthal Vis Sci45:531-38. [Crossref]
- Stringham JM, Hammond BR, Nolan JM, Wooten BR, Mammen A, et al.(2008) The utility of using customized heterochromatic flicker photometry (cHFP) to measure macular pigment in patients with age-related macular degeneration. Exp Eye Res87:445-453. [Crossref]