Objective: We evaluated whether nutritional status and long-term prognosis of patients with refractory hepatic ascites improved after treatment with tolvaptan.
Methods: We retrospectively studied data for a total of 50 patients with hepatic ascites treated with tolvaptan from April 2011 to January 2016. Bloatedness was assessed by using the Japanese version of the support team assessment schedule before and after 3 weeks of treatment with tolvaptan. Changes in the controlling nutritional status (CONUT) and long-term prognosis were investigated.
Results: Sixty-four percent of patients reported an improvement in bloatedness. The caloric intake and the CONUT score (from 8.4 ± 2.2 to 7.4 ± 2.8, P = 0.004) were both significantly improved after tolvaptan therapy. The CONUT score and muscle mass were significantly lower in non-responders. The responders showed a loss of bodyweight, reduction of bloatedness, increase in caloric intake, and improvement in the CONUT score, but the nutritional status did not improve in non-responders. The long-term prognosis improved in responders compared with non-responders (mean survival time: 419 days vs. 212 days, P = 0.003).
Conclusion: Tolvaptan therapy is useful for treating refractory hepatic ascites, and results in improved nutritional status and long-term prognosis.
Tolvaptan, hepatic ascites, Japanese version of the support team assessment schedule, controlling nutritional status, long-term prognosis
Ascites related to liver cirrhosis significantly worsens a patient’s general condition and quality of life. Furthermore, its presence is an important prognostic factor for deterioration of a patient’s condition [1-4]. Hypoalbuminemia and hyponatremia are frequently observed in patients with ascites, and there are many patients who cannot be managed significantly with conventional therapies such as loop diuretics and spironolactone [5-9].
Tolvaptan has been recently approved in Japan for treating fluid retention in cases of liver cirrhosis that demonstrate an insufficient response to other diuretics such as loop diuretics. Tolvaptan works by vasopressin V2-receptor antagonism in the kidney collecting tubules and inhibits expression of aquaporin 2; thus, so it is categorized as a solute-free water excretion mediator that promotes a diuretic effect by inhibiting reabsorption of water [10].
In a Japanese phase III clinical trial of patients with hepatic edema, the proportion of patients with improvement in bloatedness was 62.5% in the tolvaptan group and 37.3% in the placebo group [9]. Therefore, tolvaptan therapy appeared to be a suitable option for intractable ascites of decompensated liver cirrhosis. Furthermore, it was reported that loss of appetite was improved during treatment with tolvaptan compared with placebo (38.9% vs. 16.7%, P = 0.064) [9].
Decompensated liver cirrhosis patients with refractory ascites experience decreased appetite because of a feeling of bloatedness and their nutritional status declines towards a state of starvation. Energy metabolism is also enhanced in patients with ascites [11], and an under nutrition status can devolve into a negative feedback loop with serious consequences. However, whether nutritional status improves with decreasing ascites has not been thoroughly studied.
Therefore, we evaluated whether the nutritional status of patients improved by controlling ascites and whether long-term prognosis improved among patients treated with tolvaptan using the controlling nutritional status (CONUT) method [12], which is a nutritional assessment system.
We retrospectively studied data for a total of 50 patients with hepatic ascites who did not respond adequately to conventional diuretics and were treated from April 2011 to January 2016 with tolvaptan. Because circulating plasma volume does not decrease during tolvaptan administration, water deprivation was not necessary.
Bloatedness from hepatic ascites was scored on a scale of 0 to 4 using the Japanese version of the Support Team Assessment Schedule (STAS-J) [13] before and after 3 weeks of tolvaptan treatment. A patient was defined as a responder when the score decreased by 1 point or more after tolvaptan administration. The changes in caloric intake, serum albumin (Alb), total lymphocyte count (TLC), total cholesterol (T-cho) level, hemoglobin (Hb), blood urea nitrogen (BUN), and creatinine (Cr) level were evaluated. The use of branched chain amino acids (BCAA), loop diuretics, and the mass of the third lumbar vertebrae (L3) level psoas major muscle area (psoas muscle index [PMI]) [14-17] measured on computed tomography (CT) images were investigated. The PMI was obtained by tracing an outline of the bilateral psoas major muscle using a Fuji Film Corporation testing image unification system (SYNAPSE SCOPE V2 4.1) (Tokyo, Japan) on the axial of the level of L3 on an abdominal CT image and the total area was divided by the square of the height. Nutritional status was measured by the CONUT method that utilizes the Alb, TLC, and T-cho levels [12]. We evaluated the effect of tolvaptan therapy on the patients’ nutritional status and their long-term prognosis.
Statistical analysis
All data were expressed as the mean ± standard deviation (SD). Differences were analyzed using paired t-tests, two-sample t-tests, and chi-square tests. The long-term prognosis was estimated using the Kaplan-Meier method and differences were determined using the log-rank test. P-values < 0.05 were considered statistically significant.
This study was approved by the ethical review board in the Nagoya Medical Center.
Baseline characteristics of patients (Table 1)
There were 18 men and 32 women. The average age was 69.4 ± 13.5 years. The etiology of chronic liver disease was as follows: alcoholic, 12 cases; hepatitis type B, 2 cases; hepatitis type C, 19 cases; primary biliary cirrhosis, 5 cases; autoimmune hepatitis, 4 cases; and others, 8 cases. Thirteen patients had hepatocellular carcinoma. According to the Child-Pugh score [18], 19 cases were classified as class B and 31 cases as class C, and the mean Child-Pugh score was 10.0 ± 1.5. BCAA was administered to 41 patients and the dosage was not changed during tolvaptan treatment. The mean PMI value was 3.52 ± 1.19 cm2/m2.
Table 1. Baseline Characteristics of Patients
|
Age (Years)
|
69.4 ± 13.5
|
|
Gender (male/female)
|
18/32
|
|
Bodyweight (Kg)
|
58.9 ± 13.2
|
|
BMI (Kg/m2)
|
24.3 ± 4.3
|
|
Etiology of chronic liver disease
|
|
Alcoholic/Hepatitis B/Hepatitis C/PBC/AIH/Others
|
12/2/19/5/4/8
|
|
HCC
|
13
|
|
Child-Pugh classification (B/C)
|
19/31
|
|
Child-Pugh score
|
10.0 ± 1.5
|
|
BCAA
|
41
|
|
PMI (cm2/m2)
|
3.52 ± 1.19
|
|
Hb (g/dL)
|
10.2 ± 1.8
|
|
BUN (mg/ dL)
|
24.8 ± 16.2
|
|
Cr (mg/ dL)
|
1.0 ± 0.6
|
|
STAS-J score
|
3.2 ± 0.6
|
|
Caloric intake (Kcal)
|
955 ± 412
|
|
Alb (g/dL)
|
2.6 ± 0.5
|
|
TLC (mg/dL)
|
966 ± 523
|
|
T-cho (mg/dL)
|
110 ± 38
|
|
CONUT score
|
8.4 ± 2.2
|
Data are expressed as number or mean ± SD
PBC: primary biliary cirrhosis, AIH: autoimmune hepatitis, BCAA: branched chain amino acids, PI: L3 level psoas major muscle area (psoas index)
Effect on circulating plasma volume (Table 2)
There was no effect of tolvaptan on circulating plasma volume because no significant change was observed in Hb (from 10.2 ± 1.8 to 10.1 ± 2.0 g/dL, P = 0.445), BUN (from 25.1 ± 16.2 to 29.2 ± 25.8 mg/dL, P = 0.231), or Cr level (from 1.0 ± 0.6 to 1.2 ± 0.9 mg/dL, P = 0.220).
Table 2. Effect on circulating plasma volume
|
|
Baseline
|
3 week
|
P-value†
|
|
Hb (g/dL)
|
10.2 ± 1.8
|
10.1 ± 2.0
|
0.445
|
|
BUN (mg/dL)
|
25.1 ± 16.2
|
29.2 ± 25.8
|
0.231
|
|
Cr (mg/dL)
|
1.0 ± 0.6
|
1.2 ± 0.9
|
0.220
|
Data are expressed as mean ± SD
†Paired t -test (relative to baseline)
Efficacy of tolvaptan (Table 3)
The conventional diuretics, furosemide (36.0 ± 22.4 mg/day) and/or spironolactone (38.0 ± 23.5 mg/day) had been administered before tolvaptan treatment, but the feeling of bloatedness with ascites still existed. The patients’ mean STAS-J score significantly decreased from 3.2 ± 0.6 to 2.1 ± 1.1 (P < 0.001) after tolvaptan administration (8.6 ± 2.9 mg/day) and the bloated feeling improved in 32 patients (64%). Patient bodyweight significantly decreased from 58.9 ± 13.2 kg to 54.1 ± 12.2 kg (P < 0.001). The caloric intake increased from 955 ± 412 kcal to 1,067 ± 428 kcal (P = 0.049) after administration of tolvaptan. There were significant increases in Alb level (from 2.6 ± 0.5 g/dL to 2.8 ± 0.6 g/dL, P = 0.002), TLC (from 966 ± 523/μL to 1,124 ± 694/μL, P = 0.023), and T-cho levels (from 110 ± 38 mg/dL to 120 ± 40 mg/dL, P = 0.025) and we also found significant improvement in the nutritional status based on the CONUT score (from 8.4 ± 2.2 to 7.4 ± 2.8, P = 0.004).
Table 3. Effect of treatment
|
|
Baseline
|
3 week
|
P-value†
|
|
STAS-J score
|
3.2 ± 0.6
|
2.1 ± 1.1
|
<0.001
|
|
Bodyweight (Kg)
|
58.9 ± 13.2
|
54.1 ± 12.2
|
<0.001
|
|
Caloric intake (Kcal)
|
955 ± 412
|
1,067 ± 428
|
0.049
|
|
Alb (g/dL)
|
2.6 ± 0.5
|
2.8 ± 0.6
|
0.002
|
|
TLC (/?L)
|
966 ± 523
|
1,124 ± 694
|
0.023
|
|
T-cho (mg/dL)
|
110 ± 38
|
120 ± 40
|
0.025
|
|
CONUT score
|
8.4 ± 2.2
|
7.4 ± 2.8
|
0.004
|
Data are expressed as mean ± SD
†Paired t -test (relative to baseline)
Comparison of the baseline characteristics according to the effect of treatment (Table 4)
We compared the baseline characteristics between the responders and non-responders based on the therapeutic effect of tolvaptan. There were no significant differences in age, sex, etiology of chronic liver disease, the presence of hepatocellular carcinoma, Child-Pugh classification, or renal failure between the two groups, but caloric intake (1,096 ± 359 kcal vs. 720 ± 402 kcal, P = 0.005), CONUT score (8.0 ± 2.2 vs. 9.4 ± 1.7, P = 0.043), and PMI (3.80 ± 1.23 cm2/m2 vs. 3.03 ± 0.95 cm2/m2, P = 0.018) were significantly lower for non-responders than responders.
Table 4. Evaluation of the baseline characteristics according to the effect of treatment
|
|
Responders
|
Non-responders
|
P-value†
|
|
Age (years)
|
68.9 ± 13.0
|
70.1 ± 14.7
|
0.772
|
|
Gender (male/female)
|
11/21
|
7/11
|
0.750
|
|
Bodyweight (Kg)
|
60.8 ± 12.6
|
55.6 ± 14.0
|
0.225
|
|
BMI (kg/m2)
|
24.6 ± 3.7
|
24.0 ± 5.2
|
0.603
|
|
Etiology of chronic liver disease
|
|
Alcoholic/Hepatitis B/Hepatitis C/PBC/AIH/Others
|
9/0/14/3/3/3
|
3/2/5/2/1/5
|
0.190
|
|
HCC
|
7
|
6
|
0.375
|
|
Child-Pugh classification (B/C)
|
14/18
|
5/13
|
0.264
|
|
Child-Pugh score
|
9.8 ± 1.5
|
10.4 ± 1.6
|
0.159
|
|
BCAA (g)
|
10.0 ± 3.6
|
7.2 ± 5.1
|
0.130
|
|
PMI (cm2/m2)
|
3.80 ± 1.23
|
3.03 ± 0.95
|
0.018
|
|
Hb (g/dL)
|
10.3 ± 1.8
|
10.2 ± 1.9
|
0.852
|
|
BUN (mg/dL)
|
22.3 ± 13.7
|
29.4 ± 19.4
|
0.182
|
|
Cr (mg/dL)
|
1.0 ± 0.6
|
1.1 ± 0.6
|
0.593
|
|
STAS-J score
|
3.1 ± 0.7
|
3.3 ± 0.6
|
0.415
|
|
Caloric intake (Kcal)
|
1,096 ± 359
|
720 ± 402
|
0.005
|
|
Alb (g/dL)
|
2.7 ± 0.5
|
2.4 ± 0.5
|
0.066
|
|
TLC (/?L)
|
1,058 ± 492
|
808 ± 550
|
0.107
|
|
T-cho (mg/dL)
|
115 ± 40
|
98 ± 31
|
0.140
|
|
CONUT score
|
8.0 ± 2.2
|
9.4 ± 1.7
|
0.043
|
Data are expressed as number or mean ± SD
†two-sample t-test
PBC: primary biliary cirrhosis, AIH: autoimmune hepatitis, BCAA: branched chain amino acids, PI: L3 level psoas major muscle area (psoas index)
Change in the nutritional status according to the effect of treatment (Table 5)
We compared the nutritional status before and after tolvaptan therapy in responders and non-responders. No improvement in STAS-J score, caloric intake, or nutritional status was observed for non-responders, but the bodyweight did decrease. For responders, an improvement was observed in terms of bodyweight loss (from 60.8 ± 12.6 kg to 55.7 ± 11.8 kg, P < 0.001), bloatedness (STAS-J score: from 3.1 ± 0.7 to 1.4 ± 0.7, P < 0.001), caloric intake (from 1,096 ± 359 kcal to 1,285 ± 264 kcal, P = 0.014) and the CONUT score (from 8.0 ± 2.2 to 6.6 ± 2.7, P < 0.001).
Table 5. Change of the nutritional status according to the effect of treatment
|
|
Baseline
|
3 week
|
P-value†
|
|
STAS-J score
|
|
|
|
|
Responders
|
3.1 ± 0.7
|
1.4 ± 0.7
|
<0.001
|
|
Non-responders
|
3.3 ± 0.6
|
3.3 ± 0.6
|
1.000
|
|
Bodyweight (Kg)
|
|
|
|
|
Responders
|
60.8 ± 12.6
|
55.7 ± 11.8
|
<0.001
|
|
Non-responders
|
55.6 ± 14.0
|
51.4 ± 12.8
|
0.003
|
|
Caloric intake (Kcal)
|
|
|
|
|
Responders
|
1,096 ± 359
|
1,285 ± 264
|
0.014
|
|
Non-responders
|
720 ± 402
|
703 ± 488
|
0.825
|
|
Alb (g/dL)
|
|
|
|
|
Responders
|
2.7 ± 0.5
|
3.0 ± 0.5
|
<0.001
|
|
Non-responders
|
2.4 ± 0.5
|
2.4 ± 0.5
|
0.739
|
|
TLC (/?L)
|
|
|
|
|
Responders
|
1,058 ± 492
|
1,288 ± 714
|
0.026
|
|
Non-responders
|
808 ± 550
|
841 ± 572
|
0.581
|
|
T-cho (mg/dL)
|
|
|
|
|
Responders
|
115 ± 40
|
131 ± 39
|
0.006
|
|
Non-responders
|
98 ± 31
|
94 ± 30
|
0.618
|
|
CONUT score
|
|
|
|
|
Responders
|
8.0 ± 2.2
|
6.6 ± 2.7
|
<0.001
|
|
Non-responders
|
9.4 ± 1.7
|
9.4 ± 2.0
|
1.000
|
Data are expressed as mean ± SD
†Paired t -test (relative to baseline)
Long-term prognosis (Figure 1)
After tolvaptan administration, 16 responders died (9 due to hepatic failure, 4 cancer-related deaths, and 3 deaths due to other causes) and 12 non-responders died (7 due to hepatic failure, 3 cancer-related deaths, and 2 deaths due to other causes), but the death rate was not significantly different between the two groups. The mean survival time (MST) was 419 days in all patients, 212 days in non-responders, and 530 days in responders (P = 0.003). The long-term prognosis improved in responders compared with non-responders.
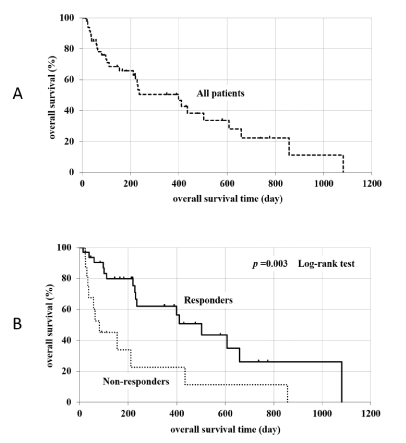
figure 1. Long term prognosis (A: all patients, B: compared with responders and non-resonders)
Nutritional status is commonly evaluated via a subjective global assessment or measurements of arm circumference, arm muscle circumference, and triceps skinfolds [19-21], but when using these measures, nutritional status may be underestimated in patients with chronic liver disease [22,23]. Methods to evaluate skeletal muscle mass include arm circumference measurements, dual-energy X-ray absorptiometry [24], bioelectrical impedance analysis [25], and CT or magnetic resonance imaging (MRI). In particular, CT or MRI are desirable methods to analyze systemic muscle mass with objectivity and accuracy, and the psoas major muscle area at the level of L3 is used as a standard index [15,26]. In the current study, we found that the PMI was remarkably low at baseline by measuring the area on abdominal CT images. We presumed that the patients had sarcopenia from refractory hepatic ascites.
The CONUT method [12] utilizes three blood measurements, serum Alb, TLC, and T-cho level. It reflects protein savings, immunity, and fat metabolism. We classified the nutritional status of our patients into four categories: normal (0–1), low (2–4), moderate (5–8), and severe (9–12). The CONUT method is effective for evaluating malnutrition and can be frequently applied over time.
The model for end-stage liver diseases (MELD) scale [27] is used as a standard assessment system to predict short-term prognosis in end stage hepatic disease, but it cannot predict the long-term prognosis or nutritional status of the patient. Sixty-three percent of patients with liver cirrhosis were reported to have malnutrition by using the CONUT method [28]. The CONUT method has also been used as a nutritional index in long-term prognostication for end-stage hepatic disease [29]. Therefore, in this study we evaluated the control of hepatic ascites and nutritional status after tolvaptan administration using the CONUT method. The nutritional status of our patients with refractory ascites was moderate or severe malnutrition based on the CONUT score before tolvaptan administration.
The observation period to judge the efficacy of tolvaptan therapy was set for 3 weeks because the half-life of serum Alb, which is one of the factors that constitute the CONUT score, is approximately 3 weeks and the CONUT method was developed for short-term assessments [30].
The STAS-J symptom edition (the third edition) [13] was developed for the purpose of applying to each symptom on the STAS-J “the effect that a symptom gives to the patients” [31]. It is used for single metrics by a physician or other medical staff. Because of the pain due to bloatedness in patients with refractory ascites, a convenient rating system with few physical burdens is preferable. Therefore, we chose the STAS-J score to evaluate the feeling of bloatedness because STAS-J evaluation is performed by a physician or other medical staff and there is no burden placed on the patients. STAS-J is scored from 0 to 4, 0: there is no symptom. 1: there are occasional or intermittent single or several symptoms at a time, but the patients’ can continue with everyday life and their symptoms do not require treatment. 2: There are symptoms of a moderate degree on days when the patient’s condition is poor, and it may affect the ability to perform activities of daily living. 3: There are often strong symptoms, and they remarkably affect concentration on and the ability to perform activities of daily living. 4: There are continuous, not tolerable intense symptoms. The patient cannot think about other things.
If conventional diuretics are not effective for refractory ascites, comprehensive treatment such as nutrition education, medication with BCAA, and consumption of a late evening snack (LES) is provided, and invasive therapies such as Alb intravenous infusion and paracentesis drainage, cell-free and concentrated ascites reinfusion therapy, or a peritoneovenous shunt (Denver shunt) may be used. The majority of patients is given BCAA and initiates LES while receiving nutrition education from a dietitian.
We used tolvaptan therapy without choosing any invasive treatment while liver cirrhosis comprehensive treatment was provided. As a result, STAS-J score and bodyweight significantly decreased, and 64% of patients had an improvement in bloatedness, and the pain of the patients was relieved. Therefore, tolvaptan was proven to be a useful therapeutic drug in the short-term even in patients with a limited response to conventional diuretics.
The patients who experienced reduced or completely resolved ascites significantly increased their caloric intake. Furthermore, all three factors of serum Alb level, TLC, and T-cho level that constitute the CONUT score and the CONUT score itself significantly improved. We also thought that the decrease of ascites contributed to improving energy metabolism [11].
The patients were not dehydrated by the strong diuretic effect of tolvaptan therapy and they were not deprived of water. It is possible the circulating plasma volume could be decreased by tolvaptan therapy, followed by a relative increase in serum Alb level; thus, we measured blood Hb, BUN, and Cr level before and after therapy. However, no significant changes were observed. Our results indicate that a decrease in the circulating plasma volume was not the cause of the increased serum Alb levels. This supports the conclusion that improvements in bloatedness were the cause of the increased caloric intake.
In the comparison of baseline characteristics between responders and non-responders there was no significant difference in age, sex, bodyweight loss, etiology of chronic liver disease, the presence of hepatocellular carcinoma, use of BCAA, or renal function, but caloric intake, CONUT score, and PMI were significantly lower in non-responders. This suggests that the effect of treatment is attenuated when nutritional status is strongly affected before tolvaptan administration.
Furthermore, we examined the change in nutritional status according to the tolvaptan effect. A change in nutritional status was absent for non-responders, but caloric intake increased in response to improvement of the STAS-J score and nutritional status significantly improved in responders.
The prognosis of patients with liver cirrhosis with ascites is reported to be poor with 62% deceased at 6 months, 56% at 12 months, and 49% at 24 months [12]. The patients in this study were in an extremely poor prognosis group due to being end-stage and not responding to conventional diuretics. We hypothesized that the improvement of their nutritional status had improved the long-term prognosis in responders, because the MST was significantly improved in responders (530 days) compared with non-responders (212 days) to tolvaptan therapy.
The results of this study show that tolvaptan can relieve bloatedness from intractable ascites complicated with end-stage decompensated liver cirrhosis that does not respond to conventional diuretics, and the patients’ nutritional status can also improve, as shown by measuring caloric intake. Thus, we expect this new therapy can be used to improve prognosis.
This was a retrospective study in a single institution, and in future, a larger, multicenter prospective study should be performed to confirm our findings.
In conclusion, tolvaptan was useful for treating refractory ascites of decompensated liver cirrhosis that was not responding to conventional diuretics. Nutritional status at baseline was an important predictor of the efficacy of tolvaptan. Nutritional status and the long-term prognosis of the patients were improved after receiving tolvaptan.
- Schlichting P, Christensen E, Andersen PK, Fauerholdt L, Juhl E, et al. (1983) Prognostic factors in cirrhosis identified by Cox's regression model. Hepatology 3: 889-895. [Crossref]
- Orrego H, Israel Y, Blake JE, Medline A (1983) Assessment of prognostic factors in alcoholic liver disease: toward a global quantitative expression of severity. Hepatology 3: 896-905. [Crossref]
- Ginés P, Quintero E, Arroyo V, Terés J, Bruguera M, et al. (1987) Compensated cirrhosis: natural history and prognostic factors. Hepatology 7: 122-128. [Crossref]
- Llach J, Gines P, Arroyo V, Rimola A, Titó L, et al. (1988) Prognostic value of arterial pressure, endogenous vasoactive systems, and renal function in cirrhotic patients admitted to the hospital for the treatment of ascites. Gastroenterology 94: 482-487. [Crossref].
- Na KY, Han JS, Kim YS, Ahn C, Kim S, et al. (2001) Does albumin preinfusion potentiate diuretic action of furosemide in patients with nephrotic syndrome? J Korean Med Sci 16: 448-454. [Crossref]
- Péron JM, Bureau C, Gonzalez L, Garcia-Ricard F, de Soyres O, et al. (2005) Treatment of hepatorenal syndrome as defined by the international ascites club by albumin and furosemide infusion according to the central venous pressure: a prospective pilot study. Am J Gastroenterol 100: 2702-2707. [Crossref]
- Dharmaraj R, Hari P, Bagga A (2009) Randomized cross-over trial comparing albumin and frusemide infusions in nephrotic syndrome. Pediatr Nephrol 24: 775-782. [Crossref]
- Doungngern T, Huckleberry Y, Bloom JW, Erstad B (2012) Effect of albumin on diuretic response to furosemide in patients with hypoalbuminemia. Am J Crit Care 21: 280-286. [Crossref]
- Sakaida I, Kawazoe S, Kajimura K, Saito T, Okuse C, et al. (2014) Tolvaptan for improvement of hepatic edema: A phase 3, multicenter, randomized, double-blind, placebo-controlled trial. Hepatol Res 44: 73-82. [Crossref]
- Zmily HD, Daifallah S, Ghali JK (2011) Tolvaptan, hyponatremia, and heart failure. Int J Nephrol Renovasc Dis 4: 57-71. [Crossref]
- Dolz C, Raurich JM, Ibáñez J, Obrador A, Marsé P, et al. (1991) Ascites increases the resting energy expenditure in liver cirrhosis. Gastroenterology 100: 738-744. [Crossref]
- Ignacio de Ulíbarri J, González-Madroño A, de Villar NG, González P, González B, et al. (2005) CONUT: a tool for controlling nutritional status. First validation in a hospital population. Nutr Hosp 20: 38-45. [Crossref]
- STAS working group (2007) STAS-J (the Japanese version Support Team Assessment Schedule)scoring manual. For clinical audit in the palliative care. Japan Hospice/Palliative Care Foundation, 3rd edn. Chiba: Koubunsya 1-93.
- Shen W, Punyanitya M, Wang Z, Gallagher D, St-Onge MP, et al. (2004) Total body skeletal muscle and adipose tissue volumes: estimation from a single abdominal cross-sectional image. J Appl Physiol 97: 2333-2338. [Crossref]
- Mourtzakis M, Prado CM, Lieffers JR, Reiman T, McCargar LJ et al. (2008) A practical and precise approach to quantification of body composition in cancer patients using computed tomography images acquired during routine care. Appl Physiol Nutr Metab 33: 997-1006. [Crossref]
- Jessica R Lieffers, Marina Mourtzakis, Kevin D Hall, et al. (2009) A viscerally driven cachexia syndrome in patients with advanced colorectal cancer: contributions of organ and tumor mass to whole-body energy demands. Am J Clin Nutr 89: 1173–1179. [Crossref]
- Baracos VE, Reiman T, Mourtzakis M, Gioulbasanis I, Antoun S (2010) Body composition in patients with non-small cell lung cancer: a contemporary view of cancer cachexia with the use of computed tomography image analysis. Am J Clin Nutr 91: 1133S-1137S. [Crossref]
- Pugh RN, Murray-Lyon IM, Dawson JL, Pietroni MC, Williams R (1973) Transection of the oesophagus for bleeding oesophageal varices. Br J Surg 60: 646-649. [Crossref]
- Alberino F, Gatta A, Amodio P, Merkel C, Di Pascoli L, et al. (2001) Nutrition and survival in patients with liver cirrhosis. Nutrition 17: 445-450. [Crossref]
- Alvares-da-Silva MR, Reverbel da Silveira T (2005) Comparison between handgrip strength, subjective global assessment, and prognostic nutritional index in assessing malnutrition and predicting clinical outcome in cirrhotic outpatients. Nutrition 21: 113-117. [Crossref]
- Terakura Y, Shiraki M, Nishimura K, Iwasa J, Nagaki M, et al. (2010) Indirect calorimetry and anthropometry to estimate energy metabolism in patients with liver cirrhosis. J Nutr Sci Vitaminol (Tokyo) 56: 372-379. [Crossref]
- Cheung K, Lee SS, Raman M (2011) Prevalence and mechanisms of malnutrition in patients with advanced liver disease, and nutrition management strategies. Clin Gastroenterol Hepatol 10: 117-125. [Crossref]
- The Japanese society of gastroenterology (2015). Evidence-based clinical practice guidelines for liver cirrhosis 2015 (2nd edition). Tokyo: Nankodo, Japan.
- Lorente Ramos RM, Azpeitia Armán J, Arévalo Galeano N, Muñoz Hernández A, García Gómez JM, et al. (2012) Dual energy X-ray absorptimetry: fundamentals, methodology, and clinical applications. Radiologia 54: 410-423. [Crossref]
- Janssen I, Heymsfield SB, Baumgartner RN, Ross R (2000) Estimation of skeletal muscle mass by bioelectrical impedance analysis. J Appl Physiol (1985) 89: 465-471. [Crossref]
- Mori N, Higashiguchi T, Ito A, Futamura A, Watanabe T, et al. (2014) Clinical significance of the cross-sectional area of the psoas major muscle on a computed tomography image in cancer patients. JJSPEN 29: 1211-1217.
- Kamath PS, Wiesner RH, Malinchoc M, Kremers W, Therneau TM, et al. (2001) A model to predict survival in patients with end-stage liver disease. Hepatology 33: 464-470. [Crossref]
- Larramona GL, Lucendo AJ, Tenias JM (2015) Association between nutritional screening via the Controlling Nutritional Status index and bone mineral density in chronic liver disease of various etiologies. Hepatol Res 45: 618-628. [Crossref]
- Fukushima K, Ueno Y, Kawagishi N, Kondo Y, Inoue J, et al. (2011) The nutritional index ‘CONUT’ is useful for predicting long-term prognosis of patients with end-stage liver diseases. Tohoku J Exp Med 224: 215-219. [Crossref]
- Ulíbarri Pérez JI, Fernández G, Salvanés FR, Díaz López AM (2014) Nutritional screening; control of clinical undernutrition with analytical parameters. Nutr Hosp 29: 797-811. [Crossref]
- Miyashita M, Matoba K, Sasahara T, Kizawa Y, Maruguchi M, et al. (2004) Reliability and validity of the Japanese version of the Support Team Assessment Schedule (STAS-J). Palliat Support Care 2: 379-385. [Crossref]