Abstract
The periodontal ligament (PDL) maintains alveolar bone homeostasis against mastication force. Occlusal hypofunction, which lost mastication force, narrows the PDL by alveolar bone apposition, though the mechanisms remain unclear. Asporin is a secreted extracellular matrix protein and preferentially expressed in the PDL. Asporin binds directly with transforming growth factor-beta (TGF-b) and inhibits TGF-b/Smad signaling, resulting in the inhibition of bone formation. In the present study, we hypothesized that Asporin is downregulated by occlusal hypofunction, which results in the increased alveolar bone apposition via relative upregulation of TGF-βsignaling. To clarify the hypothesis, we employed in vivo experiments using rats.
Crowns of lower right first molar in Wistar rats were removed to induce occlusal hypofunction in upper right first molar. Alveolar bone apposition was examined by histomorphometric analysis of Calcein/Xylenol-orange vital staining. Asporin, TGF-b, and it`s signaling molecule, Smad3 expression were examined in mRNA and protein levels. Osteoblastic differentiation of the cell in the PDL under the occlusal hypofunction were observed using Bone sialoprotein (BSP), Osteocalcin and Osteopontin expression as osteoblastic differentiation marker.
We discovered that occlusal hypofunction increased the alveolar bone apposition and downregulated Asporin expression in PDL fibroblasts. Furthermore, occlusal hypofunction relative augmented TGF-βsignaling in PDL judged by phosphorylated (p)-Smad2/3 immunohistochemical staining, and upregulated osteoblastic differentiation in PDL.
In the present study, we firstly reported that occlusal hypofunction mediates alveolar bone apposition via relative augmentation of TGF-βsignaling by decrease of Asporin production.
Key words
asporin, occlusal hypofunction, tgf-b, smad signaling, alveolar bone apposition
Introduction
The periodontal ligament (PDL) is a fibrous connective tissue that is interposed between the roots of the teeth and the alveolar bone. The PDL plays an important role in supporting and preserving the tooth against external force including mastication force [1]. Optimal mechanical stimuli are essential to maintain healthy alveolar bone by inducing the formation and remodeling of the alveolar bone [2,3]. However, in the situation of loss of the tooth, antagonizing tooth lose the occlusion, (ie occlusal hypofunction), clinically exhibits extrusion of the tooth due to disuse atrophy of PDL [4].
The effects of occlusal hypofunction on the periodontal tissue have been studied [2-8]. These studies indicated that occlusal hypofunction results in atrophic changes of the PDL, narrowing of periodontal width [5-7], and increased alveolar bone formation [2,3,8]. Taken together, occlusal hypofunction narrows the PDL by alveolar bone apposition [2,3]. At this point, the molecules involved in the alveolar bone apposition by occlusal hypofunction are unknown.
TGF-βsuperfamily is known to play an important role in osteogenic cell differentiation and consequently bone formation in PDL [9,10]. Regarding the antagonizing molecule for TGF-b, Asporin is one of the well-known inhibitor for TGF-βsignaling. Asporin binds directly with TGF-βand inhibits TGF-b/Smad signaling, which is resulting in the inhibition of bone formation, and is thought to be main regulator of alveolar bone homeostasis [11,12]. Asporin is a secreted extracellular matrix protein that contains 380 amino acids. It is preferentially expressed in the PDL and encodes a novel small leucine-rich repeat proteoglycan protein [13].
In the present study, we hypothesized that Asporin is downregulated by occlusal hypofunction, which results in the increase in alveolar bone apposition via upregulation of TGF-βsignaling. To clarify the hypothesis, we employed in vivo experiments.
Materials and methods
Animals
All animal experiments were conducted with the approval of the Institutional Animal Care and Use Committee of the Tsurumi University School of Dental Medicine (approved numbers; 25A062, 26A067, 27A029, and 28A024). 12-wk-old male Wistar rats (CLEA Japan Inc., Tokyo, Japan) were used (n=48). The rats were housed 12 h light, 12 h dark cycle. They fed standard rat chow and water ad libitum.
Experimental design
Crowns of lower right first molar were removed to induce occlusal hypofunction [7]. Briefly, the crowns of the lower right molars were cut using small pliers under a combination anesthesia (Medetomidine/Midazolam/Butorphanol:0.15/2.0/2.5 mg/kg body weight, respectively) (Figure 1). Right upper jaws were used as experimental side, and the left were used as control side. Rats were sacrificed by overdose pentobarbital sodium anesthesia, and then they were fixed with perfusion of 10% Formalin Neutral Buffer Solution (Wako Pure Chemical Industries, Ltd., Osaka, Japan) at day-1, 3, 7 and 14 after crown removal.
Figure 1. Illustration of occlusal hypofunction model.
(A) Control rats with normal occlusion.
(B) Occlusal hypofunction in upper first molar was induced by removal of crowns of lower right first molar. Arrowhead indicates the removed lower first molar. Red box indicates the observed area.
Calcein/Xylenol-orange labeling
In some rats, fluorescent dyes, calcein (at day-0) (1.6 mg/kg body weight Dojindo Molecular Technologies, Inc., Kumamoto, Japan) and xylenol orange (at day-13) (50 mg/kg body weight Dojindo Molecular Technologies) were subcutaneously injected to evaluate the bone formation rate. On day-14, the rats were sacrificed and prepared undecalcified frozen sections [14].
Preparation of unfixed undecalcified frozen serial sections
Briefly, the upper jaws were excised out and rapidly immersed in liquid nitrogen, then embedded in OCT compound (Sakura Finetek Japan Co., Ltd., Tokyo, Japan). Frozen blocks were sectioned in a cryostat (Leica Microsystems, Wetzlar, Germany) by using a super-hard tungsten steel knife (Meiwa Shoji Ltd., Tokyo, Japan) [15]. Frozen blocks were cut frontally. 7 µm-thick sections were individually collected using adhesive tape, and then used for the measurement of alveolar bone apposition and RNA extraction.
Histomorphometry of alveolar bone apposition
The Calcein/Xylenol-orange fluorescent labels in the undecalcified frozen sections were examined under a fluorescent microscope (Keyence BZ-9000 Osaka, Japan). Bone apposition, which is identified by two fluorescent dyes, were measured both in frontal and cross sections. The distance between two fluorescent dyes was measured at the depth of 7-800 mm from interradicular septum in frontal sections. The distance was also measured at buccal and palatal side of distobuccal and distopalatal roots in the cross sections. 4 regions of alveolar bone in each section, three sections in each group, total 12 regions were measured using Image J [16].
RNA extraction
1/3 of the central portion of the PDL (360 mm2) in the distobuccal and distopalatal roots were microdissected from the sections by using laser capture microdissection (LCM) PALM MicroBeam system (PALM Microlaser Technologies AG, Bernried, Germany) (Figure 2) [7]. After LCM, total RNA was extracted using an RNeasy micro kit (Qiagen GmbH, Hilden,Germany) with on-column genomic DNA digestion.
Figure 2. LCM of the PDL in the undecalcified frozen sections.
(A) The frontal sections of distobuccal and distopalatal roots of the upper first molar. White box indicates the region of LCM, which are shown in the following enlarged image B.
(B,D) PDL before LCM. ab: alveolar bone, p : PDL, r : root of tooth.
(C,E) PDL after LCM. Arrowheads indicate the excised area of the PDL.
Scale bar: 300 mm (A), 100 mm (B, C, D, and E)
Real-time reverse transcription polymerase chain reaction (RT-PCR) analysis
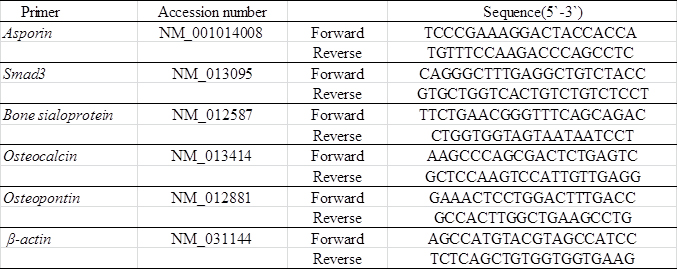
Isolated RNA was reverse transcribed with iScript cDNA-Supermix (Bio-Rad, Hercules, CA), and cDNA stock was diluted (2×) with Tris/ethylenediaminetetraacetic acid (EDTA) buffer. Real-time RT-PCR was performed with SsoFast EvaGreen-Supermix (Bio-Rad). The PCR primers used in the experiments were described in Table 1. Fold changes of gene of interests were calculated with DDCt method using %β-actin as reference gene.
Table 1. Primers used for Real-time RT-PCR.
Histological examination
Perfusion fixed upper jaws, including the molars, were excised, further fixed with 10% Formalin Neutral Buffer Solution (Wako) overnight, and decalcified with 10% EDTA in PBS for 4 weeks at 4°C. Then the specimen were dehydrated in an ascending ethanol series and embedded in paraffin. Serial paraffin sections (5 µm-thick) of periodontal tissues of the distal root of the upper first molars were prepared, and they were used for hematoxylin and eosin staining or immunohistochemical staining.
Immunohistochemistry
The sections were deparaffinized, and inactivated endogenous peroxidase activity for 30min (3% hydrogen peroxide). Then they were preincubated in 2.5% normal horse serum for 1h (Vector Laboratories, Burlingame, CA), and were subsequently incubated with primary antibodies overnight. The primary antibodies we used were anti-Asporin antibody (Acris Antibodies, Inc. Herford Germany), ant-TGF-βantibody (R&D systems, Inc. Minneapolis, MN), anti- phosphorylated (p)-Smad2/3 antibody (Santa Cruz Biotechnology, Inc. Dallas, TX), anti-Osteocalcin antibody (R&D systems, Inc. Minneapolis, MN) and anti-Osteopontin antibody (Proteintech Group, Rosemont, IL). Antigen retrieval procedure were performed in the sections for p-Smad2/3 and Osteopontin staining with L.A.B Solution (Polysciences, Inc. Warrington, PA) prior to the blocking step. After being rinsed, the sections were incubated with the peroxidase micropolymer-conjugated secondary antibody (Vector Laboratories). To visualize immunoreactivity, the sections were flooded with a diaminobenzidine solution (Vector Laboratories). Counterstaining was carried out with hematoxylin (Merck Japan, Tokyo, Japan). Sections were mounted with Entellan (Merck) and observed with a microscope. Intensity levels were measured using Image J (colour deconvolution) [16].
Statistical analysis
The results were presented as the mean ± standard deviation. The Student`s t-test was used for comparisons between the control and each experimental group, and the one-way analysis of variance (ANOVA) and Dunnett analysis was used for multiple comparisons using SPSS@ 11.0 (SPSS Inc., Chicago, IL). p˂0.05 and p˂0.01 were considered to be statistically significant.
Results
Occlusal hypofunction increased the alveolar bone apposition
Histological observation demonstrated that the PDL width in the occlusal hypofunction side (experimental side) was narrowed as compared to that in control side. A considerable amount of new bone was formed on the old bone in the occlusal hypofunction side (Figure 3B and 3C), which resulted in the decrease in PDL width as compared to these in control sections (Figure 3B and 3E). This was observed not only in the frontal section but also in the cross section (Figure 3C and 3F). These histological results confirmed by the measurement of PDL width (Figure 3G and 3I) and alveolar bone width (Figure 3H and 3J). The periodontal width in the occlusal hypofunction side was significantly smaller than that in the control side.
Figure 3. Hematoxylin and eosin staining of PDL.
(A) The frontal section of the upper first molar in control. Higher magnified image of the area indicated by black box is shown in Fig.3B.
(B) Higher magnified image of frontal section of control.
(C) Higher magnified image of frontal section of day-21 after occlusal hypofunction. Corresponding area indicated by the black box in Fig.3A is shown. Black double arrow indicates the osteoid which can be recognized by the staining properties.
(D) The cross section of the upper first molar in control. Higher magnified image of the area indicated by black box is shown in Fig.3E.
(E) Higher magnified image of cross section of control.
(F) Higher magnified image of cross section of day-21 after occlusal hypofunction. Corresponding area indicated by the black box in Fig.3D is shown. Black double arrow indicates osteoid.
B: buccal side, P: palatal side, M: mesial side, D: distal side. ab: alveolar bone, p : PDL, r: tooth root. Scale bar: 300 mm (A, D), 100mm (B, C, E, and F).
(G) The width of the PDL in frontal section.
(H) The width of osteoid in frontal section.
(I) The width of the PDL in cross section.
(J) The width of osteoid in cross section.
**: p<0.01 between the samples. n=3.
To further clarify the mechanism of the decrease in PDL width, alveolar bone apposition during 2 weeks after the experiment was examined in the several areas in the PDL (Figure 4A). Fluorescent labeling clearly demonstrated that augmented alveolar bone apposition was occurred during the experimental period. A thin layer of bone apposition occurred in the control side (Figure 4B and 4C). On the other hand, the bone apposition was enhanced and a considerable thick layer of bone was formed at 14 day in the experimental side (Figure 4D and 4E).
Figure 4. Occlusal hypofunction increased the alveolar bone apposition.
(A) The measured points of distobuccal and distopalatal roots in frontal section are illustrated. 4 regions marked as red, a: buccal side of buccal root, b: palatal side of buccal root, c: buccal side of palatal root, and d: palatal side of palatal root, were measured.
(B) Representative photographs of the fluorescent labeling in frontal section of control. Higher magnified image of the area indicated by white box is shown in Figure 4C. Green indicates Calcein label, and red indicates Xylenol-orange label.
(C) Higher magnified image of frontal section of control. The distance of two fluorescent dye indicated by white arrow were measured.
(D) Representative photographs of the fluorescent labeling in frontal section of 14 day after occlusal hypofunction. Higher magnified image of the area indicated by white box is shown in Figure 4E. Green indicates Calcein label, and red indicates Xylenol-orange label.
(E) Higher magnified image of frontal section of 14day after occlusal hypofunction. The distance of two fluorescent dye indicated by white arrow were measured.
(F) The distance of two fluorescent dye in frontal sections.
(G) The 14day/control ratio of alveolar bone apposition in frontal sections.
B: buccal side, P: palatal side. ab: alveolar bone, p: PDL, r: tooth root. Scale bar: 300 mm (B, D), 50mm (C, E). *: p<0.05, **: p<0.01 between the samples. n=3.
To evaluate the difference in the amount of bone apposition between experimental and control sides, measurement of the distance between two fluorescent dyes was performed. Occlusal hypofunction induced a significant thick layer of the alveolar bone, as compared with that in the control at all the points of frontal sections (Figure 4F). The 14day/control ratio of alveolar bone apposition were 1 to 6-folds in frontal sections, showing increased bone apposition at whole measured points (Figure 4G). These results indicate that the occlusal hypofunction increases the alveolar bone apposition.
Occlusal hypofunction downregulated asporin expression
It was reported that Asporin negatively regulates osteoblastic bone formation [11], therefore we examined the Asporin expression in the PDL under occlusal hypofunction. The expression of Asporin was significantly downregulated after 1, 3, and 7 day in the PDL in the experimental group as compared to that in the control group (Figure 5A-5C).
Figure 5. Occlusal hypofunction downregulated Asporin expression.
Real-time RT-PCR analysis for of the Asporin at day-1 (A), day-3 (B), and day-7(C) mRNA expression in PDL tissue. **: p<0.01 between the samples. n=5.
(D-I) Immunohistochemical staining of Asporin in PDL tissue. n=3. Whole image of upper molar in lower magnification are shown in each left side (Scale bar : 300 mm). The right side images are higher magnified images of the boxed area in the left side images. (1/3 of the central portion of the PDL tissue) (Scale bar : 25 mm). Expression of the Asporin protein in PDL of control (D), at day-1 (E), at day-3 (F), at day-7 (G), at day-14 (H), no primary antibody (I). B: buccal side, P: palatal side.
(J) The Intensity of the immuno-reactivity for Asporin. Mean value of 3 sections are shown.
*: p<0.05 versus control.
Then we immunohistochemically examined the Asporin expression in the PDL. In the control group, Asporin was located in the most of fibroblasts in the PDL. However, consistent with the results of real-time RT-PCR, the number of Asporin positive fibroblasts was gradually decreased with experimental periods (Figure 5D-5I). Significantly small number of Asporin positive fibroblasts was observed at experimental group (Figure 5C). These results suggest that the occlusal hypofunction downregulates Asporin expression in the PDL.
Occlusal hypofunction upregulated TGF-βsignaling
Since Asporin binds directly to TGF-βand inhibits TGF-βsignaling [11,12,17], expression of TGF-βin the PDL was immunohistochemically examined in the PDL. TGF-βwas located in the most of fibroblasts in the PDL irrespective of control and experiment (Figure 6A). Considering the reduction of Asporin in the PDL, TGF-βhas chance to escape from Asporin and works as stimulating factor for osteoblastic differentiation. The localization in the osteoblast in experimental group was somewhat different from that in control group. TGF-βwas located in the osteoblasts in the PDL in control group. In the experimental group it was also located in the osteoblasts at day-1 but its localization in osteoblast was gradually reduced in the PDL on day-7 and 14.
Figure 6. Occlusal hypofunction upregulated TGF-βsignaling.
(A) Immunohistochemical staining for TGF-βin PDL tissue. Representative photographs are shown. Scale bar: 50 mm. n=3.
(B) Real-time RT-PCR analysis for Smad3 mRNA expression in PDL tissue. *: p<0.05 between the samples. n=3.
(C) Immunohistochemical staining for p-Smad2/3 in PDL tissue. Arrowhead indicates p-Smad2/3 positive cells. Scale bar: 50 mm. n=3.
ab: alveolar bone, p : PDL, r: tooth root.
Figure 7. Occlusal hypofunction upregulated osteoblastic differentiation markers.
Real-time RT-PCR analysis for of the BSP (A), Osteocalcin (B), and Osteopontin (C) mRNA expression in PDL tissue. *: p<0.05 versus control. n=3.
Immunohistochemical staining for Osteocalcin (D) and Osteopontin (E), in PDL tissue.
The photographs under the same color development period for DAB step are shown.
Scale bar: 50 mm. ab: alveolar bone, p: PDL, r: tooth root. n=3.
Then we examined the major signaling molecule for TGF-β superfamily signaling, Smad3 [9,18]. Real-time RT-PCR revealed that Smad3 was significantly upregulated after day-7 of the occlusal hypofunction (Figure 6B). Immunohistochemistry demonstrated that p-Smad2/3 was found in several fibroblasts in the control group. p-Smad2/3 was found in considerable number of fibroblast in the PDL in experimental group at day-7 (Figure 6C). These results suggest that the occlusal hypofunction relatively augments TGF-βsignaling in PDL.
Occlusal hypofunction upregulated osteoblastic differentiation
It is well known that TGF-βsuperfamily signaling promotes osteoblastic differentiation [9,19], therefore we examined osteoblastic differentiation marker expression in the PDL under occlusal hypofunction. Osteopontin mRNA was significantly upregulated after occlusal hypofunction (Figure 7C), though bone sialoprotein (BSP) and Osteocalcin exhibited tendency toward upregulation (Figure 7A and 7B). Then localization of the Osteocalcin and Osteopontin in the PDL was immunohistochemically examined. Osteocalcin and Osteopontin were detected in the osteoblast on the bone surface and fibroblast in the PDL even in control. Osteocalcin and Osteopontin were observed in the most of fibroblast in the PDL and osteoblast on the bone surface expression at day-7 (Figure 7D and 7E). These results suggest that occlusal hypofunction upregulates osteoblastic differentiation in PDL.
Discussion
In the present study, we discovered that the occlusal hypofunction induce alveolar bone apposition through relative augmentation of TGF-βsignaling by decrease of Asporin production. It has been well-known clinically and in basic science that occlusal hypofunction caused the narrowing the width of PDL by alveolar bone apposition [2,3], though the mechanism has remained unclear.
Consistent with previous reports, the middle of the distobuccal and distopalatal roots were examined in this study. Since physiological distal movement of the molars usually takes place in the 12-13 week old rat [20], bone apposition was observed on the alveolar bone at mesial side of the roots. Therefore, we mainly observed the PDL on the buccal and palatal side of roots to eliminate the effect of physiological distal movement of molars.
Occlusal hypofunction induced a significant amount of bone apposition at the most of the alveolar bone surface on buccal and palatal side, and consequently the PDL width was about a half of the control. Choi, et al. reported that the width of the PDL space in the rats at day-7, narrowed to less than half as compared to the control, and after that width of the PDL space was stably narrow [7]. Levy, et al. reported that alveolar bone formation was increased during 15 days after occlusal hypofunction, and after that bone formation was slight increased [3]. The results in this study indicate that occlusal hypofunction considerably increases the alveolar bone apposition, as compared with those in control group. This also causes the narrowing of the width of PDL.
TGF-βexpression and localization was observed in the PDL throughout the experimental period in the control and experimental groups, and the results were consistent with previous reports about TGF-βin the PDL [9,21,22]. TGF-βsuperfamily is known to play an important role in osteogenic cell differentiation and consequently bone formation in the PDL [9,19].
In this study the localization in the PDL in experimental group was somewhat different from that in control group. TGF-βwas located in the fibroblasts and osteoblasts in the PDL in control group. On the other hand, in the experimental group it was located in the fibroblast and osteoblast at day-1 but its localization in osteoblast on the bone surface was gradually reduced in the PDL. Previous studies reported that TGF-βregulated osteoblastic differentiation not only positively but also negatively in the PDL cells [10,23]. The expression of TGF-βmRNA continued to increase at confluent cell stage and decreased at mineralization stage in PDL cells [10]. In this context, the reduction of TGF-βin the osteoblast at the alveolar bone surface in experimental group might indicate that the osteoblast in this area has already differentiated into osteoblast and engaged in mineralization of bone in the rapid bone formation [24] in response to occlusal hypofunction.
We discovered that Asporin was downregulated in the PDL under occlusal hypofunction. Asporin is expressed predominantly in the PDL and negatively regulates the cytodifferentiation of PDL cells to osteoblast [11,13] and mineralization. It is known that Asporin binds directly with TGF-βand inhibits TGF-b/Smad signaling, resulting in the inhibition of bone formation [11,12]. Furthermore Asporin inhibits TGF-βsignaling without affecting TGF-βexpression [17]. Asporin overexpression suppressed the differentiation of rat bone marrow stromal cells into osteoblasts [25]. Awata, et al. reported that mouse embryonic fibroblasts from Asporin knockout mice were cultured in mineralization inducing medium, calcified nodule formation was more enhanced [26]. Orthodontic compressive force induces the expression and release of Asporin, which inhibits bone formation on the compressed zone of the PDL during orthodontic tooth movement [27]. Taken together, occlusal hypofunction reduces the expression of Asporin, which is advantageous for the cytodifferentiation PDL cells to osteoblasts through TGF-βsignaling in PDL. Consequently this causes the rapid bone formation in the PDL. However, it still remains unclear that the downregulatory mechanism for Asporin expression by occlusal hypofunction. Therefore, further experiments are necessary to elucidate the regulatory mechanism of Asporin expression under occlusal hypofunction.
The expression of Smad3 was significantly upregulated in the PDL and p-smad2/3 positive cell was evidently increased in the PDL under occlusal hypofunction. Smad3 is known as an intracellular signaling molecule for TGF-βsignaling [9,18,19]. Positive relation between Smad3 and osteoblastic differentiation was also reported [28]. Consisted with the reports, occlusal hypofunction induced osteoblastic differentiation in our experiments.
This is supported by the results that the expressions of BSP, Osteocalcin, and Osteopontin were upregulated in the PDL after occlusal hypofunction. BSP, Osteocalcin, and Osteopontin are osteoblast-specific proteins and have been used for osteoblastic differentiation marker [29-37]. Occlusal hypofunction evidently stimulate the differentiation of PDL cells to osteoblasts in the PDL. It is interesting in this study that BSP Osteocalcin and Osteopontin were located not only in osteoblast at alveolar bone surface, but also in the most of fibroblast, as compared to that in the control. These might indicate that the fibroblast in the PDL also contribute to the bone formation in the PDL under hypofunction.
As to the source of osteoblastic differentiated cells in PDL, we presumed that one of them are mesenchymal stem cell, because mesenchymal stem cells are present in the PDL and are able to differentiate into multiple types of cells by responding to the mechanical forces [38]. Another possibility is direct osteoblastic differentiation of PDL cells because many researchers reported that PDL cells can differentiate into mature osteoblasts by suitable stimulation [39-42].
In the present study, we demonstrated that occlusal hypofunction induced rapid alveolar bone apposition through advantage relative augmentation of TGF-βsignaling by decrease of Asporin production. Attenuation of Asporin expression would be therapeutic target for alveolar bone augmentation in periodontal disease on pharmacological retention after orthodontic treatment.
Disclosure
The authors have no conflicts of interest.
Acknowledgement
This research was supported in part by Grants-in-Aid for Scientific Research from the Japan Society for the Promotion of Science (23689081, 15K11376, 15K11356, and 23593052)
Contributions
Kanako Itohiya: study design, data collection, analysis, and writing. Hiroyuki Kanzaki: study design instruction, editing assistance. Misao Ishikawa: animal experiments design instruction. Satoshi Wada: immunohistochemical staining technique instruction. Yutaka Miyamoto: LCM technique instruction. Tsuyoshi Narimiya: data collection. Yoshiki Nakamura: editing assistance.
References
- Beertsen W, McCulloch CA, Sodek J (1997) The periodontal ligament: a unique, multifunctional connective tissue. Periodontol 13: 20-40. [Crossref]
- Johnson RB (1990) Effect of altered occlusal function on transseptal ligament and new bone thicknesses in the periodontium of the rat. Am J Anat 187: 91-97. [Crossref]
- Levy GG, Mailland ML (1980) Histologic study of the effects of occlusal hypofunction following antagonist tooth extraction in the rat. Journal of Periodontology. 51: 393-399. [Crossref]
- Cohn SA (1965) Disuse atrophy of the periodontium in mice. Arch Oral Biol 10: 909-919. [Crossref]
- Ramfjord SP, Kohler CA (1959) Periodontal reaction to functional occlusal stress. Journal of Periodontology 30: 95-112.
- Lee M, Nakamura Y (1999) A histological study on the periodontal ligament during the experimental movement of hypofunctional teeth in rats : On the tension side. Orthodontic waves: Journal of the Japanese Orthodontic Society 58: 416-427.
- Choi JW1, Arai C, Ishikawa M, Shimoda S, Nakamura Y (2011) Fiber system degradation, and periostin and connective tissue growth factor level reduction, in the periodontal ligament of teeth in the absence of masticatory load. J Periodontal Res 46: 513-521. [Crossref]
- Tran VP, Mailland M (1981) Short-term effects of occlusal hypofunction following antagonist tooth extraction upon periodontal tissues in the rat. Journal de biologie buccale 9: 385-400.
- Chen G, Deng C, Li YP (2012) TGF-β and BMP signaling in osteoblast differentiation and bone formation. Int J Biol Sci 8: 272-288. [Crossref]
- Chien HH, Lin WL, Cho MI (1999) Expression of TGF-beta isoforms and their receptors during mineralized nodule formation by rat periodontal ligament cells in vitro. J Periodontal Res 34: 301-309. [Crossref]
- Yamada S, Tomoeda M, Ozawa Y, Yoneda S, Terashima Y, et al. (2007) PLAP-1/asporin, a novel negative regulator of periodontal ligament mineralization. J Biol Chem 282: 23070-23080. [Crossref]
- Yamada S, Ozawa Y, Tomoeda M, Matoba R, Matsubara K, et al. (2006) Regulation of PLAP-1 expression in periodontal ligament cells. J Dent Res 85: 447-451. [Crossref]
- Yamada S, Murakami S, Matoba R, Ozawa Y, Yokokoji T, et al. (2001) Expression profile of active genes in human periodontal ligament and isolation of PLAP-1, a novel SLRP family gene. Gene 275: 279-286. [Crossref]
- Kawamoto T (2003) Use of a new adhesive film for the preparation of multi-purpose fresh-frozen sections from hard tissues, whole-animals, insects and plants. Archives of Histology and Cytology 66: 123-143. [Crossref]
- Nakamura Y, Tanaka T, Wakimoto Y, Noda K, Kuwahara Y (1994) Preparation of unfixed and undecalcified frozen sections of adult rat periodontal ligament during experimental tooth movement. Biotech Histochem 69: 186-191. [Crossref]
- Schneider CA, Rasband WS, Eliceiri KW (2012) NIH Image to ImageJ: 25 years of image analysis. Nat Methods 9: 671-675. [Crossref]
- Kizawa H, Kou I, Iida A, Sudo A, Miyamoto Y, et al. (2005) An aspartic acid repeat polymorphism in asporin inhibits chondrogenesis and increases susceptibility to osteoarthritis. Nat Genet 37: 138-144. [Crossref]
- Nakao A1, Imamura T, Souchelnytskyi S, Kawabata M, Ishisaki A, et al. (1997) TGF-beta receptor-mediated signalling through Smad2, Smad3 and Smad4. EMBO J 16: 5353-5362. [Crossref]
- Qi H, Aguiar DJ, Williams SM, La Pean A, Pan W, et al. (2003) Identification of genes responsible for osteoblast differentiation from human mesodermal progenitor cells. Proc Natl Acad Sci USA 100: 3305-3310.
- Roux D, Meunier C, Woda A (1993) A biometric analysis in the rat of the horizontal component of physiological tooth migration and its response to altered occlusal function. Arch Oral Biol 38: 957-963. [Crossref]
- Gao J, Symons AL, Bartold PM (1998) Expression of transforming growth factor-beta 1 (TGF-beta1) in the developing periodontium of rats. J Dent Res 77: 1708-1716. [Crossref]
- Fujii S, Maeda H, Tomokiyo A, Monnouchi S, Hori K, et al. (2010) Effects of TGF-β on the proliferation and differentiation of human periodontal ligament cells and a human periodontal ligament stem/progenitor cell line. Cell Tissue Res 342: 233-242. [Crossref]
- Lieb E, Vogel T, Milz S, Dauner M, Schulz MB (2004) Effects of transforming growth factor beta1 on bonelike tissue formation in three-dimensional cell culture. II: Osteoblastic differentiation. Tissue Engineering 10: 1414-1425. [Crossref]
- Aghaloo TL, Chaichanasakul T, Bezouglaia O, Kang B, Franco R, et al. (2010) Osteogenic potential of mandibular vs. long-bone marrow stromal cells. J Dent Res 89: 1293-1298. [Crossref]
- Sun J, Zhang T, Zhang P, Lv L, Wang Y, et al. (2014) Overexpression of the PLAP-1 gene inhibits the differentiation of BMSCs into osteoblast-like cells. J Mol Histol 45: 599-608. [Crossref]
- Awata T, Yamada S, Tsushima K, Sakashita H, Yamaba S, et al. (2015) PLAP-1/Asporin Positively Regulates FGF-2 Activity. J Dent Res 94: 1417-1424. [Crossref]
- Ueda M, Goto T, Kuroishi KN, Gunjigake KK, Ikeda E, et al. (2016) Asporin in compressed periodontal ligament cells inhibits bone formation. Arch Oral Biol 62: 86-92. [Crossref]
- Borton AJ, Frederick JP, Datto MB, Wang XF, Weinstein RS (2001) The loss of Smad3 results in a lower rate of bone formation and osteopenia through dysregulation of osteoblast differentiation and apoptosis. J Bone Miner Res 16: 1754-1764. [Crossref]
- Fisher LW, Whitson SW, Avioli LV, Termine JD (1983) Matrix sialoprotein of developing bone. J Biol Chem 258: 12723-12727. [Crossref]
- Lee NK, Sowa H, Hinoi E, Ferron M, Ahn JD, et al. (2007) Endocrine regulation of energy metabolism by the skeleton. Cell 130: 456-469. [Crossref]
- Ljunghall S, Lindh E (1989) Assessment of bone turnover with biochemical markers. J Intern Med 225: 219-220. [Crossref]
- Oldberg A, Franzén A, Heinegard D (1986) Cloning and sequence analysis of rat bone sialoprotein (osteopontin) cDNA reveals an Arg-Gly-Asp cell-binding sequence. Proc Natl Acad Sci U S A 83: 8819-8823. [Crossref]
- Macneil RL, Sheng N, Strayhorn C, Fisher LW, Somerman MJ (1994) Bone sialoprotein is localized to the root surface during cementogenesis. J Bone Miner Res 9: 1597-1606. [Crossref]
- Chen J, Shapiro HS, Sodek J (1992) Development expression of bone sialoprotein mRNA in rat mineralized connective tissues. J Bone Miner Res 7: 987-997. [Crossref]
- Li H, Bartold PM, Young WG, Xiao Y, Waters MJ (2001) Growth hormone induces bone morphogenetic proteins and bone-related proteins in the developing rat periodontium. J Bone Miner Res 16: 1068-1076. [Crossref]
- Ninomiya T, Hiraga T, Hosoya A, Ohnuma K, Ito Y, et al. (2014) Enhanced bone-forming activity of side population cells in the periodontal ligament. Cell Transplant 23: 691-701. [Crossref]
- Wongkhantee S, Yongchaitrakul T, Pavasant P (2007) Mechanical stress induces osteopontin expression in human periodontal ligament cells through rho kinase. Journal of Periodontology 78: 1113-1119. [Crossref]
- Lekic P, McCulloch CA (1996) Periodontal ligament cell population: the central role of fibroblasts in creating a unique tissue. Anat Rec 245: 327-341. [Crossref]
- Yeasmin S, Ceccarelli J, Vigen M, Carrion B, Putnam AJ, et al. (2014) Stem cells derived from tooth periodontal ligament enhance functional angiogenesis by endothelial cells. Tissue Eng 20: 1188-1196. [Crossref]
- Hakki SS, Bozkurt B, Hakki EE, Kayis SA, Turac G, et al. (2014) Bone morphogenetic protein-2, -6, and -7 differently regulate osteogenic differentiation of human periodontal ligament stem cells. Journal of Biomedical Materials Research Part B, Applied Biomaterials 102: 119-130.
- Monnouchi S, Maeda H, Yuda A, Hamano S, Wada N, et al. (2015) Mechanical induction of interleukin-11 regulates osteoblastic/cementoblastic differentiation of human periodontal ligament stem/progenitor cells. J Periodontal Res 50: 231-239. [Crossref]
- Kato H, Taguchi Y, Tominaga K, Kimura D, Yamawaki I, et al. (2016) High glucose concentrations suppress the proliferation of human periodontal ligament stem cells and their differentiation into osteoblasts. J Periodontol 87: e44-51. [Crossref]