Abstract
In this paper, the gene sequences involved in Coronary Artery Disease (CAD) were analyzed by fractal analysis. In order to obtain a quantitative characterization of nucleotide patterns and to identify anomalies and singularities belonging to genes, the fractal dimension (FD) and lacunarity were studied as fractal parameters. To obtain accurateparametric values, the Binary Image Indicator Matrix (BIIM) was used. This method converts uni-dimensional sequences into 2- D images preserving the autocorrelation.
The results show like the fractal values of genes CAD are very similar to the random sequences. In particular, all FD values fall in the range 1.20 - 1.22 highlighting that the complexity/fractality is the same and suggesting that all genes equally contribute to the pathogenesis of atherosclerosis from statistical point a view. These results are in accordance with the biological studies that indicate CAD as a multi-factorial process, so that these values could be considered as characteristics for these genes.
Key words
atherosclerosis, binary image indicator matrix, fractal dimension, lacunarity
Introduction
In this work, 60 genes involved in atherosclerosis process are studied in order to investigate a possible rule that relationship the gene sequences anomalies with possible complexity/fractal nature of the distribution of nucleotides. Thus, we are assuming that biological activity of bio-system could be correlate with fractal proprieties. Starting from this assumption, we could detect the physiological state from not physiological state by fractal values. In recent past, several studies were focused on the DNA complexity and on the complexity of some important diseases such as tumors, neurodegenerative and multi-factorial pathologies [1-4].
Some authors suggest that the fractality and complexity are involved in the degeneration of biological system that lead to origin of pathologies, for example the structural changes in the morphology of cells and tissues could cause the shift from a healthy to a pathological state, but this idea is still under investigation [5-9].So that seems to be a link between fractal nature and biological function and the FD and lacunarity could be consider as parametric markers of these changes.
In order to identify the characteristics values of FD and lacunarity, a fractal analysis on gene sequences belonging to atherosclerosis was conducted and the results were compared with random sequences. The apparently random distribution is considered as sign of complexity of DNA and in recent papers the existence of a fractal organizationin some diseases was investigated [10,11]. The mean idea consider the biological activity correlated with fractal proprieties [12-15] and in particular, the normal and altered states could be identified by fractal values.
Atherosclerosis
The atherosclerosis is one of the most common chronic non-infectious unhealthy condition and can be considered as one of the main factor responsible for the development of coronary artery disease. Atherosclerosis is followed by the over-thickness of the arterial wall as the result of many factors, some of them include deposition of oxidized Low Density Lipoprotein (LDL) and cholesterol and shear stress of the wall induced by high blood pressure. Many diseases such as diabetes mellitus, or the unhealthy lifestyle and nutrition may speed up the process of atherosclerosis. The evolution of atherosclerosis and CAD is thought to have genetic basis. From physiological point of view, population-based epidemiological studies have confirmed that there isnot a single gene that can be considered as the main responsible for CAD pathogenesis. CAD is rather a multi-factorial disease so that multiple genes, located on various chromosomes, are proposed to havea role in its patho-physiology. Recently, many efforts have been made to identify these CAD-related genes and to design an adequate database for future research. Although today much is known about the location and structure of these genetic sequences, many aspects related to their biophysical properties still remain unknown [16-18].
BIIM method
The fractal values of CAD’s genes have been obtained by BIIM method. This method allows the display of the nucleotide patterns in 2 dimensions with preservation of autocorrelation between symbols of sequence [19]. In this studies we have considered only 4 symbols, in particular Adenine (A), Cytosine (C), Thymine (T) and Guanine (G) that form the DNA sequences.
The BIIM method was usually used in the studies on alignment of proteins and sequences of DNA, to evaluate the degree of homology between biological sequences and for the analysis of DNA regions [20-23]. In this paper, the BIIM was used to convert uni- dimensional symbolic sequences (such as DNA sequences) in 2-D images and to compute the FD and lacunarity. This method allows to visualize a typical patterns of nucleotide that looks like a fractal arrangement such as demonstrated by Cattani in recent works and in the study of complexity of Caenorhabditis elegans [2,19,24-26].
Fractal
According to the most popular definition, we can consider a fractal as a geometric object that is characterized by the self-similarity, with its structure cyclically nested at different scales. In particular, the fractal is characterized from at least four properties: self-similarity, fine structure, irregularities and non-integer dimension. The fractal dimension is a parameter used to describe the degree of disorder within the object. In addition, this value is the measure of information contained in the sequence, so that the higher value corresponds to a higher information content [27,28].
Lacunarity
The lacunarity is a parameter which describes the gaps present within a structure or fractal object and in general the high lacunarity means a texture with many gaps (heterogeneous distribution), instead the low lacunarity corresponds to a texture with few gaps (homogeneous distribution) [29]. In the recent past, the analysis of lacunarity was applied on medical images and in particular in the studies of pathological and normal tissue [30,31].
FD and lacunarity correlation
As a statistical parameter to verify the relation between FD and lacunarity, the Pearson product moment correlation coefficient was used.
Materials & Methods
Materials
A representative number of genes sequences of Coronary Artery Disease Gene Database (CADGD)has been taken in account [32,33]. Indetail, we have selected 60 genes thatare shown in table 1. In particular, we have 12 different categories: Vascular smooth muscle cell abnormalities, rennin –angiotensin system, oxidation-reduction state, lipid and lipoprotein metabolism, endothelial integrity, immune and inflammation, gender difference, glucose metabolism, thrombosis, homocysteine metabolism, metalloproteinase - ECM and others generic genes involved in CAD.
The 60 genes are divided into 12 categories according to CAD database as follows:
|
Category
|
Gene ID
|
Symbol Gene
|
Length bp
|
Category
|
Gene ID
|
Symbol Gene
|
Length bp
|
|
Vasc. Smooth. Mus.
|
84159
|
ARID5B
|
195696
|
Gender difference
|
367
|
AR
|
186589
|
|
|
339479
|
FAM5C
|
379964
|
|
1586
|
CYP17A1
|
7004
|
|
|
3456
|
IFNB1
|
841
|
|
1588
|
CYP19A1
|
130543
|
|
|
4045
|
LSAMP
|
643177
|
|
2099
|
ESR1
|
412780
|
|
|
9927
|
MFN2
|
33336
|
|
2100
|
ESR2
|
111519
|
|
Renin-angiot.system
|
118
|
ADD1
|
86221
|
Glucose metabolism
|
3938
|
LCT
|
49337
|
|
|
4878
|
NPPA
|
2076
|
|
11132
|
CAPN10
|
12395
|
|
|
1636
|
ACE
|
21321
|
|
2645
|
GCK
|
45154
|
|
|
185
|
AGTR1
|
45134
|
|
231
|
AKR1B1
|
16783
|
|
|
133
|
ADM
|
2283
|
|
387082
|
SUM04
|
689
|
|
Ox-Red. state
|
84735
|
CNDP1
|
50571
|
Thrombosis
|
7450
|
VWF
|
175798
|
|
|
5444
|
PON1
|
26217
|
|
5175
|
PECAM1
|
8083
|
|
|
6648
|
SOD2
|
14207
|
|
2149
|
F2R
|
19729
|
|
|
2730
|
GCLM
|
22424
|
|
2266
|
FGG
|
8618
|
|
|
23564
|
DDAH2
|
3224
|
|
3690
|
ITGB3
|
58871
|
|
Lipid-LipoMetab.
|
5465
|
PPARA
|
93156
|
Homocyst. Metab.
|
875
|
CBS
|
23171
|
|
|
350
|
APOH
|
17411
|
|
249
|
ALPL
|
69049
|
|
|
1581
|
CYP7A1
|
9985
|
|
2524
|
FUT2
|
9965
|
|
|
6720
|
SREBF1
|
25664
|
|
4524
|
MTHFR
|
20375
|
|
|
126
|
ADH1C
|
16270
|
|
4507
|
MTAP
|
63337
|
|
Endothelial integrity
|
4205
|
MEF2A
|
150499
|
Metalloprot. ECM
|
7077
|
TIMP2
|
72415
|
|
|
1573
|
CYP2J2
|
33445
|
|
7078
|
TIMP3
|
62228
|
|
|
3082
|
HGF
|
68010
|
|
1471
|
CST3
|
4282
|
|
|
5328
|
PLAU
|
6398
|
|
4314
|
MMP3
|
7816
|
|
|
7035
|
TFPI
|
90264
|
|
4313
|
MMP2
|
27507
|
|
Imm. Inflamm.
|
4790
|
NFKB1
|
115975
|
Others genes
|
2247
|
FGF2
|
71529
|
|
|
4048
|
LTA4H
|
42769
|
|
54658
|
UGT1A1
|
13028
|
|
|
8600
|
TNFSF11
|
45279
|
|
6546
|
SLC8A1
|
400291
|
|
|
10135
|
NAMPT
|
36909
|
|
10268
|
RAMP3
|
26484
|
|
|
6868
|
ADAM17
|
66527
|
|
3791
|
KDR
|
47338
|
| |
|
|
|
|
|
|
|
|
Table 1. Genes.
Methods
The method consist in the computation of fractal dimension and lacunarity by BIIM. In particular,this method converts the un- dimensional sequences in 2-D imageswhereby is possible to compute the fractal parameters. Concerning the parameters, we should notice that all sequences have different lengths in bp and so that in order to make some reasonable comparisons, we havedivided the gene sequences in parts of 500 bp in length. The results shown in table 2 are the meanof values on 500 bp.
Fractal Dimension on correlation matrix
Fractal dimension iscomputed on the BIIM (correlation matrix) [13,19,20] as follows:
Let
be the finite alphabet of nucleotides and any member of the 4 symbols alphabet and let
 be two N-length DNA sequences, the indicator functionis the map[34]:
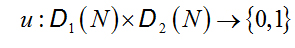 (2.1)
(2.1)
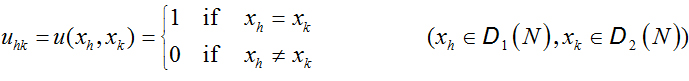
such that the indicator (correlation) matrix:
 (2.2)
(2.2)
is a matrix of 0’s and 1’s showing the existence of correlation.
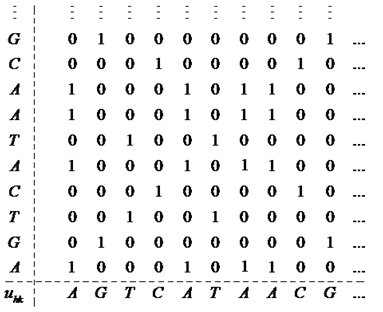
When the sequences are the same, the indicator function shows the existence of autocorrelation on the sequence. The indicator matrix can be used to obtain the binary image of DNA as a two dimensional dot-plot, which can be used to visualize some correlations between the two sequences [13]. It can be easily drawn by assigning a black dot to 1 and a white dot to 0 [19,20] (Figure 1).
 (2.2)
(2.2)
Figure 1.Indicator Matrix for a given sequence of nucleotides.
So that the value of fractal dimension is given by
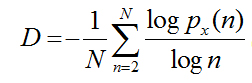 (2.3)
(2.3)
Lacunarity on correlation matrix.
Let Sn be a given N-length DNA sequence and v*hk (h=1,...N; k=1,...4) be the 4 sequences of the Voss indicator map. On each indicator sequence, for the h-th nucleotide, we can consider a gliding box of r-length, so that
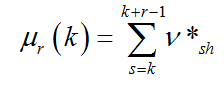 (2.4)
(2.4)
is the frequency of “1” within the box. The corresponding probability is
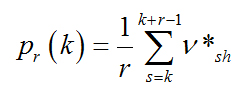 (2.5)
(2.5)
In two dimensions a natural generalization of the lacunarity will be computed as follows: let uhk(h,k=1,….N) be the indicator matrix which gives rise to the binary image of DNA, the lacunarity is defined as a function of the square side, by the ratioof the second and first moment of the distribution.
 (2.6)
(2.6)
Pearson product moment correlation coefficient
The Pearson product moment correlation coefficient is a statistical method used to describe the correlation between two or more data sets [35]. In particular, the coefficient value falls into the range [-1; 1], in particular (-1) for negative correlation, (+1) for positive correlation and (0) for no correlation.
Results
Fractal and Lacunarity values
In the following Table 2 the mean values with standard deviation of fractal dimension and lacunarity are given.
|
Symbol Gene
|
Fractal Value
|
Lacunarity Value
|
Symbol Gene
|
Fractal Value
|
Lacunarity Value
|
|
ARID5B
|
1,219 ± 0,002
|
0,00248 ± 0,001
|
AR
|
1,218 ± 0,002
|
0,002308 ± 0,003
|
|
FAM5C
|
1,216 ± 0,0004
|
0,00166 ± 0,001
|
CYP17A1
|
1,220 ± 0,0005
|
0,000166 ± 0,0001
|
|
IFNB1
|
1,220 ± 0,0001
|
0,00019± 0,0002
|
CYP19A1
|
1,220 ± 0,0003
|
0,001178 ± 0,001
|
|
LSAMP
|
1,219 ±0,0009
|
0,00337 ± 0,002
|
ESR1
|
1,218 ± 0,0006
|
0,00008 ± 0,0001
|
|
MFN2
|
1,216 ± 0,003
|
0,00018± 0,0002
|
ESR2
|
1,219 ± 0,001
|
0,00204 ± 0,002
|
|
ADD1
|
1,215± 0,008
|
0,00657± 0,006
|
LCT
|
1,220 ± 0,0002
|
0,00039 ± 0,0003
|
|
NPPA
|
1,220± 0,0006
|
0,00126 ± 0,001
|
CAPN10
|
1,216 ± 0,002
|
0,001188 ± 0,001
|
|
ACE
|
1,217± 0,004
|
0,00084 ± 0,0007
|
GCK
|
1,218 ± 0,001
|
0,00059 ± 0,0008
|
|
AGTR1
|
1,218± 0,001
|
0,00033± 0,0003
|
AKR1B1
|
1,218 ± 0,003
|
0,002308 ± 0,001
|
|
ADM
|
1,218± 0,001
|
0,00031± 0,0002
|
SUM04
|
1,220 ± 0,0003
|
0,000308 ± 0,0002
|
|
CNDP1
|
1,218 ± 0,003
|
0,00006 ± 0,00008
|
VWF
|
1,217± 0,004
|
0,005522 ± 0,004
|
|
PON1
|
1,219 ± 0,001
|
0,00033 ± 0,0003
|
PECAM1
|
1,220 ± 0,0002
|
0,001404 ± 0,001
|
|
SOD2
|
1,217 ± 0,003
|
0,00061 ± 0,0007
|
F2R
|
1,218 ± 0,002
|
0,00070 ± 0,0006
|
|
GCLM
|
1,215 ± 0,004
|
0,00008 ± 0,0001
|
FGG
|
1,216 ± 0,003
|
0,000167 ± 0,0002
|
|
DDAH2
|
1,218 ± 0,001
|
0,002351 ± 0,002
|
ITGB3
|
1,217 ± 0,005
|
0,00280 ± 0,003
|
|
PPARA
|
1,216± 0,007
|
0,001247 ± 0,001
|
CBS
|
1,217 ± 0,004
|
0,00067 ± 0,0007
|
|
APOH
|
1,220± 0,0005
|
0,00060± 0,0006
|
ALPL
|
1,218 ± 0,004
|
0,00519 ± 0,005
|
|
CYP7A1
|
1,218± 0,002
|
0,002124± 0,002
|
FUT2
|
1,217 ± 0,002
|
0,00023 ± 0,0002
|
|
SREBF1
|
1,217± 0,003
|
0,00150 ± 0,001
|
MTHFR
|
1,218 ± 0,002
|
0,000204 ± 0,0002
|
|
ADH1C
|
1,215± 0,002
|
0,00116± 0,001
|
MTAP
|
1,219 ± 0,002
|
0,001252 ± 0,001
|
|
MEF2A
|
1,214± 0,006
|
0,00006±0,00006
|
TIMP2
|
1,215 ± 0,006
|
0,000987 ±0,0008
|
|
CYP2J2
|
1,219± 0,0009
|
0,00063± 0,0008
|
TIMP3
|
1,220 ± 0,0005
|
0,000976 ± 0,001
|
|
HGF
|
1,217± 0,001
|
0,00026± 0,0002
|
CST3
|
1,217 ± 0,004
|
0,00082 ± 0,001
|
|
PLAU
|
1,217± 0,004
|
0,00057± 0,0007
|
MMP3
|
1,218 ± 0,002
|
0,00032 ± 0,0004
|
|
TFPI
|
1,217± 0,002
|
0,000132 ± 0,0001
|
MMP2
|
1,217 ± 0,002
|
0,00074 ± 0,0008
|
|
NFKB1
|
1,216 ± 0,005
|
0,001497 ± 0,001
|
FGF2
|
1,215 ± 0,006
|
0,002090 ± 0,001
|
|
LTA4H
|
1,219 ± 0,002
|
0,00063 ± 0,0004
|
UGT1A1
|
1,220 ± 0,0001
|
0,000705 ± 0,0009
|
|
TNFSF11
|
1,219 ± 0,0008
|
0,00036 ± 0,0004
|
SLC8A1
|
1,219 ± 0,001
|
0,000445 ± 0,0003
|
|
NAMPT
|
1,216 ± 0,003
|
0,00406 ± 0,005
|
RAMP3
|
1,217 ± 0,003
|
0,001580 ± 0,001
|
|
ADAM17
|
1,218 ± 0,0009
|
0,00071 ± 0,0009
|
KDR
|
1,218 ± 0,0005
|
0,000671 ± 0,0008
|
|
#Random 1
|
1,215 ± 0,002
|
0,00401± 0,0053
|
#Random 11
|
1,219± 0,0008
|
0,00101 ± 0,0008
|
|
#Random 2
|
1,214 ± 0,001
|
0,00064 ± 0,0006
|
#Random 12
|
1,214± 0,0008
|
0,000844 ± 0,0007
|
|
#Random 3
|
1.213 ± 0,001
|
0,00267 ± 0,003
|
#Random 13
|
1,216± 0,0002
|
0,00041 ± 0,0004
|
|
#Random 4
|
1,220 ± 0,0001
|
0,00065 ± 0,0006
|
#Random 14
|
1,197± 0,001
|
0,00717 ± 0,008
|
|
#Random 5
|
1,215 ± 0,002
|
0,00023 ± 0,0002
|
#Random 15
|
1,216 ± 0,0007
|
0,00105 ± 0,0009
|
|
#Random 6
|
1,210 ± 0,001
|
0,00072 ± 0,0007
|
#Random 16
|
1,213 ± 0,0006
|
0,00052 ± 0,0004
|
|
#Random 7
|
1,211 ± 0,001
|
0,00965± 0,009
|
#Random 17
|
1,217 ± 0,001
|
0,00235 ± 0,002
|
|
#Random 8
|
1,218 ± 0,0004
|
0,000235 ± 0,0003
|
#Random 18
|
1,235 ± 0,001
|
0,00363 ± 0,003
|
|
#Random 9
|
1,203 ± 0,006
|
0,00584 ± 0,0076
|
#Random 19
|
1,218 ± 0,001
|
0,00363 ± 0,003
|
|
#Random 10
|
1,217 ± 0,0003
|
0,00088 ± 0,001
|
#Random 20
|
1,219 ± 0,0004
|
0,00023 ± 0,0002
|
Table 2. Fractal dimension and lacunarity values of genes.
In table 2 are shown the higher (in yellow) and the lower (in red) values for gene and random sequences. For CAD’s genes, the FDvaluesfallinto the range1.20 to 1.22. The values of random sequences fall into the range 1.19 to 1.23 and this result suggest us that FD values for genes are very close to random.
For the lacunarity, the range of values between the higher (0.0065) and the lower (0.00019) is very small (referred to gene sequences). Similar result was obtained for the random sequences. In detail, the higher value is shown for the random sequence number 7 and the lower value belongs to the random sequence number 13. Also in this case, the difference of values is very low (0.00924).
2021 Copyright OAT. All rights reserv
Some notes on genes with extreme values are shown as follow:
PPARA (peroxisome proliferator- activated receptor alpha) encodes for PPARA protein involved in lipid metabolism. It is situated between 46,546,424 bp and 46,639,653 bp on chromosome 22. The main pathologies associated for PPARA are: hyperapobetalipoproteinemia and tularemia [36].
MEF2A (myocyte enhancer factor 2A) encodes for a protein involved in most important cellular processes such as muscle development, neuronal differentiation, cell growth control and apoptosis. This gene belongs to chromosome 15 and it is localized between 100,017,370 bp and 100,256,671 bp. The coronary artery disease and in particular the autosomal dominant 1 typeare associated to MEF2A gene dysfunction [36].
IFNB1 (interferon beta 1fibroblast) encodes to interferon beta protein. This protein has multiple activities as: antiviral, anticancer and antibacterial. This gene is positioned on chromosome 9 in particular between 21,077,104 bp and 21,077,943bp. A oral erosive lichen and cerebral primitive neuroectodermal tumor are associated with IFNB1 dysfunction[36].
ADD1 (adducing 1 alpha) encodes for a cytoskeleton protein (adducin alpha) that acts binding to calmodulin. The gene is situated on chromosome 4 and in particular between 2,845,584 bp and 2,931,803 bp. The main disease associated to ADD1 is hypertension in particular the type salt- sensitive [36].
Statistical analysis
The Pearson product moment correlation coefficient is: -0,376 showing a negative correlation between FD and lacunarity.
Discussion
In recent past, the interest for efficient diagnosis and prognosis of tumors, inflammation of tissues, multi- factorial and degenerative disorders is increased.In order to better diagnosis many biological methods andcomputational tools have been used. In the last period these analytical methods were also supported by mathematical and statistical methods, because it is thought that behind the organization of cells, tissues and nucleotide distribution, seem to be some types of recurrences as fractals [37-40]. Concerning this conjecture, some authors have discussed the possibility to distinguish the physiological state from pathological state by fractal/ complexity values that biological systems assume when mutate their physiological conditions [41-44]. Thus, the idea that fractality is a valuable tool that allows to discriminate altered and normal states, it has been previously noticed in some diseases [45-47]. Therefore, the complexity and fractal nature seem to be involved in degeneration of biological system and the authors are searching by mathematical and statistical methods to better understanding the main features of bio- systems [48-50].
In this work, the multi-fractality, as an indicator of the degree of disorder/heterogeneity of the system, has been considered in the statistical study of atherosclerosis by parameters of FD and lacunarity (inversely related).
In order to find some singularities that enable us to characterized the nucleotide patterns within the gene sequences, the values of FD and lacunarity were achieved by BIIM. In the past, this method was applied for the alignments of nucleotide sequences, analysis of different regions of DNA [14-17], while in this paperit was used to obtain fractal values.
In particular, the findings shown that all mean values tend to be very close both FD than lacunarity. The results lead to consider these values as characteristics for CAD’s genes. To verify the correlation as well as the reliability of two parameters, the Pearson product moment correlation coefficient was applied. According to the negative correlation, if the value ofFDis high,it is expected that the value of lacunarity is low and vice-versa. The statistical hypothesis is that exists a negative correlation between FD and lacunarity. The analysis shows that between the two parameters there is a negative value (-0,376) and this means that two parameters can be assumed as reliable from statistical point of view.
The statistical study has shown that no genes seems to play a leading role in atherosclerosis and all genes considered seem to have the same fractal characteristics. This result, from a biological point a view, lead to assume that the genes have similar function in the origin of atherosclerosis confirming a multi-factorial nature of pathology.
Conclusion
In this paper, the FD and lacunarity values of CAD’s genes and those of random sequences were calculated by BIIM. The analysis of fractal dimension and lacunarity showed values much similar between all sequences. In particular, the values of FD for all gene sequences fall in the range1.20 to 1.22, while the difference of values for lacunarity is only (0.00638). These results suggest that all the genes are involved equally in pathogenesis of CAD confirming the multi- factorial nature of pathology from biological point a view. Therefore, the values could be assumed as characteristics for CAD’s genes and easily calculated by BIIM method. From statistical point a view, these results show that is also possible to conjecture a distribution of nucleotide very similar to a random distribution.
Conflict of Interests
The author declare that there is no conflict of interests regarding the publication of this paper.
References
- West BJ (2013) “Fractal Physiology and Chaos in Medicine”, World Scientific, Vol 16 , 2nd edition.
- Cattani C, Pierro G (2011) “Complexity on Acute Myeloid Leukemia mRNA Transcript Variant”. Mathematical Problems in Engineering: 1–16.
- Sturmberg JP, West BJ (2013) “Fractals in physiology and Medicine”, Handbook for Systems and Complexity in Health, 171-192.
- Sokunbi MO, Gradin VB, Waiter GD, Cameron GG, Ahearn TS, et al. (2014) Nonlinear complexity analysis of brain FMRI signals in schizophrenia. PLoS One 9: e95146. [Crossref]
- Cross SS (1997) Fractals in pathology. J Pathol 182: 1-8. [Crossref]
- Karperien A, Ahammer H, Jelinek HF (2013) Quantitating the subtleties of microglial morphology with fractal analysis. Front Cell Neurosci 7: 3. [Crossref]
- Esteban FJ, Sepulcre J, de Mendizábal NV, Goñi J, Navas J, et al. (2007) Fractal dimension and white matter changes in multiple sclerosis. Neuroimage 36: 543-549. [Crossref]
- Delides A, Panayiotides I, Alegakis A, Kyroudi A, Banis C, et al. (2005) Fractal dimension as a prognostic factor for laryngeal carcinoma. Anticancer Res 25: 2141-2144. [Crossref]
- D'Anselmi F, Valerio M, Cucina A, Galli L, Proietti S, et al. (2011) Metabolism and cell shape in cancer: a fractal analysis. Int J Biochem Cell Biol 43: 1052-1058. [Crossref]
- Badea AF, Platon ML, Crisan M, Cattani C, Badea I, et al. (2013) “Fractal Analysis of Elastographic Images for Automatic Detection of Diffuse Diseases of Salivary Glands: Preliminary Results”. Comput Math Methods Med.
- Pantic I, Harhaji-Trajkovic L, Pantovic A, Milosevic NT, Trajkovic V (2012) Changes in fractal dimension and lacunarity as early markers of UV-induced apoptosis. J Theor Biol 303: 87-92. [Crossref]
- Talu S (2012) “Mathematical methods used in monofractal and multifractal analysis for processing of biological and medical data and images”. Animal Biology & Animal Husbrandry 4: 1-4.
- Losa GA (2002) Fractal morphometry of cell complexity. Riv Biol 95: 239-258. [Crossref]
- Anh V, Zhi-Min G,Shun-Chao L (2002) “Fractals in DNA sequence analysis”. Chinese Phys 11: 1313–1318.
- Gilmore S, Hofmann-Wellenhof R, Muir J, Soyer HP (2009) Lacunarity analysis: a promising method for the automated assessment of melanocytic naevi and melanoma. PLoS One 4: e7449. [Crossref]
- Hammoud RA, Vaccari CS, Nagamia SH, Khan BV (2007) Regulation of the renin-angiotensin system in coronary atherosclerosis: a review of the literature. Vasc Health Risk Manag 3: 937-945. [Crossref]
- Rivard A, Andrés V (2000) Vascular smooth muscle cell proliferation in the pathogenesis of atherosclerotic cardiovascular diseases. Histol Histopathol 15: 557-571. [Crossref]
- Stocker R, Keaney JF Jr (2004) Role of oxidative modifications in atherosclerosis. Physiol Rev 84: 1381-1478. [Crossref]
- Cattani C, Pierro G (2013) On the fractal geometry of DNA by the binary image analysis. Bull Math Biol 75: 1544-1570. [Crossref]
- Pustell J, Kafatos FC (1982) A high speed, high capacity homology matrix: zooming through SV40 and polyoma. Nucleic Acids Res 10: 4765-4782. [Crossref]
- Marck C (1986) “Fast analysis of DNA and protein sequence on AppleIIe: restriction sites search, alignment of short sequence and dot matrix analysis”. Nucleic Acids Res 14: 583-590. [Crossref]
- Sonnhamme EL, Durbin R, (1995) “A dot- matrix program with dynamic threshold control suited for genomic DNA and protein sequence analysis”. Gene 167: 1-10. [Crossref]
- Huang Y, Zhang L (2004) Rapid and sensitive dot-matrix methods for genome analysis. Bioinformatics 20: 460-466. [Crossref]
- Pierro G (2012) Sequence Complexity of Chromosome 3 in Caenorhabditis elegans. Adv Bioinformatics: 287486. [Crossref]
- Cattani C (2010) “Fractals and hidden symmetries in DNA”. Mathematical Problems in Engineering 2010: 1-31.
- Cattani C (2012) On the existence of wavelet symmetries in archaea DNA. Comput Math Methods Med: 673934. [Crossref]
- Falconer K (2014) “Fractal Geometry: mathematical foundations and application ”, Wiley, 3rd edition.
- West BJ, Bologna M, Grigolini P (2003) ”Physics of Fractal Operators”, Springer, illustrated edition.
- Allain C, Cloitre M (1991) Characterizing the lacunarity of random and deterministic fractal sets. Phys Rev A 44: 3552-3558. [Crossref]
- Pantic I, Nesic D, Stevanovic D, Starcevic V, Pantic S, et al. (2013) Effects of ghrelin on the structural complexity of exocrine pancreas tissue architecture. Microsc Microanal 19: 553-558. [Crossref]
- Neves LA, Nascimento MZ, Oliveira DLL, Martins AS, Godoy MF, et al. (2014) “Multi-scale lacunarity as an alternative to quantify and diagnose the behavior of prostate cancer”. Expert System with Applications 41: 5017-5029.
- Liu H, Liu W, Liao Y, Cheng L, Liu Q, et al. (2011) CADgene: a comprehensive database for coronary artery disease genes. Nucleic Acids Res 39: D991-996. [Crossref]
- www.BIOGUO.org/CAD.
- Voss RF (1992) Evolution of long-range fractal correlations and 1/f noise in DNA base sequences. Phys Rev Lett 68: 3805-3808. [Crossref]
- Pantic I, Paunovic J, Perovic M, Cattani C, Pantic S, et al. (2013), “Time- dependent reduction of structural complexity of the buccal epithelial cell nuclei after treatment with silver nanoparticles”, Journal of Microscopy 252: 286-294. [Crossref]
- www.GENECARDS.org
- Mandelbrot B (1983) The Fractal Geometry of Nature. Freeman, San Francisco.
- McNally JG, Mazza D (2010) Fractal geometry in the nucleus. EMBO J 29: 2-3. [Crossref]
- Perez JC (2010) Codon populations in single-stranded whole human genome DNA Are fractal and fine-tuned by the Golden Ratio 1.618. Interdiscip Sci 2: 228-240. [Crossref]
- Losa G (2014), ”On the Fractal Design in Human Brain and Nervous Tissue”. Applied Mathematics 5: 1725-1732. [Crossref]
- Reishofer G, Koschutnig K, Enzinger C, Ebner F, Ahammer H (2012) Fractal dimension and vessel complexity in patients with cerebral arteriovenous malformations. PLoS One 7: e41148. [Crossref]
- Rajagopalan V, Liu Z, Allexandre D, Zhang L, Wang XF, et al. (2013) Brain white matter shape changes in amyotrophic lateral sclerosis (ALS): a fractal dimension study. PLoS One 8: e73614. [Crossref]
- Savage VM, Herman AB, West JB, Leu K, (2013) ”Using Fractal Geometry and Universal Growth Curves as Diagnostics for Comparing Tumor Vasculature and Metabolic Rate With Healthy Tissue and for Predicting Responses to Drug Therapies”. Discrete Continuous Dyn Syst Ser B 18. [Crossref]
- de Arruda PF, Gatti M, Facio FN Jr, de Arruda JG, Moreira RD, et al. (2013) Quantification of fractal dimension and Shannon's entropy in histological diagnosis of prostate cancer. BMC Clin Pathol 13: 6. [Crossref]
- Losa GA (2012) “Fractals and their contribution to biology and medicine”. Medicographia 34: 365-374.
- Vasilescu C, Giza DE, Petrisor P, Dobrescu R, Popescu I, et al. (2012) Morphometrical differences between resectable and non-resectable pancreatic cancer: a fractal analysis. Hepatogastroenterology 59: 284-288. [Crossref]
- Fiz JA, Monte-Moreno E, Andreo F, Auteri SJ, Sanz-Santos J, et al. (2014) Fractal dimension analysis of malignant and benign endobronchial ultrasound nodes. BMC Med Imaging 14: 22. [Crossref]
- Newman MEJ (2011) “Complex System: A Survey”. Am J Phys 79: 800-810.
- Pantic I, Paunovic J, Basta-Jovanovic G, Perovic M, Pantic S, et al. (2013) Age-related reduction of structural complexity in spleen hematopoietic tissue architecture in mice. Exp Gerontol 48: 926-932. [Crossref]
- Dhar PK, Giuliani A (2010) Laws of biology: why so few? Syst Synth Biol 4: 7-13. [Crossref]