Abstract
The inflammatory properties of propofol are still debated. Apolipoprotein A-I is involved in the inflammation. We sought to determine how propofol or its solvent Intralipid® modulate Apolipoprotein A-I and the inflammatory response after surgical stress. Patients undergoing laparoscopic inguinal hernia repair were allocated to anesthesia with propofol (n=25), isoflurane alone (n=27) or in combination with Intralipid® (n=27). Apolipoprotein A-I and inflammation were assessed before, during and after surgery. Following a decrease in all groups, Apolipoprotein A-I levels tended to recover significantly earlier when propofol or Intralipid® were given (p<0.05). Cortisol increased in the control group whereas it remained at baseline levels when lipids were given. In this study the administration of lipids, i.e. propofol or its solvent Intralipid®, in the perioperative setting was associated with a more pronounced yet rapidly recovering acute phase reaction.
Key words
propofol, isoflurane, intralipid, perioperative inflammation, Apolipoprotein A-I
Introduction
Propofol produces a rapid onset of anesthesia and a fast recovery [1-3]. Its pharmacokinetic characteristics made it a widely used anesthetic agent for surgical procedures and for sedation in intensive care units [4,5]. Although some authors demonstrated that propofol could trigger a proinflammatory immune response [6-8], other clinical and laboratory studies showed that propofol would exert a suppressive effect on the immune system [9-14].
Propofol affects the lipid profile of patients due to its oil-in-water formulation for intravenous use. Long-term propofol sedation has been associated with hypertriglyceridemia [15-17], and propofol binds extensively to all lipoprotein fractions [18] including the high density lipoprotein (HDL) fraction. During inflammation, the metabolism of HDL is markedly affected [19], leading to decreasing levels of HDL. Low levels of HDL have been shown to be related to increased mortality in sepsis [20,21].
Apolipoprotein A-I (Apo A-I), the major protein component of HDL [22], is directly involved in the inflammatory process and is decreased during inflammatory situations as well [23,24]. In vitro, Apo A-I specifically inhibits the contact-mediated activation of monocytes by stimulated T cells, decreasing the production of inflammatory mediators [24]. In a previous study in critically ill patients, a low serum level of Apo A-I at ICU admission was associated with increasing signs of inflammation during their ICU stay [25]. In that study, it was noted that patients who had received propofol before ICU admission had shown a tendency toward an increased Apo A-I level [25,26]. This led to our hypothesis that propofol might modify the Apo A-I blood levels and the perioperative inflammatory course.
To test this hypothesis, we conducted a study to evaluate whether propofol modifies the levels of inflammatory markers, including Apo A-I and the concentration of lipids in response to minor surgical stress in healthy patients. The secondary objective was to determine whether this modulation was due to propofol itself or to the vehicle Intralipid®.
Materials and methods
Patients
Informed consent was obtained the day before surgery. The study protocol was approved by the local ethics committee of the University Hospital of Geneva and has been registered at www.clinicaltrials.gov (identifier NCT 01115179). The study was conducted in the operating room of a tertiary teaching hospital. Male patients between 30 and 70 years of age with an American Society of Anesthesiologists physical status classification (ASA) of I or II, and scheduled for uni- or bilateral elective laparoscopic totally extraperitoneal hernia repair were included after informed consent. For the sake of homogeneity of the population for this pathophysiological study, considering the different known basal level of Apo A-I and its potential variability between male and female subjects, only healthy male were chosen. Patients with the following criteria were excluded: a body mass index of less than 18.5 or more than 39.9 kg/m2, treatment with steroids (>5 mg/d prednisone equivalent, for the last 30 days), with opioids/NSAIDs for chronic pain during the last 30 days, immunosuppression (AIDS, neutropenia <1000 cells/mL, transplant surgery, chemotherapy), a known lipid disorder (triglycerides >2.00 mmol/L, LDL-cholesterol >2.50 mmol/L or HDL-cholesterol <1.00 mmol/L), hypolipemic treatment before admission, thyroid metabolism disorder (thyroid-stimulating hormone >6.0 mUI/L or <0.4 mUI/L), renal insufficiency (creatinine >106 μmol/L), liver disorder (bilirubin >20 μmol/L, thromboplastin time <60%), insulin-dependant diabetes, parenteral nutrition or after any lipid-containing medication (propofol, Intralipid®, etomidate) during the last 30 days, antihypertensive medication with diltiazem or other calcium channel blockers, known chronic alcoholism (men: >65-75 mL alcohol/day), multidrug abuse (cocaine, heroin, methadone, or other narcotics, sedatives or stimulants), mental illness and known allergy to propofol. The exclusion criteria after randomization were change of surgical strategy, protocol violation and major bleeding (>0.5 L).
Study design
Three different types of general anesthesia were compared in this prospective, randomized, controlled, double-blind trial:
- a) Propofol group: induction with propofol (1.5 to 2 mg/kg) and maintenance of anesthesia with propofol 1% (target-controlled infusion with concentration levels of 3-5 μg/mL)
- b) Intralipid group: induction of anesthesia with thiopental (3-5 mg/kg) and maintenance of anesthesia with isoflurane (end-expired concentration=0.5%-2.0%) as well as Intralipid 10%® (corresponding to a target-controlled infusion of propofol with concentration levels of 3-5 μg/mL)
- c) Control group: induction of anesthesia with thiopental (3-5 mg/kg) and maintenance of anesthesia with isoflurane (end-expired concentration=0.5%-2.0%).
The investigators and the patients were blinded to the type of anesthesia performed. The anesthetist and the surgeon were aware of the study group, but were not involved in the evaluation of outcome.
On the day of admission, demographic and diagnostic data including age, sex, body weight, height, medication, ASA classification, and smoking status were assessed and the serum albumin, prealbumin, transferrin, total bilirubin, thyroid stimulating hormone (TSH), creatinine, gamma glutamyl transpeptidase (yGT), alcalin phosphatase (ALP) levels as well as the CD4/CD8 cell counts were measured.
Blood samples were collected from each patient before induction of anesthesia (Baseline=B), after the induction of anesthesia that is the first stressful event (T1), and 5 (T5) and 24 hours (T24) after skin incision. Apo A-I, total cholesterol, HDL-cholesterol, triglycerides, interleukin-6 (IL-6) as well as C-reactive protein (CRP) were measured. A pilot study on six patients was previously performed to determine the optimal time frame for the blood samplings with regard to the variability of Apo A-I levels (blood samples at the following times: before induction, before skin incision, at the end of surgery, and 3, 5, 8, 10, 24 hours after skin incision). Signs of systemic inflammatory response syndrome (SIRS) as defined elsewhere [27] was assessed in parallel.
Standardized anesthesia protocol
All patients arrived in the operating room without any premedication. After establishing non-invasive monitoring (ECG, blood pressure, and oxygen saturation, AS 3 monitoring from Datex-Helsinki-Finland), an intravenous line was performed with a fluid challenge of 500 mL Ringer lactate over 15 minutes, followed by a continuous infusion of Ringer lactate (4-5 mL/kg/h). Before induction of general anesthesia, preoxygenation with 100% oxygen was performed for 3 minutes, followed by an injection of fentanyl (1.5-3.0 μg/kg). Induction and maintenance of general anesthesia was then started according to the main protocol. Intubation was facilitated with muscle relaxants: rocuronium (0.6 mg/kg) or succinylcholine (1 mg/kg). Relaxation was monitored with a train of four controls (musculus orbicularis oculi), stressing a level from 2 to 3 over 4. At the end of the surgery, a pharmacological decurarisation with glycopyrrolate (500 μg) and neostigmine methylsulfate (2.5 mg) was used if necessary according to the usual criteria used in the institution. Ventilation was achieved with an oxygen/air mixture at a FiO2 of 40%, a ventilation rate of 8-12 /min with a tidal volume of 10 mL/kg, stressing an endtidal CO2 of about 35-40 mmHg. Intraoperative analgesia was adjusted by repeated boluses of fentanyl (1 μg/kg). Hemodynamic variables were maintained within 20% of preoperative values, arterial hypertension being treated by deepening the level of anesthesia only, arterial hypotension being treated with a volume challenge of 250 mL Ringer’s lactate followed by ephedrine (10 mg) if necessary. Some patients had local anesthesia at the site of surgery, independent from the study arm. This included a subcutaneous infiltration of 20 ml of ropivacaine 0.5% at the end of surgery. Body temperature was monitored during the intervention (nasopharyngeal thermometer), the patient being draped with an external warming device (Bair Hugger, Augustine Medical, Eden Prarie, MN, USA).
Measurements
Blood samples were allowed to clot at room temperature for 90 minutes. After centrifugation (2500 rpm; 10 min; 4°C), the serum was frozen at -70°C. Total cholesterol, HDL-cholesterol, triglycerides and albumin were measured by standard methods. CRP and Apo A-I were measured by nephelometry using a Beckman Image nephelometer and reagents (Beckman Instruments Inc., Fullerton, CA, USA). IL-6 was measured using a high sensitivity commercially available enzyme-immunoassay according to the supplier’s instructions (Human IL-6 Quantikine HS Elisa Kit, R&D systems, Minneapolis, MN, USA).
Statistical analysis and power calculation
Stata Statistical Software, Release 8.0® (Stata Corporation, College Station, TX, USA) was used for the statistical analysis. Lenth, R. V. (2006). Java Applets for Power and Sample Size [Computer software], retrieved from http://www.stat.uiowa.edu/~rlenth/Power were used for the sample size calculation. To detect a difference in the serum concentration of Apo A-I with and without propofol 5 hours after skin incision and according to our previous results [26], the b-test with a predetermined level of significance, alpha=0.05 and a power of 80%, required 20 patients in each group (mixed design ANOVA) [28].
Considering potential drop-outs by secondary exclusions, 81 patients, 27 patients in each group, were planned for inclusion. The randomisation was performed according to a computer-generated table. Concealment of allocation was ensured with opaque envelopes opened immediately before anesthesia induction. Categorical variables were compared by Fisher’s exact test. Continuous variables were compared by the Kruskall-Wallis test according to their distribution. Repeated measurements were compared using Friedman’s test followed by Dunn’s test. All tests were two tailed, and a p value less than 0.05 was considered significant. All values are expressed as medians with 25th and 75th percentiles (interquartile range=IQR).
Results
Patients
One hundred fifty-one male patients scheduled for laparoscopic totally extraperitoneal hernia repair were consecutively examined for eligibility. Seventy patients were excluded and 81 patients were enrolled in the study. Two patients were secondarily excluded because of protocol violation (one patient received prednisone after anesthesia induction and another patient refused the fourth blood drawing). Of the 79 remaining patients, 25 were assigned to propofol group, 27 to Intralipid® group and 27 to control group (Figure 1). Patient characteristics such as age, body mass index, smoking status, and ASA class were similar among the three groups (Table 1). Before surgery, the laboratory values reflecting the liver, kidney, and endocrine functions as well as the nutritional and immune status of the patients were similar (Table 1).
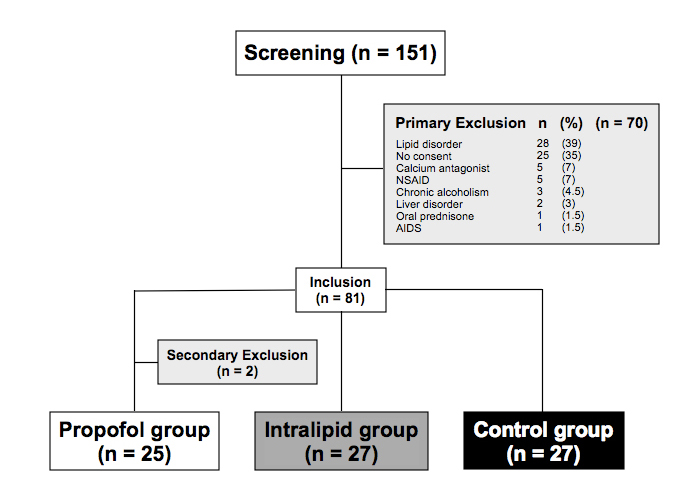
Figure 1. Flow chart of screened, included and excluded patients
* Two patients were excluded secondarily: one patient received prednisone after anaesthesia induction and another patient refused the fourth blood sample taken.
Table 1. Baseline data of patients receiving anesthesia with propofol, isoflurane alone or in combination with Intralipid® for laparoscopic inguinal hernia repair.
|
|
Propofol
n = 25
|
Intralipid®
n = 27
|
Control
n = 27
|
|
Patient characteristics
|
|
Age, years, mean ± SD
Body Mass Index, mean ± SD
Smoking, n (%)
ASA = 1, n (%)
|
50.2 ± 10.6 b
25.6 ± 3.4 b
10 (40) a
16 (64) a
|
52.3 ± 9.5
24.8 ± 3.0
12 (44)
13 (48)
|
52.9 ± 8.4
24.9 ± 2.1
6 (22)
11 (41)
|
|
Laboratory values before surgery
|
|
Liver, mean ± SD
Bilirubin, mmol/L
yGT, U/L
Alc phosphatase, U/L
Albumin, g/L
|
18 ± 9 b
41 ± 45 b
57 ± 18 b
43 ± 4 b
86 ± 11 b
1.4 ± 0.7 b
6.4 ± 2.4 b
1.2 ± 0.3 b
1.5 ± 0.7 b
288 ± 84 b
59 ± 7 b
1.9 (0.6-3.4) b
|
15 ± 8
40 ± 30
61 ± 14
42 ± 4
79 ± 11
2.1 ± 2.8
5.9 ± 1.0
1.2 ± 0.3
1.3 ± 0.6
283 ± 42
58 ± 13
1.6 (0.7-4.0)
|
20 ± 8
35 ± 23
61 ± 17
43 ± 7
84 ± 15
1.5 ± 0.9
6.1 ± 1.8
1.2 ± 0.3
1.2 ± 0.5
289 ± 73
61 ± 12
1.6 (0.6-3.4)
|
|
Kidney, mean ± SD
Creatinin, mmol/l
|
|
Endocrine, mean ± SD
TSH, mU/l
|
|
Nutrition, mean ± SD
Total cholesterol, mmol/L
HDL cholesterol, mmol/L
Triglycerides, mmol/L
Prealbumin, mg/L
Transferrin, mmol/L
|
|
Immune status
CD4/CD8, median (range)
|
a Categorical variables compared by Fisher’s exact test.
b Continuous variables compared by the Kruskall-Wallis test.
Surgery data
Surgical procedures were similar in the three groups, data are summarized in Table 2.
Table 2. Surgery data of patients receiving anesthesia with propofol, isoflurane alone or
in combination with Intralipid® for laparoscopic inguinal hernia repair.
|
|
Propofol
n = 25
|
Intralipid®
n = 27
|
Control
n = 27
|
|
Delay induction-surgery (min), mean ± SD
Duration of surgery (min), mean ± SD
Duration of anesthesia (min), mean ± SD
Bilateral hernia, n (%)
|
35 ± 16 b
83 ± 33 b
118 ± 39 b
12 (48) a
|
38 ± 12
81 ± 34
120 ± 34
11 (41)
|
34 ± 9
68 ± 30
102 ± 31
8 (30)
|
a Categorical variables compared by Fisher’s exact test.
b Continuous variables compared by the Kruskall-Wallis test.
Pre- and post-anesthesia medications
The anti-inflammatory and analgesic treatment throughout the study period did not differ among the three groups (Table 3). The amount of Intralipid 10%® administered in the Intralipid® group was similar as the amount of propofol administered in the propofol group (P=NS).
Table 3. Medications administered perioperatively in patients receiving anesthesia with propofol, isoflurane alone or in combination with Intralipid® for laparoscopic inguinal hernia repair.
|
|
Propofol
n = 25
|
Intralipid®
n = 27
|
Control
n = 27
|
p
|
|
During intervention
|
|
Thiopental, mean ± SD
|
|
During induction, mg
|
0
|
420 ± 85
|
452 ± 78
|
|
|
Fentanyl, mean ± SD
|
|
During induction, mg
|
148 ± 53
|
150 ± 50
|
154 ± 50
|
0.95 b
|
|
After induction, mg
|
198 ± 108
|
194 ± 85
|
191 ± 81
|
0.94 b
|
|
Rocuronium, mean ± SD
|
|
During induction, mg
|
42 ± 10
|
46 ± 13
|
43 ± 12
|
0.74 b
|
|
After induction, mg
|
36 ± 16
|
33 ± 25
|
26 ± 19
|
0.10 b
|
|
Isoflurane, %, mean ± SD
|
0
|
1.06 ± 0.16
|
1.04 ± 0.21
|
|
|
Propofol, mean ± SD
|
|
During induction, mg
|
164 ± 27
|
0
|
0
|
|
|
After induction, mg
|
1041 ± 537
|
0
|
0
|
|
|
Propofol-solvent, mean ± SD
|
|
During induction, mL
|
16 ± 3
|
0
|
0
|
|
|
After induction, mL
|
104 ± 54
|
0
|
0
|
|
|
Intralipid, mean ± SD
|
|
During induction, mL
|
0
|
15 ± 4
|
0
|
|
|
After induction, mL
|
0
|
120 ± 46
|
0
|
|
|
Infiltation, n (%)
|
8 (32)
|
8 (30)
|
12 (44)
|
NS
|
|
After intervention
|
|
Morphine, mean ± SD
|
|
In first 5 hours, mg
|
2.5 ± 5.3
|
4.4 ± 5.8
|
3.1 ± 4.6
|
0.36 b
|
|
In first 24 hours, mg
|
3.7 ± 9.5
|
6.2 ± 8.3
|
3.6 ± 5.6
|
0.25 b
|
|
Tramadol, mean ± SD
|
|
In first 5 hours, mg
|
52 ± 75
|
85 ± 99
|
77 ± 85
|
0.41 b
|
|
In first 24 hours, mg
|
105 ± 140
|
187 ± 203
|
176 ± 165
|
0.20
|
|
Paracetamol, mean ± SD
|
|
In first 5 hours, g
|
2.2 ± 0.9
|
2.1 ± 0.8
|
2.3 ± 0.8
|
0.75 b
|
|
In first 24 hours, g
|
5.6 ± 1.0
|
5.0 ± 1.6
|
5.4 ± 1.1
|
0.16 b
|
a Categorical variables compared by Fisher’s exact test.
b Continuous variables compared by the Kruskall-Wallis test.
Levels of cortisol, IL-6 and CRP
The profile of cortisol levels differed among the three groups (P=0.025). In the control group, the cortisol level (median (IQR): 428 nmol/L (249)) increased after induction compared to the Intralipid® (median (IQR): 272 nmol/L (189); P=0.004) and propofol (median (IQR): 284 nmol/L (200); P=0.0008) groups (Figure 2).
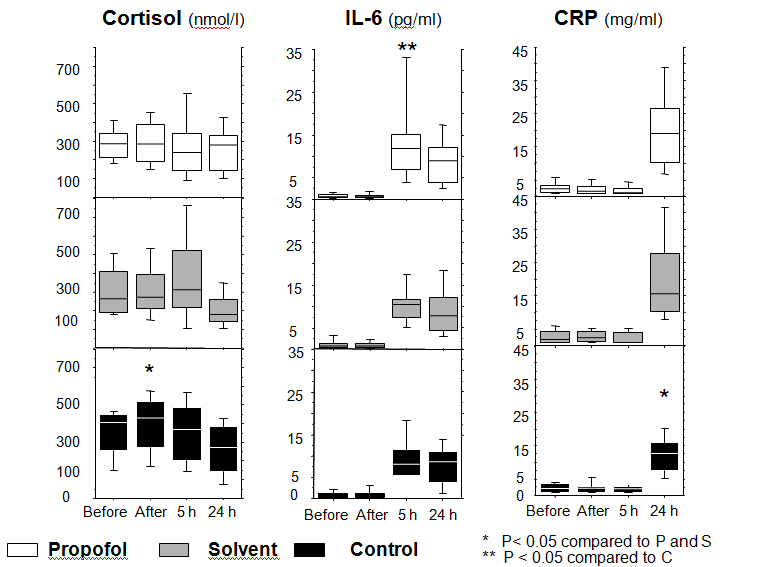
Figure 2. Levels of cortisol, interleukin-6 and C-reactive protein
Changes of the levels of cortisol, interleukin-6 (IL-6) and C-reactive protein (CRP) at several time points during the study period in the propofol, solvent, and control groups.
Repeated measurements were compared by Friedman’s test followed by Dunn’s test
IL-6 levels changed significantly over time in the three groups (P < 0.001). IL-6 remained at low levels until 5 hours after insult, and reached significantly higher levels in the propofol group (median (IQR): 11.8 pg/mL (8.2); P=0.02) compared to the control group (median (IQR): 8.1 pg/mL (6.3)) and the Intralipid® group (median (IQR): 10.4 pg/ml (4.1)). At 24 hours, IL-6 levels decreased in both the propofol and Intralipid® groups, whereas levels remained increased in the control group (Figure 2).
The level of cortisol was lower and the level of IL-6 higher in the propofol group compared to the Intralipid® group at 5 hours, but these differences were not statistically significant.
CRP levels remained low during the first 5 hours and increased at 24 hours in all three groups. At this time, CRP levels were significantly higher in the propofol (median (IQR): 19 mg/mL (16); P=0.002) and Intralipid® (median (IQR): 15 mg/mL (17); P=0.02) groups compared to the control group (median (IQR): 13 mg/mL (8)) (Figure 2).
Evolution of lipid variables
The levels of triglycerides were similar in the three groups before induction of anesthesia. As expected, their levels increased significantly after induction in the propofol and Intralipid® groups (propofol group: TB median (IQR): 1.3 mmol/l (1.1); T1 median (IQR): 1.9 mmol/l (1.2) P < 0.0001) (Intralipid® group: TB median (IQR): 1.2 mmol/l (0.5); T1 median (IQR): 1.5 mmol/l (1.0) P < 0.001), and stayed significantly elevated at 5 hours in propofol group (T5 median (IQR): 1.3 mmol/l (1.5) P < 0.001) and in Intralipid® group (T5 median (IQR): 1.2 mmol/l (1.0) P < 0.001) compared to the control group (control group: TB median (IQR): 1.3 mmol/l (0.5); T1 median (IQR): 1.1 mmol/l (0.4); T5 median (IQR): 0.8 mmol/l (0.5)).
In propofol group, HDL-cholesterol levels began earlier to decrease after induction compared to the 2 other groups (P=0.001). In all 3 groups, HDL-cholesterol was lower than the baseline value 5 hours after the skin incision (median (IQR) mmol/L: B vs T5): propofol group (1.18 (0.3) vs 1.01 (0.3); P=0.001), Intralipid® group (1.07 (0.3) vs 1.00 (0.3); P=0.001) and control group (1.18 (0.5) vs 1.01 (0.4); P=0.001). HDL-cholesterol levels increased again after 24 hours in the Intralipid® (median (IQR): 1.04 mmol/L (0.2); P=0.01) and propofol (median (IQR): 1.09 mmol/L (0.3); P=0.01) groups (Figure 3).
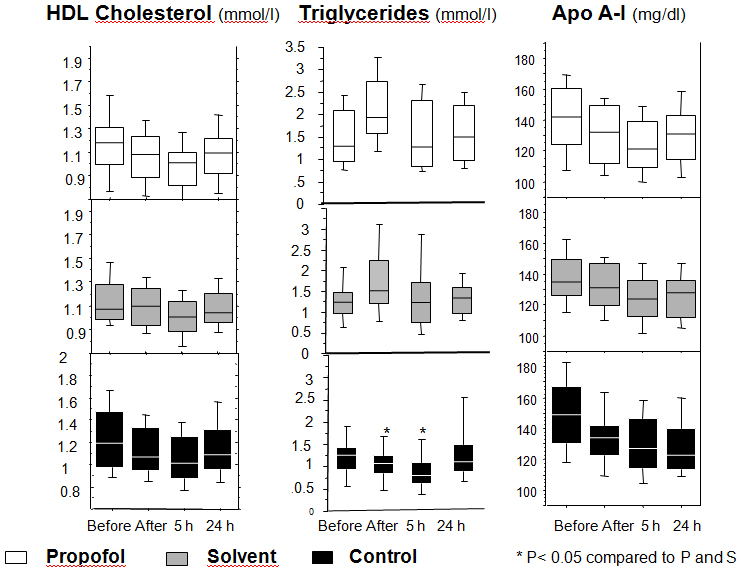
Figure 3. Levels of the lipid parameters
Changes of the levels of triglycerides, HDL-cholesterol and apolipoprotein A-I (Apo A-I) at several time points during the study period in the propofol, solvent, and control groups.
Repeated measurements were compared by Friedman’s test followed by Dunn’s test
Apo A-I levels were similar in the three groups at baseline (median (IQR) mg/dl at TB: propofol group 142.0 (36.3); Intralipid® group (135 (23.8); control group 149 (37)). Apo A-I decreased in all three groups after the initial insult until 5 hours after incision (median (IQR) mg/dl at T5: propofol group 121.0 (29.3); Intralipid® group 124.0 (23.8); control group 127 (32.3)). At 24 hours, Apo A-I levels decreased further in the control group (median (IQR) mg/dl: 123.0 (26.3)), whereas they were increasing in the propofol (median (IQR) mg/dl: 131.0 (28.8)) and Intralipid® groups (median (IQR) mg/dl: 128.0 (24.0)) (Figure 3). The gradient between Apo A-I levels at baseline and 24 hours later (Apo A-I B-T24) was significantly smaller in the Intralipid® (median (IQR) mg/dl: 9.0 (14.0): P=0.005) and in the propofol (median (IQR) mg/dl: 13.0 (14.3): P=0.048) groups compared to control group (median (IQR) mg/dl: 20.5 (16.0)). This reflects the faster recovery of the baseline levels of Apo A-I in the propofol and the Intralipid® groups.
Other outcome measures
The length of stay in the postanesthesia care unit was significantly shorter for the patients in the propofol group (mean ± SD: 80 ± 17 min; P < 0.001) compared to patients in the Intralipid® (mean ± SD: 108 ± 35min) and control (mean ± SD: 111 ± 43 min; P < 0.002) groups. The length of hospital stay did not differ between the three groups (Table 4).
Table 4. Outcome measures of patients after anesthesia with propofol, isoflurane alone or in combination with Intralipid® for laparoscopic inguinal hernia repair.
| |
Propofol
n = 25
|
Intralipid®
n = 27
|
Control
n = 27
|
p
|
|
Occurrence of SIRS during study, n (%)
|
0
|
2 (7)
|
2 (7)
|
0.37 a
|
|
Pain in postoperative recovery unit
|
|
|
|
|
|
First VRS*, mean ± SD
|
1.4 ± 1.6
|
2.6 ± 2.5
|
2.0 ± 2.1
|
0.21 b
|
|
Median VRS, mean ± SD
|
1.1 ± 1.2
|
2.2 ± 1.6
|
1.9 ± 1.4
|
0.02 b
|
|
Nausea, n (%)
|
3 (12)
|
4 (15)
|
3 (11)
|
0.22 a
|
|
Length of stay
|
|
|
|
|
|
In postoperative recovery unit (min), mean ± SD
|
80 ± 17
|
108 ± 35
|
111 ± 43
|
0.03 b
|
|
In hospital (hour), mean ± SD
|
2021 Copyright OAT. All rights reserv
68 ± 15
|
68 ±16
|
73 ± 15
|
NS
|
a Categorical variables compared by Fisher’s exact test.
b Continuous variables compared by the Kruskall-Wallis test.
*VRS: verbal rating score (0 = no pain; 10 = maximum imaginable pain)
Discussion
In this study we observed a distinct course and pattern of inflammatory mediators in association with perioperative administration of propofol or the Intralipid® solvent as compared to isoflurane anesthesia. The administration of both lipid solutions was associated with a shorter, earlier and more pronounced proinflammatory reaction in response to the induction of anesthesia and surgical stress. This altered response to the stressful perioperative event was parallel to an initial failure of cortisol to increase in the groups where lipids were given.
The acute phase response to tissue injury is a series of reactions to minimise tissue damage, favor the clearance of pathogens and activate the repair processes that are necessary to restore normal functions [29]. One of the consequences of acute phase response is the upregulation of inflammatory markers such as CRP [30], whereas concomitantly Apo A-I synthesis is inhibited [31]. In accordance to the known inflammatory response, we found a typical pattern of proinflammatory mediators and Apo A-I after the insults. As a negative acute phase protein, Apo A-I initially decreased, while the proinflammatory mediators increased in all the three groups. Like in other studies we observed higher IL-6 concentrations in the immediate postoperative period following propofol anesthesia as compared to inhalational anesthesia [32,33]. Additionally, we observed a failure of cortisol levels to increase in the propofol and solvent groups which may have contributed to the accentuated proinflammatory profile in these groups [34-37]. More specifically, the inflammatory responses to stress involve coordinated and complex reactions of the immune, nervous, and endocrine systems. The release of corticotropin-releasing hormone (CRH) and arginine vasopressin (AVP) increase adrenocorticotropic hormone (ACTH), and thereby cortisol production [38]. Corticosteroids dampen inflammation, and these adaptations work to restore homeostatic balance. One could hypothesize that the presence of high lipid levels induced by propofol or its solvent modifies the equilibrium of these regulatory mechanisms and induces a rapid, but transient proinflammatory state, explaining the lower level of cortisol, the increase of IL-6 and CRP, and the decrease of Apo A-I.
In their recent animal studies Ma and coworkers found antiinflammatory effects of propofol [14]. They observed that propofol was able to up-regulate the apolipoprotein M (Apo M) expression in hepatocytes and macrophages [14]. Looking at the time scale of their experiments (maximal effect at 24 hours) one could argue that a similar direct effect of propofol (and Intralipid®) on apolipoprotein A-I expression was involved in our study. So, the initial higher proinflammatory reaction in the propofol and Intralipid® groups (potentially due to dampened cortisol response as outlined above, as well as a number of confounding factors present in our study such as higher number of bilateral interventions, longer surgery duration and higher nicotine consumption present in the two lipid groups) seems to have been followed by a subsequent antiinflammatory effect of propofol and Intralipid® with up-regulation of Apo A-I expression and decreasing IL-6 levels (i.e., similar to the effects of propofol as observed in the study by Ma et al. with up-regulation of Apo M expression) [14]. Obviously, these first clinical observations can only be regarded as preliminary (pilot study) and more studies are needed, both for confirmation as well as to clarify any associated clinical significance [39]. Of note, several recent studies compared the effects of propofol and volatile agents on perioperative inflammation [40-42]. Considering our results, further focus on the role of the lipid solvent in the perioperative inflammation seems justified [43].
Long-term administration of propofol was shown to be associated with hypertriglyceridemia [15-17]. According to our results such an elevation in the levels of triglycerides begins shortly after an induction dose of propofol or Intralipid 10%® and remains significantly elevated (compared to the control group) in the hours following surgery. Similar levels of triglycerides in patients of the propofol and solvent groups confirm that both groups received similar amounts of lipids in our study. Furthermore, the fact that the solvent tended to show similar results as propofol, suggests that the inflammatory effect of propofol is mainly due to its lipid vehicle rather than to the propofol molecule itself. Of note, the innocuity of the use of Intralipid® in pancreatitis or acute lung injury was debated over the years and more recently, the propofol infusion syndrome renewed concerns about the use of lipid solution and propofol in critically ill patients. The causes of these effects may be different than the outlined inflammatory approach discussed above. Especially in the case of the propofol infusion syndrome, where inhibition of normal mitochondrial function has been observed [44]. However, inflammatory modulation may also play a role [45].
The biological findings of our study were not accompanied by clinical signs of inflammation. This can be explained by the fact that the surgical insult was too weak to induce a clinically relevant effect, as sustained by the low peak levels of all inflammatory markers. The shorter length of stay in the recovery room after anesthesia with propofol is consistent with the recognized shorter anesthetic effect of propofol and our observation of lower pain ratings in the recovery room period in the propofol treated group confirms previous data [46-49].
Our study has some limitations. Indeed, as stated earlier, some confounding factors may have influenced the perioperative inflammation. The number of bilateral interventions was higher in the propofol and Intralipid® groups as compared to the isoflurane group. However, the difference was not significant. Second, as the proportion of smokers in the isoflurane group was smaller and cigarette smoking is known to impact on the immune system [50], we cannot exclude that smoking did affect our results. Third, the 24 hours observation period was too short. IL-6 levels at 24 hours were already decreasing in the propofol and solvent groups, whereas they were still increasing in the control group. CRP levels appeared to be higher in the propofol and solvent groups. Considering the protracted course of CRP, the evolution of its levels after 24 hours would have been interesting. Although we had performed a pilot study in order to identify the best timings to measure our different molecules, we missed the adequate time points for CRP and IL-6. Finally, our model generated a low level of tissue injury reflected by only modest postoperative levels of inflammatory mediators and a very low incidence of SIRS during the observation period. More aggressive surgery would have produced more pronounced effects on the inflammation, both clinically and on the different molecules measured [33]. This limitation is due to our intent to characterize the effects of propofol on inflammation in a very standardized setting. Additionally, as the level of Apo A-I is known to be more variable in women, we chose to include only men. Therefore, our findings may apply to men only. Finally, it is unclear how the findings of this study model are applicable to other settings such as the intensive care unit where propofol and continuous infusion of Intralipid® are used. The pathophysiological state and the various stressors and multiple hit insults that evolve in the critical ill are likely to be different.
In conclusion, administration of lipids, i.e. propofol or its solvent Intralipid®, in the perioperative setting may be associated with a more pronounced but rapidly recovering acute phase reaction. In our study, ApoA1 recovery was faster with intralipid administration (not propofol alone) but there were no differences between the three groups at the stated time intervals. Additionally, the inflammatory markers had a variable association with administration of intralipid and propofol. However, our results should be looked with criticism since they may not be generalisable to other clinical models, such as major surgery or intensive care. A study with more extensive insult is warranted in order to confirm our findings and to determine the pro-/antiinflammatory role of propofol and its solvent Intralipid®.
Acknowledgements
The authors would like to thank Allison Dwileski, B.S. (Administrative Assistant, Department of Anesthesia, University Hospital, University of Basel, Switzerland) for the editorial assistance and help with manuscript submission.
References
- McKeage K, Perry CM (2003) Propofol: a review of its use in intensive care sedation of adults. CNS Drugs 17: 235-272. [Crossref]
- Aun CS (1999) New i.v. agents. Br J Anaesth 83: 29-41. [Crossref]
- Barr J, Egan TD, Sandoval NF, Zomorodi K, Cohane C, et al. (2001) Propofol dosing regimens for ICU sedation based upon an integrated pharmacokinetic-pharmacodynamic model. Anesthesiology 95: 324-333. [Crossref]
- Ostermann ME, Keenan SP, Seiferling RA, Sibbald WJ (2000) Sedation in the intensive care unit: a systematic review. JAMA 283: 1451-1459. [Crossref]
- Bryson HM, Fulton BR, Faulds D (1995) Propofol. An update of its use in anaesthesia and conscious sedation. Drugs 50: 513-559. [Crossref]
- Brand JM, Frohn C, Luhm J, Kirchner H, Schmucker P (2003) Early alterations in the number of circulating lymphocyte subpopulations and enhanced proinflammatory immune response during opioid-based general anesthesia. Shock 20: 213-217. [Crossref]
- Brand JM, Schmucker P, Breidthardt T, Kirchner H (2001) Upregulation of IFN-gamma and soluble interleukin-2 receptor release and altered serum cortisol and prolactin concentration during general anesthesia. J Interferon Cytokine Res 21: 793-796. [Crossref]
- Helmy SA, Wahby MA, El-Nawaway M (1999) The effect of anaesthesia and surgery on plasma cytokine production. Anaesthesia 54: 733-738. [Crossref]
- Heine J, Jaeger K, Osthaus A, Weingaertner N, Münte S, et al. (2000) Anaesthesia with propofol decreases FMLP-induced neutrophil respiratory burst but not phagocytosis compared with isoflurane. Br J Anaesth 85: 424-430. [Crossref]
- Mikawa K, Akamatsu H, Nishina K, Shiga M, Maekawa N, et al. (1998) Propofol inhibits human neutrophil functions. Anesth Analg 87: 695-700. [Crossref]
- Gilliland HE, Armstrong MA, Carabine U, McMurray TJ (1997) The choice of anesthetic maintenance technique influences the antiinflammatory cytokine response to abdominal surgery. Anesth Analg 85: 1394-1398. [Crossref]
- Weiss M, Birkhahn A, Krone M, Schneider EM (1996) Do etomidate and propofol influence oxygen radical production of neutrophils? Immunopharmacol Immunotoxicol 18: 291-307. [Crossref]
- Crozier TA, Müller JE, Quittkat D, Sydow M, Wuttke W, et al. (1994) Effect of anaesthesia on the cytokine responses to abdominal surgery. Br J Anaesth 72: 280-285. [Crossref]
- Ma X, Hu YW, Zhao ZL, Zheng L, Qiu YR, et al. (2013) Anti-inflammatory effects of propofol are mediated by apolipoprotein M in a hepatocyte nuclear factor-1α-dependent manner. Arch Biochem Biophys 533: 1-10. [Crossref]
- Gottardis M, Khünl-Brady KS, Koller W, Sigl G, Hackl JM (1989) Effect of prolonged sedation with propofol on serum triglyceride and cholesterol concentrations. Br J Anaesth 62: 393-396. [Crossref]
- Carrasco G, Molina R, Costa J, Soler JM, Cabré L (1993) Propofol vs midazolam in short-, medium-, and long-term sedation of critically ill patients. A cost-benefit analysis. Chest 103: 557-564. [Crossref]
- Devaud JC, Berger MM, Pannatier A, Marques-Vidal P, Tappy L, et al. (2012) Hypertriglyceridemia: a potential side effect of propofol sedation in critical illness. Intensive Care Med 38: 1990-1998. [Crossref]
- Zamacona MK, Suárez E, García E, Aguirre C, Calvo R (1998) The significance of lipoproteins in serum binding variations of propofol. Anesth Analg 87: 1147-1151. [Crossref]
- Carpentier YA, Scruel O (2002) Changes in the concentration and composition of plasma lipoproteins during the acute phase response. Curr Opin Clin Nutr Metab Care 5: 153-158. [Crossref]
- Chien JY, Jerng JS, Yu CJ, Yang PC (2005) Low serum level of high-density lipoprotein cholesterol is a poor prognostic factor for severe sepsis. Crit Care Med 33: 1688-1693. [Crossref]
- Barlage S, Gnewuch C, Liebisch G, Wolf Z, Audebert FX, et al. (2009) Changes in HDL-associated apolipoproteins relate to mortality in human sepsis and correlate to monocyte and platelet activation. Intensive Care Med 35: 1877-1885. [Crossref]
- Segrest JP, Li L, Anantharamaiah GM, Harvey SC, Liadaki KN, et al. (2000) Structure and function of apolipoprotein A-I and high-density lipoprotein. Curr Opin Lipidol 11: 105-115. [Crossref]
- Flegel WA, Baumstark MW, Weinstock C, Berg A, Northoff H (1993) Prevention of endotoxin-induced monokine release by human low- and high-density lipoproteins and by apolipoprotein A-I. Infect Immun 61: 5140-5146. [Crossref]
- Hyka N, Dayer JM, Modoux C, Kohno T, Edwards CK 3rd, et al. (2001) Apolipoprotein A-I inhibits the production of interleukin-1beta and tumor necrosis factor-alpha by blocking contact-mediated activation of monocytes by T lymphocytes. Blood 97: 2381-2389. [Crossref]
- Chenaud C, Merlani PG, Roux-Lombard P, Burger D, Harbarth S, et al. (2004) Low apolipoprotein A-I level at intensive care unit admission and systemic inflammatory response syndrome exacerbation. Crit Care Med 32: 632-637. [Crossref]
- Chenaud C, Merlani P, Roux-Lombard P, Burger D, Bandschapp O, Ricou B (2004) Propofol may affect the Apolipoprotein A-I level and its antiinflammatory activity (Abstract). Intensive Care Medicine 30: S160.
- Conference ACoCPSoCCMC (1992) Definitions for sepsis and organ failure and guidelines for the use of innovative therapies in sepsis. Crit Care Med 20: 864-874.
- Lenth (2001) Some practical guidelines for effective sample size determination. The American Statistician 55: 187-193.
- Baumann H, Gauldie J (1994) The acute phase response. Immunol Today 15: 74-80. [Crossref]
- Uhlar CM, Whitehead AS (1999) Serum amyloid A, the major vertebrate acute-phase reactant. Eur J Biochem 265: 501-523. [Crossref]
- Haas MJ, Horani M, Mreyoud A, Plummer B, Wong NC, et al. (2003) Suppression of apolipoprotein AI gene expression in HepG2 cells by TNF alpha and IL-1beta. Biochim Biophys Acta 1623: 120-128. [Crossref]
- Kudoh A, Katagai H, Takazawa T, Matsuki A (2001) Plasma proinflammatory cytokine response to surgical stress in elderly patients. Cytokine 15: 270-273. [Crossref]
- Von Dossow V, Baur S, Sander M, Tønnesen H, Marks C, et al. (2007) Propofol increased the interleukin-6 to interleukin-10 ratio more than isoflurane after surgery in long-term alcoholic patients. J Int Med Res 35: 395-405. [Crossref]
- Adams HA, Schmitz CS, Baltes-Gotz B (1994) Endocrine stress reaction, hemodynamics and recovery in total intravenous and inhalation anesthesia. Propofol versus isoflurane. Anaesthesist 43: 730-737. [Crossref]
- Ledowski T, Bein B, Hanss R, Paris A, Fudickar W, et al. (2005) Neuroendocrine stress response and heart rate variability: a comparison of total intravenous versus balanced anesthesia. Anesth Analg 101: 1700-1705. [Crossref]
- Coiro V, Casti A, Rubino P, Manfredi G, Maffei ML, et al. (2007) Free fatty acids inhibit adrenocorticotropin and cortisol secretion stimulated by physical exercise in normal men. Clin Endocrinol (Oxf) 66: 740-743. [Crossref]
- Lanfranco F, Giordano R, Pellegrino M, Gianotti L, Ramunni J, et al. (2004) Free fatty acids exert an inhibitory effect on adrenocorticotropin and cortisol secretion in humans. J Clin Endocrinol Metab 89: 1385-1390. [Crossref]
- Desborough JP (2000) The stress response to trauma and surgery. Br J Anaesth 85: 109-117. [Crossref]
- Legrand M, Plaud B (2013) Etomidate and general anesthesia: the butterfly effect? Anesth Analg 117: 1267-1269. [Crossref]
- Schilling T, Kozian A, Kretzschmar M, Huth C, Welte T, et al. (2007) Effects of propofol and desflurane anaesthesia on the alveolar inflammatory response to one-lung ventilation. Br J Anaesth 99: 368-375. [Crossref]
- Sugasawa Y, Yamaguchi K, Kumakura S, Murakami T, Suzuki K, et al. (2012) Effects of sevoflurane and propofol on pulmonary inflammatory responses during lung resection. J Anesth 26: 62-69. [Crossref]
- Schilling T, Kozian A, Senturk M, Huth C, Reinhold A, et al. (2011) Effects of volatile and intravenous anesthesia on the alveolar and systemic inflammatory response in thoracic surgical patients. Anesthesiology 115: 65-74. [Crossref]
- Yalcin S, Aydogan H (2012) Propofol and additives: please consider zebras besides horses when you hear hooves. Anesthesiology 116: 492. [Crossref]
- Wolf A, Weir P, Segar P, Stone J, Shield J (2001) Impaired fatty acid oxidation in propofol infusion syndrome. Lancet 357: 606-607. [Crossref]
- Vasile B, Rasulo F, Candiani A, Latronico N (2003) The pathophysiology of propofol infusion syndrome: a simple name for a complex syndrome. Intensive Care Med 29: 1417-1425. [Crossref]
- Tan T, Bhinder R, Carey M, Briggs L (2010) Day-surgery patients anesthetized with propofol have less postoperative pain than those anesthetized with sevoflurane. Anesth Analg 111: 83-85. [Crossref]
- Bandschapp O, Filitz J, Ihmsen H, Berset A, Urwyler A, et al. (2010) Analgesic and antihyperalgesic properties of propofol in a human pain model. Anesthesiology 113: 421-428. [Crossref]
- Hofer CK, Zollinger A, Buchi S, et al. (2003) Patient well-being after general anaesthesia: a prospective, randomized, controlled multi-centre trial comparing intravenous and inhalation anaesthesia. Br J Anaesth 91: 631-637.
- Cheng SS, Yeh J, Flood P (2008) Anesthesia matters: patients anesthetized with propofol have less postoperative pain than those anesthetized with isoflurane. Anesth Analg 106: 264-269. [Crossref]
- Sopori M (2002) Effects of cigarette smoke on the immune system. Nat Rev Immunol 2: 372-377. [Crossref]