Abstract
Drugs with low arrhythmogenic tendencies fail to overcome the threshold to prolong QT interval and are ruled as safe. However, at provoked conditions these drugs might have the possibility to precipitate arrhythmia. Although small yet QT prolongation capability of such drugs must be investigated. The threshold required to prolong QT was attenuated using chronic dose of furosemide and clarithromycin. Once attenuated, QT prolongation capability of ranitidine was explored. Furosemide 10mg.kg-1 IP on co-administration with Clarithromycin 70mg.kg-1 orally for seven day manifested QTc interval at par with that of self-control group. A significant drop in serum potassium level was observed. In test groups, Furosemide 10mg.kg-1 + Clarithromycin 70 mg.kg-1 & Ranitidine 25 mg.kg-1 (once daily) and Furosemide 10mg.kg-1 + Clarithromycin 70 mg.kg-1 & Ranitidine 25 mg.kg-1 (Twice daily) the QTc prolongation compared to self control group was +28.0 % and +55.3 %, respectively. In the later group, the QT interval was observed to increase more than half the RR interval on ECG, a clinical indicator of cardiac emergency. Marked change in serum potassium level was also observed in the test groups. When Ranitidine alone was administered twice daily for seven days, no significant change in QTc interval was observed. Attenuation of the QT interval prolongation threshold exacerbates slightest QT prolongation tendencies and hence determine arrhythmogenic tendency of test drug. This model may be implied in the assessment of cardio-safety of drugs.
Key word
arrhythmia; furosemide; clarithromycin; ranitidine; qt; provocative model
Chemical compound
Furosemide (PubChem CID: 3440), Clarithromycin (PubChem CID: 84029), Ranitidine (PubChem CID: 3033332), Ketamine (PubChem CID: 3821), Xylazine (PubChem CID: 68554).
Abbreviations
FUR: Furosemide; CLA: Clarithromycin; RAN: Ranitidine; IP: Intra-peritoneal; OD: Once daily; BD: Twice daily; QTc: corrected QT interval; ECG: Electrocardiography; ISE: Ion-selective electrode; TdP: Torsades de pointes, FDA: Food & Drug Authority; NCE: New Chemical Entity;.
Introduction
Various factors associated with cardiac arrhythmia have been extensively elaborated yet arrhythmia remains a challenge for physicians and researchers. In the last few decades there has been a growing awareness regarding the electrolyte abnormalities and its implication on arrhythmia [1,2]. The primary focus of such investigation deals with the consequences of extensive use of high potency diuretic drugs [3,4]. Earlier we have reported that a commonly used high potency diuretic – furosemide (FUR), exhibited significant hypokalemia even at a dose of 10 mg.kg-1 in experimental male wister rats [5]. Akita, et al. (1998) has also mentioned that higher dose of FUR might increase the tendency to develop metabolic alkalosis in laboratory rats. Thus we feel that our dose of FUR is probably justified to induce experimental hypokalemia in the said animals sparing chances of alkalosis.
Drug induced QT interval prolongation have come into consideration since the early 90’s [6]. Currently there are more than 50 non-cardiac drugs that have been reported to prolong the QT interval [7,8]. A plethora of antimicrobials [9]; especially oral macrolide group of antibiotics are infamously known to prolong cardiac repolarization period and is associated with case reports of arrhythmia [10]. Clarithromycin (CLA) is one such macrolide drug that has been extensively studied in relation to its tendency to prolong QT interval [11] and is a proven arrhythmogen [12].
Given that QT/QTc is a surrogate marker for detection of arrhythmogenesis, various regulatory authorities have adopted preclinical and clinical approaches to assess the potential risk of QT interval prolongation of non-cardiac drugs. Eventually in 2005, the US-FDA incorporated the cardiac assessment test as compulsory requirement in the clinical evaluation of the NCEs. While these guidelines are concerned primarily with the evaluation of arrhythmogenic characteristics of novel agents during the clinical trials prior to marketing, a generous concern always remain kindled about the pre-approved drugs for whom such apprehension were not conceived during their approval.
In this context, we apprehend that inducing Long QT/QTc interval in ECG might/must have a relation to ‘strong safety margin’. In one of his reports Biliczki reported about a ‘strong safety margin’ maintained in the electrophysiology of cardiac myocytes. According to him, ventricular repolarization is finely controlled by a syndicate of various channels. Under normal conditions impairment or blockage of one type will not necessarily result in failure of repolarization rather will be compensated by the others. This phenomenon is widely regarded as repolarization reserve. However, he proved that if this repolarization reserve is attenuated by total potassium current inhibition then proarrhythmic prolongation of the ventricular APD occurs [13].
In our previous report [5] it was demonstrated that neither FUR (10mg.kg-1) nor CLA (80mg.kg-1) induced any significant change in QTc but when administered in combination manifested a marked change in QT interval. In this context, we apprehend if we could minimize the potassium current by creating an artificial hypokalemia then by the use of a titrated dose of a proven arrhythmogen we can attenuate this so called ‘strong safety margin’. It was therefore interesting to further investigate the possible effect of a test drug on repolarization once the safety margin is attenuated. We further felt, it is possible to exacerbate milder tendencies of the test drug to prolong the QT in experimental animals which are otherwise not quantifiable by the available protocols.
Methods
Animal husbandry and maintenance
The study conducted was in accordance with the institutional animal ethics committee of TAAB Biostudy Services Lab (constituted under the guidelines of Committee for the Purpose of Control and Supervision of Experiments on Animal, registration no. 1237/PO/c/2008/CPCSEA, dated 23.11.2012) and Lambeth Convention [14]. Adult male wistar rats weighing 180-200 g were used for the study. The animals were housed in polypropylene cages under standard laboratory conditions (temperature 25±2°C) with a 12 h light/dark cycle. During this period they had access to standard pellet diet and water ad libitum.
Drugs
The following chemical agents were used: clarithromycin suspension (Crixan) from Ranbaxy Laboratories Limited, India; furosemide injection (Lasix) from Sanofi India Limited; Ranitidine Injection from J. B. Chemicals & Pharmaceuticals Limited, India; Ketamine hydrochloride Injection from Vulcan Laboratories, India; Xylazine Injection from Indian Immunologicals; standard propanolol, ranitidine, clarithromycin from Sigma Aldrich, USA, other chemicals used were from Merck specialities private limited, India.
Test protocol
Animals were divided into four groups (n=6): Group I (Compromised group) received furosemide (FUR) intra-peritoneal (IP) injection at 10 mg.kg-1.day-1 and clarithromycin (CLA) suspension orally at 70 mg.kg-1.day-1; Group II (Compromised +Test drug OD) received FUR IP at 10 mg.kg-1.day-1, CLA suspension at 70 mg.kg-1.day-1 and ranitidine IP 25 mg.kg-1.day-1; Group III (Compromised + Test drug BD) received FUR IP at 10 mg.kg-1.day-1, CLA suspension at 70 mg.kg-1 and ranitidine IP 25 mg.kg-1 twice daily; and Group IV (Ranitidine) received only rantidine IP 25 mg.kg-1.day-1.
After seventh days of above-mentioned treatment, blood sample were collected in heparinated tubes under anesthesia. About 250µl of the collected blood was centrifuged at 850 xg for 5 min at 10°C for harvesting plasma. All animals were sacrificed by cervical decapitation for isolation of heart. Heart tissue were perfused immediately with ice-cold saline and blotted on filter paper to remove blood and finally plasma and heart tissue were stored at -80°C until analysis.
Surface electrocardiogram (ECG) recording in anesthetic rats
Rats were anesthetized using Ketamine (60mg.kg-1) and xylazine (10mg.kg-1) according to the method of [15]. ECG was recorded for 5 min, 2 h after medication using standard lead II (metal ECG leads). The ECG signals were acquired and analysed by BIOPAC (Biosystems, USA) MP36. ECG tracing on zero day i.e. before administration of drug was considered as self control while that of the seventh day was compared with the said control. Duration of QT was determined from the onset of QRS complex to the end of T wave. Measured QT was corrected using normalised Bazett's equation to obtain the corrected QT (QTc) interval.
QT correction
QT interval is highly dependent on the heart rate [16], while that of rats it varies over a wide range [17]. Accordingly, the measured QT was thus corrected using normalized Bazett’s equation QTc=QT/ √ (RR/f), where f is the normalization factor [18]. In this present study, the normalization factor is the value of the average RR duration of each group.
Analysis of serum electrolyte
Rat blood samples on zero day i.e. before administration of drug was considered as self control while that of the seventh day (2 hrs after CLA dose) was compared with the said control. The blood samples were then centrifuged at 2400g for 10 min and serum was separated and were analysed for electrolyte concentration. Serum potassium concentrations were determined using ISE electrolyte analyser (Medica Easy Lyte, USA).
Plasma and tissue distribution of drug
Preparation of standards curve: The standard stock solution of analyte and propranolol (internal standard, IS) were prepared by dissolving ranitidine and clarithomycin in DMSO to get a final concentration of 2 mg.ml-1 for each. Then a cocktail intermediate solution (1mg.ml-1) of both ranitidine and CLA in DMSO was also prepared. The working stocks for calibration curve were prepared by serial dilution from intermediate stock. An eleven points standard curve was prepared by spiking 2 µl from working stock to 98 µl blank matrix (plasma/tissue homogenate) to get final concentration of 1250.0, 625.0, 312.5, 156.25, 78.13, 39.06, 19.53, 9.8, 4.88, 2.44, 1.22 ng.ml-1 and 150 ng.ml-1 of IS solution was made in 100% acetonitrile to precipitate the samples.
LC–MS/MS: The liquid chromatography (LC) system consisting of LC-20ADvp pump (Shimadzu, Kyoto, Japan), CTC PAL (HTS) auto-sampler, and the mass spectrometer composed of turbo ion spray with atmospheric pressure ionization source (API-4000, AB Sciex Instruments, Foster CA). Detection and quantification were performed using Analyst 1.4.2.
Statistical analysis: Values are expressed as Mean±S.E.M (n=6). Statistical analysis was performed using Student’s t-test (GraphPad Prism5, USA), *p< 0.05 was taken as the criterion of statistical significance.
Results
Electrocardiographic measurement
ECG of all the animals of each group was recorded; the QT and R-R interval were used to calculate the QTc value. Due to inter strain variability and dearth of standard QT value in rats, self-control value was considered as normal; any higher value which showed significant increase compared to self control was considered as prolongation in QT interval. Sample ECG tracing of each group after the seventh day of dosing and its corresponding self control tracing is represented in figure 1. The QT, RR and the heart rate corrected QTc value obtained is tabulated in table 1. A graphical representation suggesting the overall change in QT, RR and QTc values across all groups of the study is presented in figures 2a, 2b and 2c. The QT and QTc value obtained for group I showed similarity to the group’s self control data. There is a significant increase in the QT and QTc interval value after seventh day dosing compared to the self control data in Group II and Group III (p<0.05).
Table 1. QT, RR and QTc interval of all the groups with respect to their corresponding self-control. Values expressed as Mean ± SEM, *p<0.05, n=6.
Electrocardiogram Data |
Groups |
QT
(msec) |
RR
(msec) |
QTc
(msec) |
Group I
FUR+CLA
10+70 mg/kg |
Self Control |
73.0 ± 0.5 |
252.1 ± 12.9 |
72.6 ± 1.9 |
Seventh day |
76 ± 3.7 |
261.5 ± 3.3 |
74.6 ± 3.1 |
Group II
FUR+CLA+RAN (OD)
10+70+25 mg/kg |
Self |
71 ± 0.8 |
239.3 ± 13.0 |
71.4 ± 1.4* |
Seventh day |
105.7 ± 2.5 |
285.9 ± 17.2 |
97.0 ± 3.8* |
Group III
FUR+CLA+RAN (BD)
10+70+25 mg/kg |
Self |
78.7 ± 4.7 |
238.3 ± 11.4 |
78.6 ± 3.2* |
Seventh day |
121.7 ± 5.0 |
237.2 ± 11.3 |
122.1 ± 4.5* |
Group IV
RAN (BD)
25 mg/kg |
Self |
74.1 ± 5 |
223.7 ± 1.9 |
74.2 ± 5.3* |
Seventh day |
76.9 ± 1.0 |
251.5 ± 1.0 |
65.9 ± 5.9 |
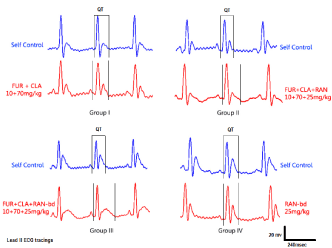
Figure 1. Sample ECG tracings of animals of all groups. For each group, the self control data is represented with blue (left) and the study data is represented with red (right). The unit of measurement is msec.
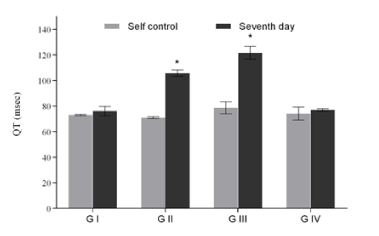
Figure 2a. QT interval of groups with respect to their corresponding self-control. Values expressed as Mean ± SEM. *p<0.05, n=6.
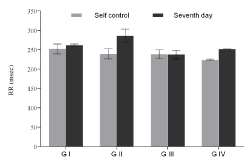
Figure 2b. RR interval of groups with respect to their corresponding self-control. Values expressed as Mean ± SEM. *p<0.05, n=6.
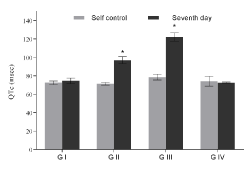
Figure 2c. QTc interval of groups with respect to their corresponding self-control. Values expressed as Mean ± SEM. *p<0.05, n=6.
Serum electrolyte measurement
Serum potassium value of all the groups is tabulated in the table 2. A grouped serum potassium data of the animals indicating their individual and group mean value is plotted in figure 3. Seventh day serum potassium data in Group I, Group II and Group III is significantly lower than its self-control values (*p< 0.05). The values observed are lower than the lower limits of potassium required in blood. Hence, a hypokalemic condition was established on comparison to their respective self-control values.
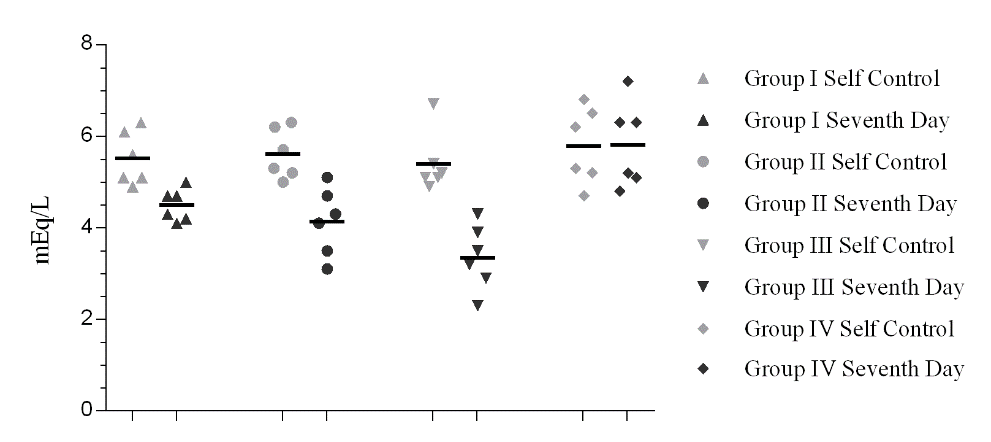
Figure 3. Serum potassium data of the animals indicating their individual and group mean values. Self control data are marked with light grey colour and seventh day data are marked with dark grey color. [*p< 0.05].
Table 2. Serum potassium data of all groups compared to its respective self-control values. Values expressed as Mean ± SEM. *p<0.05, n=6.
Serum Potassium Data |
Groups |
K+
(mEq/L) |
Group I
FUR+CLA
10+70 mg/kg |
Self |
5.5 ± 0.24* |
Seventh day |
4.5 ± 0.14* |
Group II
FUR+CLA+RAN (OD)
10+70+25 mg/kg |
Self |
5.6 ± 0.22* |
Seventh day |
4.1 ± 0.30* |
Group III
FUR+CLA+RAN (BD)
10+70+25 mg/kg |
Self |
5.4 ± 0.27* |
Seventh day |
3.4 ± 0.29* |
Group IV
RAN (BD)
25 mg/kg |
Self |
5.8 ± 0.34* |
Seventh day |
5.8 ± 0.38* |
Plasma and tissue distribution
After the seventh day treatment with ranitidine and CLA, the plasma and cardiac tissue samples harvested were analysed for the mean plasma and tissue concentration (Table 3). CLA on administration with FUR (group I) demonstrated a high prevalence in plasma (4362.38 ng.ml-1) and heart tissue (16680.23 ng.g-1). However, when CLA was co-administered with ranitidine (group III) a decrease in plasma and cardiac tissue concentration was observed (782.10 ng.ml-1 and 2707.50 ng.g-1 respectively).
Table 3. Mean plasma and heart tissue distribution data of clarithromycin and ranitidine after seventh day of dosing in different groups (n=6).
Plasma and Heart tissue distribution data |
Dosage |
Plasma |
Heart |
|
CLA
(ng/ml) |
RAN
(ng/ml) |
CLA
(ng/g) |
RAN
(ng/g) |
Group I |
FUR+CLA |
4362.38 |
- |
16680.23 |
- |
Group III |
FUR+CLA+RAN |
782.10 |
736.60 |
2707.50 |
1208.25 |
Group IV |
RAN |
- |
1687.43 |
- |
233.59 |
Discussions and conclusion
The most important finding of this study is that in a state of artificially induced hypokalemia co-administration of a specific dose of arrhythmogenic agent (clarithromycin) leads to attenuation of the safety margin of cardiac myocytes eventually leading to prolonged QT interval. Beyond which administration of ranitidine served as a provocation for further significant prolongation in the QT interval of rats.
2021 Copyright OAT. All rights reserv
Redundancy is a characteristic property of biological systems [19]. Heart as well, has the unique ability to accommodate stress conditions to function normally. However, it is certain, that once this accommodating capacity is exhausted by any disease condition or biological/chemical agent the heart may function abnormally and might manifest an anomaly in basic diagnostic markers. QT/QTc interval in ECG is one such surrogate marker of the electrophysiological function of the heart. In our previous studies, we have observed that chronic administration of furosemide or clarithromycin exhibited no significant modulation of QT/QTc interval; however, on chronic (seven days) co-administration of these drugs (FUR+CLA; 10+80 mg.kg-1) a significant prolongation of QT/QTc interval was observed [5]. We feel this observation might be due to a drug induced tendency to prolong repolarization phase which surpasses the accommodation of cardiac tissue. Another explanation for the same might be correlated to the observations of Biliczki where he demonstrated inefficient working of current channel in the repolarization phase leads to proarrhytmic prolongation of APD [13]. In our present experiment, maintaining a fixed dose of FUR (i.e. corresponding to hypokalemia), the dose of CLA was titrated-down to 70 mg.kg-1, eventually producing a QTc interval at par with the normal (drug free self control value of QTc). We were of the opinion that should there be any further provocation for prolongation of QT, a measurable change in the QT interval may be recorded. This might be important for those weak stimuli which are not alone strong enough to bring a recordable change in ECG.
Ranitidine, a commonly prescribed histaminic H2 receptor antagonist was administered in a dose of 25 mg.kg-1 (corresponding to human dose of 300 mg, BD) to test animals (Group IV) and no modulation of QTc interval was observed. However, when the same dose of ranitidine (OD and BD) was administered along with the combination (FUR + CLA; 10+70 mg.kg-1), a significant prolongation of QT interval was observed (Group II and Group III). It will be pertinent to mention that the observed duration of prolonged QTc interval was greater than ½ of RR interval. This particular phenomenon is clinically considered to be an indicator of cardiac emergency so far cardiac arrhythmia is considered [20]. It will be important to mention that neither premature ventricular beat nor any torsade de pointes (TdP) was observed during our investigation. It will be also worth mentioning that under the influence of ketamine and xylazine no significant prolongation of QT was recorded during our study despite obvious reduction in heart rate. In relation to the hypothesis proposed in the earlier section of this discussion, ranitidine was our drug induced stimulus on the FUR + CLA (10+70 mg.kg-1) induced attenuated safety margin. Thus, ranitidine significantly prolonged QTc interval in our provocative model.
Despite the controversy in difference in pattern of rodent ECG with that of mammalian, hypokalemia induced changes in ECG are probably qualitatively similar so far action potential duration (APD) is concerned [3]. Chronic alteration of K+ concentration had demonstrated that IKr current cease to exist at 0mM K+ in extracellular culture medium. Systemic K+ is essential and fluctuation in the potassium concentration under physiological conditions may regulate cellular surface density of IKr channel in vivo and the gating kinetics is maximum at around 5mM K+ [21]. Similarly from our findings we have also tried to find a relation of QT/QTc interval with serum potassium concentration where normal QT/QTc interval corresponded to optimal range of 4.5 to 6.5 mEq.L-1 of serum K+ (Figure 4). A fall in serum potassium concentration leads to severe prolongation of the QT/QTc interval.
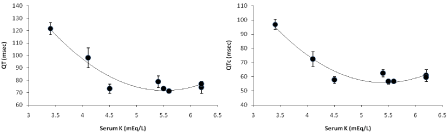
Figure 4. Relationship between serum potassium data of the animals and changes in QT and QTc interval. Values expressed as Mean ± SEM. *p<0.05, n=6.
The LC-MS/MS investigation of homogenized cardiac tissue revealed a decrease in concentration of CLA when co-administered with ranitidine as compared to that of single administration of CLA. Thereby indicating a probable competitive replacement of CLA by ranitidine in cardiac tissue (although, specific drug-protein binding assays could have been more appropriate). Although, few in number yet some scientific claims are in favour of the availability of H2 receptor in heart [22,23]. Hart in 1989 indicated that the adverse effect of ranitidine in coronary smooth muscle may be due to H2 receptor antagonism [24]. Hence, our observation if not in particular but at least could justify the association of the drug ranitidine in cardiac tissue and the prolongation of QTc. In this context it will be much important to mention that following withdrawal of ranitidine, the observed prolonged QTc interval was found to revert and normalize (53.5 ± 3.1 msec in GroupII animals) although it has not been reported in the results section. These evidences rule out the general idea of ranitidine to be a cardiac safe drug and indicate further exploration of the safety-concern of ranitidine. Where our study model might be important in the proposed exploration [25].
Thus our study indicates an idea about improvisation of a provocative study model where otherwise milder tendencies for QT prolongation can be accounted for. This physiological condition can also be apprehended in actual clinical cases where drug / herb / food induced hypokalemia might prompt a cardiac risk with drugs like ranitidine explained in terms of QT interval measurement.
Acknowledgements
We would like to thanks Dr. Balaram Ghosh, MD, Associate Professor, Department of Pharmacology, Midnapore Medical College & Hospital, WB, India, for verifying the acquired ECG tracings. We also express our sincere thanks to the Department of Science & Technology (SERB) Govt. of India, All India Council of Technical Education (RPS) Govt. of India and University Grants Commission (UPE-II), Govt. of India for the financial assistance.
Conflicts of interest
None of the authors have any conflicts of interest relating to this submission.
References
- Leenen FH (1981) Diuretic and cardiovascular effects of furosemide in rats. Can J Physiol Pharmacol 59: 1002-1007. [Crossref]
- Alfonzo AV, Isles C, Geddes C, Deighan C (2006) Potassium disorders--clinical spectrum and emergency management. Resuscitation 70: 10-25. [Crossref]
- Akita M, Kuwahara M, Tsubone H, Sugano S (1998) ECG changes during furosemide-induced hypokalemia in the rat. J Electrocardiol 31: 45-49. [Crossref]
- Pitt B (2009) The role of chlorthalidone in patients with high-risk hypertension. J Clin Hypertens (Greenwich) 11: 460-461. [Crossref]
- Karmakar S, Padman A, Swamy Mane N, Sen T (2013) Hypokalemia: a potent risk for QTc prolongation in clarithromycin treated rats. Eur J Pharmacol 709: 80-84. [Crossref]
- Moss AJ (2006) Drug-induced QT prolongation: an update. Ann Noninvasive Electrocardiol 11: 1-2. [Crossref]
- Yap YG, Camm AJ (2003) Drug induced QT prolongation and torsades de pointes. Heart 89: 1363-1372. [Crossref]
- Redfern WS, Carlsson L, Davis AS, Lynch WG, MacKenzie I, et al. (2003) Relationships between preclinical cardiac electrophysiology, clinical QT interval prolongation and torsade de pointes for a broad range of drugs: evidence for a provisional safety margin in drug development. Cardiovasc Res 58: 32-45. [Crossref]
- Owens RC Jr, Nolin TD (2006) Antimicrobial-associated QT interval prolongation: pointes of interest. Clinical Infectious Diseases 43: 1603-1611. [Crossref]
- Ray WA, Murray KT, Meredith S, Narasimhulu SS, Hall K, et al. (2004) Oral erythromycin and the risk of sudden death from cardiac causes. N Engl J Med 351: 1089-1096. [Crossref]
- Ohtani H, Taninaka C, Hanada E, Kotaki H, Sato H, et al (2000) Comparative Pharmacodynamic Analysis of Q-T Interval Prolongation Induced by the Macrolides CLA, Roxithromycin, and Azithromycin in Rats. Antimicrobial Agents and Chemotherapy 44: 2630-2637. [Crossref]
- Hensey C, Keane D (2008) Clarithromycin induced torsade de pointes. Ir J Med Sci 177: 67-68. [Crossref]
- Biliczki P, Virag L, Iost N, Papp JG, Varro A (2002) Interaction of different potassium channels in cardiac repolarization in dog ventricular preparations: role of repolarization reserve. British Journal of Pharmacology 137: 361-368. [Crossref]
- Walker MJA, Curtis MJ, Hearse DJ, Campbell RWF, Janse MJ, et. al (1988) The Lambeth Conventions: guidelines for the study of arrhythmias in ischaemia, infarction and reperfusion. Cardiovascular Research 22: 447-455. [Crossref]
- Hatzopoulos S, Petruccelli J, Laurell G, Finesso M, Martini A (2002) Evaluation of anesthesia effects in a rat animal model using otoacoustic emission protocols. Hearing Research 170: 12-21. [Crossref]
- Hayes E, Pugsley MK, Penz WP, Adaikan G, Walker MJ (1994) Relationship between QaT and RR intervals in rats, guinea pigs, rabbits, and primates. J Pharmacol Toxicol Methods 32: 201-207. [Crossref]
- Farraj AK, Hazari MS, Cascio WE (2011) The utility of the small rodent electrocardiogram in toxicology. Toxicol Sci 121: 11-30. [Crossref]
- Kmecova J, Klimas J (2010) Heart rate correction of the QT duration in rats. Eur J Pharmacol 641: 187-192. [Crossref]
- Carmeliet E (2006) Repolarization reserve in cardiac cells. Journal of Medical and Biological Engineering 26: 97-105.
- Lippincott Williams & Wilkins (2005) Pharmacologic treatment. In ECG interpretation made incredibly easy, Fifth edition. ed. Diehl TS, Lippincott Williams & Wilkins: Philadelphia, pp 205-238.
- Guo J, Massaeli H, Xu J, Jia Z, Wigle JT, et al. (2009) Extracellular K+ concentration controls cell surface density of IKr in rabbit hearts and of the HERG channel in human cell lines. The Journal of Clinical Investigation 119: 2745-2757. [Crossref]
- Matsuda N, Jesmin S, Takahashi, Hatta E, Kobayashi M, et al. (2004) Histamine H1 and H2 receptor gene and protein levels are differentially expressed in the hearts of rodents and humans. The Journal of Pharmacology and Experimental Therapeutics 309: 786-795. [Crossref]
- Coruzzi G, Adami M, Pozzoli C, Giorgi F, Bertaccini G (1996) Cardiac and gastric effects of histamine H2 receptor antagonists: no evidence for a correlation between lipophilicity and receptor affinity. British Journal of Pharmacology 118: 1813-1821.
- Hart AM (1989) Cardiac arrest associated with ranitidine. BMJ 299: 519. [Crossref]
- FDA (2005) Guidance for Industry: E14 Clinical Evaluation of QT/QTc Interval Prolongation and Proarrhythmic Potential for Non-Antiarrhythmic Drugs: U.S. Department of Health and Human Services.