Abstract
Aim: We sought to assess the effect of renal sympathetic denervation (RSD) in a normotensive patient with mixed type reflex syncope (MRS).
Methods and results: In this pilot cohort study, we prospectively enrolled 33 structurally normal heart, normotensive patients with a history of recurrent pre-syncope or syncope episodes which were diagnosed as mixed reflex syncope (MRS) by tilt-table testing. Participants were divided to receive conventional management with or without RSD intervention based on a fully informed consent (RSD group n=13, control n=20).
The Receiver Operating Characteristic (ROC) curve from the decrease of systolic blood pressure (SBP) was area under the ROC curve: 0.9931, 95%CI: 0.9805 – 0.9996, P<0.0001, sensitivity: 94%, specificity: 100%, cutoff point of ∆ SBP to trigger the syncope episode during the tilt-table testing: < -62.5 mmHg, and area under the ROC curve: 0.9772, 95%CI: 0.9326 – 0.9989, P<0.0001, sensitivity: 100%, specificity: 95%, cutoff point of ∆ heart rate (HR) to trigger the syncope episode during the tilt-table testing: < -20 bpm, respectively. At baseline, 90% of patients from the control group presented syncope during tilt-table testing vs. 85% of subjects from the RSD group (P>0.9999). At the 6th month follow up (FU), 75% of patients from the control group presented syncope during tilt-table testing vs. 15% from the RSD group (P=0.0013), and the BP and HR measurements during tilt-table testing in the RSD group were significantly improved as compared with the control. Ambulatory blood pressure monitoring (ABPM) did not show a significant change in RSD group during the 6th month FU. No procedure-related complications were observed in the study FU.
Conclusions: In normotensive patients with primary, recurrent mixed reflex syncope, RSD seems to reduce the clinical syncope and pre-syncope events, besides to improve the physical parameters in the tilt-table testing. These favorable effects by RSD appear not associated with additional risk of adverse events.
Keywords
Renal sympathetic denervation, tilt-table testing, mixed reflex syncope, pre-syncope, blood pressure
Introduction
Syncope is common in the general population and the first episode presents at characteristic ages. There is a very extraordinary prevalence of first faints in patients between 10 and 30 years, with a peak of around 47% in females and 31% of males around the age of 15 [1,2]. The reflex syncope is by far-flung the most common cause. In contrast, the frequency of epileptic seizures in a similarly young phase group is much lesser (minus than 1%) and syncope related to cardiac arrhythmia is even minus communal [3]. In a cohort study, only 5% of adults in the communal have a first syncope above 40 years old. The widely held have experienced reflex-mediated episodes as teenagers and adolescents [3].
Syncope is a transient loss of consciousness due to transient global cerebral hypoperfusion characterized by rapid onset, short duration, and spontaneous complete recovery. The adjective ‘pre-syncopal’ is used to designate symptoms and signs that happen before unconsciousness in syncope, so its significance is literal when used in this context and making it a synonym of ‘‘warning’’ and ‘’prodromal’’. Reflex syncope conventionally refers to a heterogeneous cluster of circumstances in which cardiovascular reflexes that are usually useful in controlling the circulation turn into intermittently unsuitable, in reaction to a trigger, occasioning in vasodilatation and/ or bradycardia and thus in a drop in arterial blood pressure (BP) and global cerebral perfusion [4]. Reflex syncope is frequently categorized based on the efferent pathway most involved, i.e., sympathethic or parasympathetic. The term ‘’vasodepressor type’’ is commonly used if hypotension, due to a loss of upright vasoconstrictor tone, predominates. “Cardioinhibitory’’ is used when bradycardia or asystole predominate, and ‘‘mixed’’ is used if both mechanisms are existing. Reflex syncope may also be categorized based on several causes, and the triggering situations vary considerably in and among individual patients.
We hypothesized that the modulation of the sympathetic system by catheter-based renal sympathetic denervation (RSD) could rebalance the parasympathetic tonus in patients with mixed reflex syncope (MRS) diagnosed by tilt-table testing.
Methods
Aims, study subjects, procedures, and assessment
The primary outcomes of our study are: 1). Evaluating the blood pressure (BP) and heart rate (HR) parameters, and number of syncope events occur during the tilt-table testing at the 6th month after RSD in comparison to baseline and to the control group, and 2) Assessing the percentage of patients that present clinical events of pre-syncope and syncope at each month of follow-up between both groups. As the secondary outcomes, we evaluated the mean 24-hour systolic/diastolic ambulatory blood pressure measurements (ABPM), minimal, average and maximal HR measured by 24-hour-Holter monitoring, as well as the renal function.
This prospective longitudinal study involved 33 normotensive patients presenting the history of recurrent pre-syncope and syncope episodes and MRS confirmed by tilt-table testing. The study was conducted in agreement with the Helsinki declaration and approved by the ethics committee of our institution. All patients signed the informed consent term before inclusion. This study was piloted at the Hospital e Clínica São Gonçalo, São Gonçalo, Rio de Janeiro, Brazil. Patients were recruited from January to August 2015 to January 2016 from the Arrhythmias and Artificial Cardiac Pacing Service of the hospital. Patients with the combination of the following criteria were consecutively enrolled: (i) mean 24-hour systolic ambulatory blood pressure measurements (ABPM) of <130 mmHg and mean 24-hour diastolic ambulatory blood pressure <80 mmHg; (ii) structurally normal heart with an ejection fraction of >50% measured by Simpson’s method, absence of ischemia or/and fibrosis proved by cardiac magnetic resonance (CMR); (iii) without documented hemodynamically compromised or symptom-related arrhythmias based on the 24-hour-Holter monitoring or conventional ECG peri-symptoms; (iv) normal basal ECG intervals and absence of inducible arrhythmias in standard electrophysiological study (EPS); (v) age of 18 to 60 years; (vi) presenting history of pre-syncope and syncope episodes and MRS confirmed by tilt-table testing; (vii) estimated glomerular filtration rate (eGFR) >60 mL/min/1.73 m2 estimated by the Chronic Kidney Disease Epidemiology Collaboration (CKD-EPI) equation [5] (without microalbuminuria), and (viii) the capacity to read, comprehend, and sign the informed consent form and attend the clinical tests. The patients that presented any of the subsequent criteria were excluded: (i) pregnancy; (ii) valvular disease with significant adverse sequelae; (iii) unstable angina, myocardial infarction, transient ischemic attack or stroke within the 6 months before the procedure; (iv) renovascular abnormalities; (v) psychiatric disease; (vi) allergy to ionic contrast medium; (vii) the inability to be monitored clinically after the procedure; (viii) a known addiction to drugs or alcohol that affects the intellect; (ix) a serious health condition that, in the investigator opinion’s, may adversely affect the safety and/or efficacy of the participant or the study; (x) congestive heart failure presenting functional class II to IV symptoms according to New York Heart Association; (xi) syncope by other causes, as other cerebrovascular diseases, epileptic seizure, drug-induced, etc.
At baseline, all the patients were submitted to blood sampling for entire blood count and biochemistry (including serum creatinine to estimate GFR). Urine samples were obtained for determination of albuminuria, protein, and creatinine. Twenty-four hour ambulatory blood pressure monitoring (ABPM), 24-hour-Holter monitoring, CMRI, echo Doppler of carotid and vertebral arteries, EPS, tit table testing, and echo Doppler evaluation of the anatomy of the renal arteries of patients were also performed. The 33 subjects with MRS were consecutively included, based on a fully physician-patient discussion and after explanations about the procedure, patients were recruited to accept RSD intention or conventional management (control) at the patient’s discretion. We divided these patients into two groups, control group (n=20) and the group underwent RSD (n=13). The subjects underwent a complete medical history and physical examination, including a fully neurological examination. In both groups, the patients were treated in accordance with ESC guideline [6]. At the 6th month of follow-up the tit-table testing, 24-hour ABPM, 24-hour-Holter monitoring, blood and urine samples were performed and collected in all patients, and echo Doppler evaluation of the anatomy of the renal arteries of patients was performed in the patients underwent RSD.
Twenty-four-hour ABPM
ABPM was performed for 24 hours before each procedure with a clinically validated device (CardioMapa; Cardios, São Paulo, Brazil). The device was set to measure every 15 min during the day (06:00 to 22:00) and every 30 min during sleep (22:00 to 06:00). Patients were instructed to continue their regular activities during the recording and go to bed no later than 23:00. The waking period typically included 08:00 to 22:00 and the sleep period 24:00 to 06:00 [7]. All individuals were trained to record in a diary their sleeping and waking hours, meals, intake of medications, and any symptoms or events that could influence blood pressure during this period. Measurements were transferred to a computer for analysis. Monitoring was repeated as necessary until ≥70% of the measured values obtained during both daytime and nighttime were satisfactory [8].
Twenty-four-hour-Holter monitoring
Patients underwent 24-hour-Holter monitoring (Galix Biomedical Instrumentation, Florida, USA) at baseline and quarterly during the follow-up period to the nominated procedure. A three-channel recorder was used to record the electrocardiographic traces and to identify the minimum, mean and maximum heart rate and the rhythm.
Cardiac magnetic resonance
The CMR test was performed in all individuals at baseline using a 1.5-Tesla Achieva magnetic resonance image (MRI) scanner (Philips Healthcare, Best, the Netherlands), 1.5-Tesla Siemens Symphony, or a 1.5-Tesla Siemens Aera MRI system (Siemens Healthcare Sector, Erlangen, Germany). The images were taken using a composed steady-state unrestricted precession order throughout pauses in breathing of ~10–15 s using VCG propagation with subjects the supine position. The entire heart coverage from apex until the base was executed as earlier described [9]. Moreover, late gadolinium enhancement (LGE) was executed in each subject to evaluate the power of the procedure on scar muscle. The LGE imaging acquisition was made 10 to 15 min subsequently dose of 0.2 mmol/kg gadolinium DTPA with an inversion-recovery 3D rotted gradient echo series. The pre-beat postponement was unattached in sync rendering to a pre-pulse-delay locator (Look-Locker sequence). All CMR investigations were analyzed by operators, who were blinded to the intervention and patient management.
Cardiac magnetic resonance evaluation
Left ventricular (LV) mass extents and LV ejection fraction
The CMR evaluation was performed in accordance with the recommendations of the task force of the Society for Cardiovascular MR [10]. Off CMR examines were performed using the software Qmass MR Enterprise Solution (version 7.4, Medis, the Netherlands). The endo and epicardial limits were drawn robotically and improved by hand at end-diastole and end-systole, while the papillary muscles were left out from the LVM to reach enhanced reproducibility [11]. LV volumes and mass were planned using the summation of slices technique [12]. Left ventricular end-systolic (LVESVI) and end-diastolic volume index (LVEDVI) were standardized in every patient for sex, age, height, and weight [13]. LVM was then regularized and indexed against body exterior area (g/m2) [14]. The LV ejection fraction (LVEF) was estimated by Simpson’s method.
Left atrium
A looking back ECG-gated cine-MRI load was picked up in the short-axis orientation (casing the entire left atrium) with adjoining pieces for the calculation of left atrial volume (Simpson’s methodology) [15]. Simpson’s technique is proven according to Simpson’s documentations, which for this study, were fundamentally the summation of the cross-sectional zones of each portion bookkeeping for portion width and the break between slices [16,17]. This was calculated at the short-axis view of the cine-MRI by means of steady-state free-precession sequences and anatomical landmarks, with the exclusion of the pulmonary vein. The left atrial volume was considered normal up to 69 mL in men and 54 mL in women [16,17].
Scar zones
To detect the cardiac muscle fibrosis, LGE MRI was useful using the inversion-recovery gradient-echo sequences. The LGE pictures were counted visually by two experienced evaluators (blinded to other MRI and clinical data) at the period of the examination by means of a 17-segment archetypal [18]. Each segment was graded using the following point score: 0, absence of enhancement; 1, enhancement of 1%–25% transmurality; 2, enhancement of 26%–50% transmurality; 3, enhancement of 51%–75% transmurality, and 4, enhancement of 76%–100% transmurality [19]. The score per segment at that time was calculated by dividing the total score by 17 based on a 17-segment model [18].
Electrophysiological study
The patient was sedated by an anesthesiologist. The baseline electrocardiogram showed sinus rhythm. We performed four femoral vein punctures and introduced 4 valved sheaths 6F. Through these, we positioned a quadripolar catheter with fixed curve in the right atrium, one dirigible quadripolar catheter in the His bundle, another quadripolar catheter with fixed curve in the right ventricle, and a dirigible decapolar catheter into the coronary sinus, by the fluoroscopic view. The basal intervals were measured, the sinus node recovery time after atrial programmed electrical stimulation and the Wenckebach’s point was determinated. Atrial and ventricular programmed stimulations were performed for the exclusion of the symptom-relevant cardiac arrhythmias.
Tilt table testing
Tilt-testing allows the reproduction of reflex syncope in a laboratory situation. Positive responses in patients with neurally mediated syncope are 61-69%, and specificity is high (92-94%)6. All patients comprised in the study underwent a tilting test which was performed in a dedicated laboratory with subdued lighting and ambient temperature of 20°C to 22°C. Patients were required to have fasted for 4 h before the exam. They remained supine for half an hour and were then tilted to a 70° angle for 45 min or until they developed syncope episode. The motorized tilt table achieved 70° of tilt over 20 s. During the test, patients were restrained by two Velcro straps placed around the legs and waist, and any conversation other than reporting symptoms was discouraged. Continuous and noninvasive beat-to-beat HR and BP measurements were recorded. After a 30-min resting period (equilibrium), data were obtained for a resting period of 2 min at 70° angle (baseline condition) throughout the tilted period (5 min, and every 5 min afterwards until 45 min or syncope occurrence, and for 2 min after return to the supine position, i.e. post tilting period). The BP measurements were achieved by digital photoplethysmography (Finapres), a method previously described during tilt-table testing [20,21].
The corresponding waves were recorded and stored for a subsequent data analysis. An event marker on the pressure recordings was used to identify the start of each clinical symptom. The noninvasive pressure signals were acquired at 1,000 Hz by means of an analogic-digital multifunction card (DAQ Card-700; National Instruments Corp., Austin, Texas). All the signals were recorded on a personal computer (Acer, TravelMate 507-DX, Taipei Hsien, Taiwan, Republic of China). The data from each subject were reviewed and edited manually to remove artifacts (which consisted of the calibration intervals, devoid of pressure signal). Data from pressure signals were evaluated averaging 1-min periods at baseline, during up-tilting, down-tilting, the post-tilting, and throughout the 70°-tilted position: in particular at each 5 minutes (or until syncope) from the up-tilted position, by averaging 30 s before and 30 s after the selected time [22].
Echo Doppler of carotid and vertebral arteries
Echo Doppler was performed using a GE ultrasound system (Vivid I, General Electric, Frankfurt, Germany) equipped with an appropriated transducer for carotid and vertebral arteries, and it was performed by an experienced vascular-ultrasound physician. Notable stenosis or flow limitation at carotid and vertebral arteries was ruled out.
Renal sympathetic denervation
The RSD procedure has been described in detail previously [23], and the procedures were performed until one week after the first tilt-table testing. The patients remained hospitalized in the ward for 24 h after the procedure.
Statistical analysis
The results are expressed as a mean and standard deviation for normally distributed data and as median with interquartile range otherwise. All statistical tests were two-sided. Comparisons between two-paired values were performed with the paired t-test in cases of a Gaussian distribution or by the Wilcoxon test otherwise. Comparisons between more than two-paired values were made by repeated-measures analysis of variance or by Kruskal–Wallis analysis of variance as appropriate, complemented by a post-hoc test. Categorical variables were compared with Fisher’s exact test. A P-value <0.05 was considered significant. Correlations between two variables were performed by Pearson’s chi-square test in case of a Gaussian distribution and with the Spearman correlation test otherwise. All statistical analyses were performed using the program Graphpad Prism v 7.0 (Graphpad Software, La Jolla, CA, USA).
Results
Baseline characteristics of patients
The general features and the complimentary tests of the control group (n=20) and the group underwent RSD (n=13) are listed in Table 1.
Table 1. General features of patients at baseline
| |
|
|
Control group |
RSD group |
P value |
|
|
|
|
N |
20 |
13 |
--- |
Age, years |
40.2 ± 5.7 |
38.5 ± 6.0 |
0.4184 |
Body mass index, kg/m2 |
25.5 ± 4.0 |
26.0 ± 4.3 |
0.7356 |
Female sex (%) |
4 (20%) |
4 (31%) |
0.6806 |
White ethnicity (%) |
15 (75%) |
8 (62%) |
0.4611 |
Type 2 Diabetes Mellitus (%) |
2 (10%) |
1 (8%) |
>0.9999 |
Coronary artery disease (%) |
20 (100%) |
13 (100%) |
1.0000 |
Mixed reflex syncope (%) |
20 (100%) |
13 (100%) |
1.0000 |
Creatinine, mg/dL |
0.70 ± 0.15 |
0.74 ± 0.10 |
0.4047 |
eGFR, mL/min/1.73m² (CKD-EPI) |
108.7 ± 14.6 |
103.3 ± 12.7 |
0.2838 |
Mean 24-hour ABPM, mmHg |
118.0 ± 7.2/68.4 ± 3.5 |
116.3 ± 5.8/69.6 ± 4.0 |
0.4812/0.3699 |
24-hour-Holter minimum HR, bpm |
45.4 ± 6.7 |
48.2 ± 9.0 |
0.3136 |
24-hour-Holter average HR, bpm |
75.6±10.9 |
77.8 ± 12.0 |
0.5899 |
24-hour-Holter maximum HR, bpm |
128.5 ± 13.8 |
130.7 ± 16.1 |
0.6780 |
Cardiac MRI parameters |
|
|
|
Indexed LV mass/BSA, g/m2 |
72.3 ± 8.0 |
74.4 ± 6.9 |
0.4435 |
LVEF, % (Simpson) |
69.3 ± 6.4 |
67.8 ± 7.5 |
0.5431 |
LVEDVI, mL/m2 |
82.4±4.9 |
81.3±5.6 |
0.5556 |
LVESVI, mL/m2 |
31.5 ± 2.8 |
32.8 ± 1.7 |
0.1439 |
Indexed LA volume, mL/m2 |
25.6 ± 2.0 |
26.7 ± 1.8 |
0.1189 |
Myocardial scar score, % |
0 (0%) |
0 (0%) |
1.0000 |
Electrophysiological study |
|
|
|
Basal PR interval, ms |
157.4 ± 3.0 |
155.5 ± 3.7 |
0.1150 |
Basal QRS complex width, ms |
98.8 ± 1.9 |
99.6 ± 2.0 |
0.2557 |
Basal QTc interval, ms |
459.6 ± 12.0 |
462.0 ± 13.5 |
0.5968 |
Basal AH interval, ms |
84.5 ± 15.6 |
81.5 ± 17.7 |
0.6122 |
Basal HV interval, ms |
46.5 ± 6.3 |
47.8 ± 5.5 |
0.5477 |
Values are presented as Mean ± SD or %; ABPM, ambulatory blood pressure measurements; BSA, body surface area; EF, ejection fraction; eGFR, estimated glomerular filtration rate; HR, heart rate; LA, left atrium; LV, left ventricular; LVEDVI, left ventricular end-diastolic volume index; LVESVI, left ventricular end-systolic volume index; MRI, magnetic resonance images; N, number of patients.
Syncope events during tilt-Table testing
In the control group the systolic/diastolic BP at baseline at rest, before the tilt-table testing, was 122.5c8.6/79.5 ± 4.5 mmHg and 50.6 ± 9.3/37.8 ± 6.4 mmHg at the end (P<0.0001/P<0.0001). In the RSD group the systolic/diastolic BP at baseline at rest, before the tilt-table testing, was 127.4 ± 7.3/79.9 ± 5.1 mmHg and 52.5 ± 6.8/34.4 ± 6.8 mmHg at the end (P<0.0001/P<0.0001). At the 6th month of follow-up, the control group presented the systolic/diastolic BP at rest, before the tilt-table testing, 122.2 ± 7.4/81.9 ± 3.6 mmHg and 51.5 ± 9.1/38.5 ±5.5 mmHg at the end (P<0.0001/P<0.0001), as well as, the RSD group showed the systolic/diastolic BP at rest, before the tilt-table testing, 127.5 ± 7.2/82.3 ± 4.5 mmHg and 78.9 ± 8.5/59.5 ± 8.6 mmHg at the end (P<0.0001/P<0.0001). At the 6th month, the comparison between the control and the RSD groups for systolic/diastolic BP at the end of the tilt-table testing was significant (P<0.0001/P<0.0001), as well as, the comparison between baseline and 6th month in the RSD group for systolic/diastolic BP at the end of the tilt-table testing was significant (P<0.0001/P<0.0001), as shown in the Figures 1A and 1B. In the control group the HR at baseline at rest, before the tilt-table testing was 75.2 ± 9.7 bpm and 44.7 ± 9.5 bpm at the end (P<0.0001). In the RSD group the HR at baseline at rest, before the tilt-table testing was 80.1 ± 7.7 bpm and 51.7 ± 13.5 bpm at the end (P<0.0001). At the 6th month of follow-up, the control group presented the HR at rest, before the tilt-table testing, 76.6 ± 7.3 bpm and 49.4 ± 11.6 bpm at the end (P<0.0001), as well as, the RSD group showed the HR at rest, before the tilt-table testing, 78.5 ± 7.1 bpm and 67.2 ± 17.2 bpm at the end (P<0.0001). At the 6th month, the comparison between the control and the RSD groups for HR at the end of the tilt-table testing was significant (P=0.0078), as well as, the comparison between baseline and 6th month into the RSD group for HR at the end of the tilt-table testing was significant (P=0.0002), as shown in the Figure 1C.
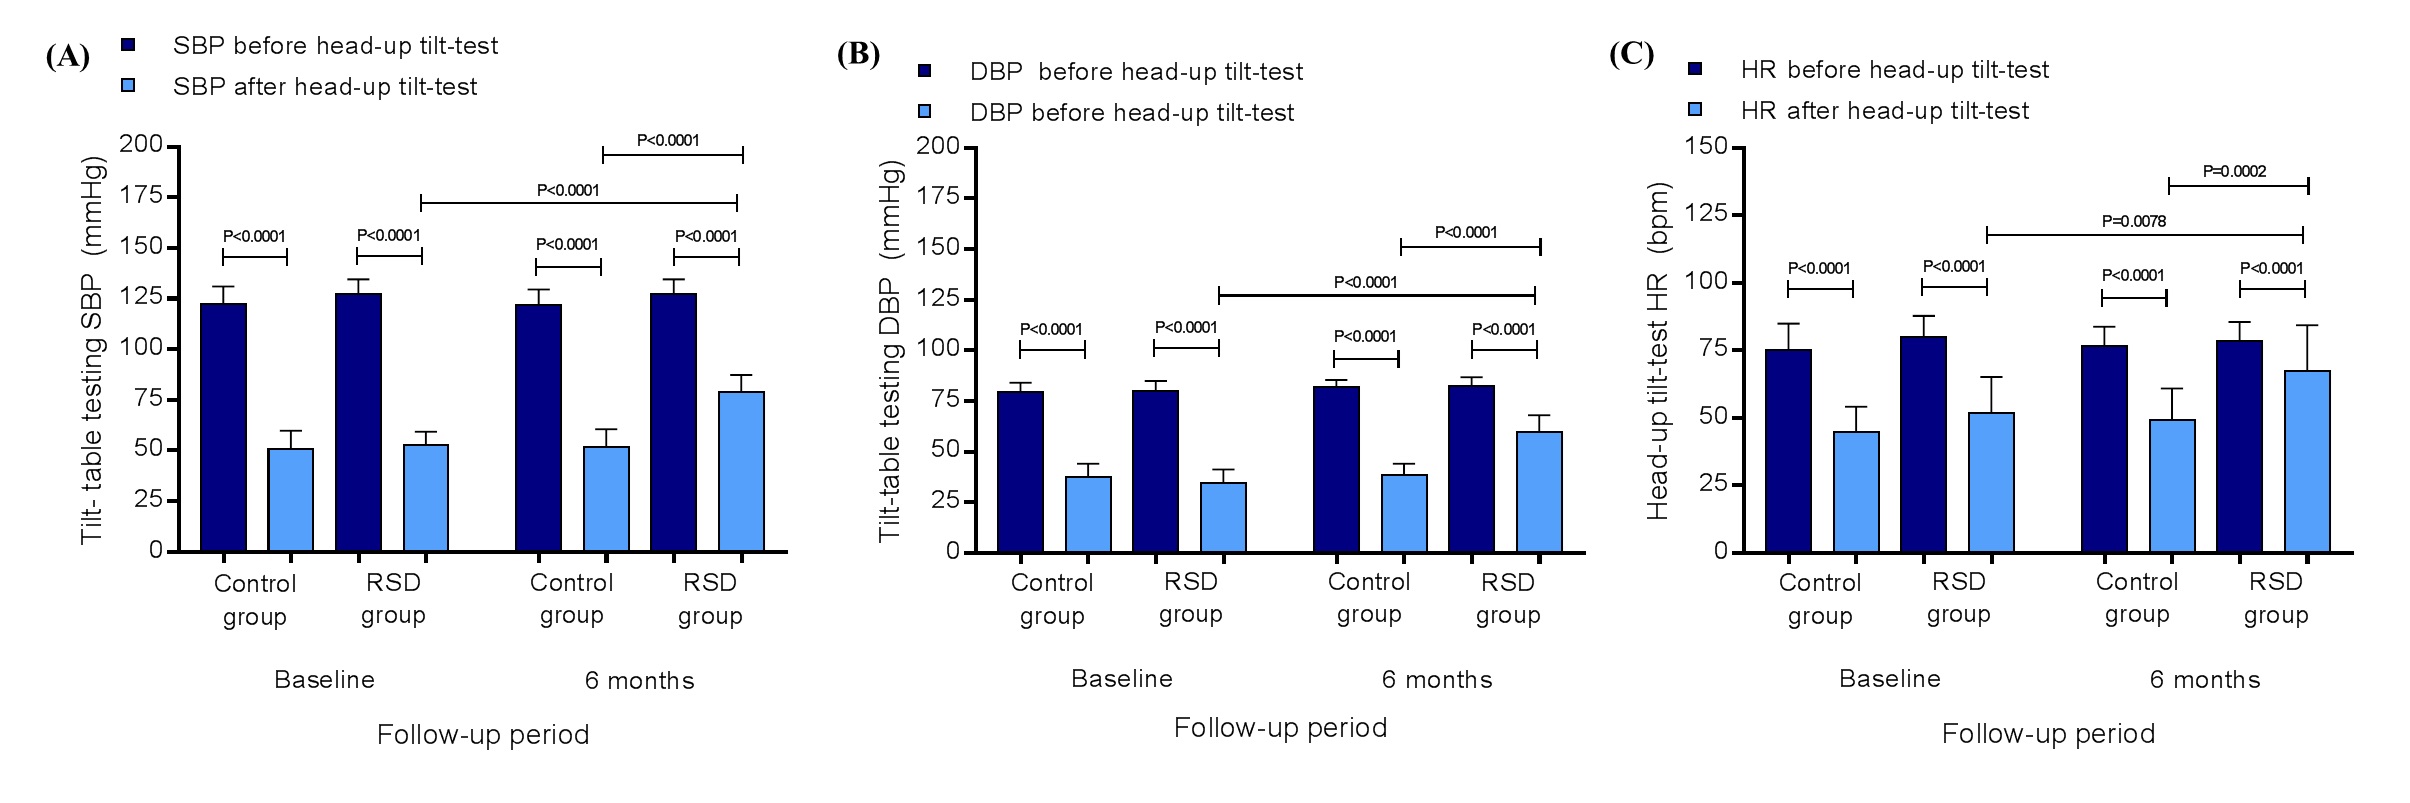
Figure 1. Systolic blood pressure (A), diastolic blood pressure (B), and heart rate (C) at rest and after the tilt-table testing in control group (n=20) and in RSD group (n=13), at baseline and at the 6th month of follow-up; DBP, diastolic blood pressure; HR, heart rate; RSD, renal sympathetic denervation; SBP, systolic blood pressure. Values are presented as mean ± SD.
Number of patients presenting reported events of pre-syncope/syncope during each month of follow-up
The percentage number of patients presenting reported pre-syncope at baseline, 1st, 2nd, 3rd, 4th, 5th, and 6th months were: 0%, 90%, 85%, 90%, 85%, 75%, and 75% in the control group, and 0%, 46%, 38%, 38%, 31%, 31%, and 15% in the RSD group, respectively. The comparison between each same time point was: P>0.9999, P=0.0135, P=0.0092, P=0.0048, P=0.0028, P=0.0286 and P=0.0013, respectively (Figure 2A). About events of syncope, the percentage number of patients presenting reported syncope at baseline, 1st, 2nd, 3rd, 4th, 5th, and 6th months were: 0%, 80%, 65%, 55%, 60%, 60%, and 55% in the control group, and 0%, 31%, 23%, 15%, 15%, 8%, and 8% in the RSD group, respectively. The comparison between each same time point was: P>0.9999, P=0.0096, P=0.0324, P=0.0325, P=0.0151, P=0.0036 and P=0.0090, respectively (Figure 2B).
Correlations
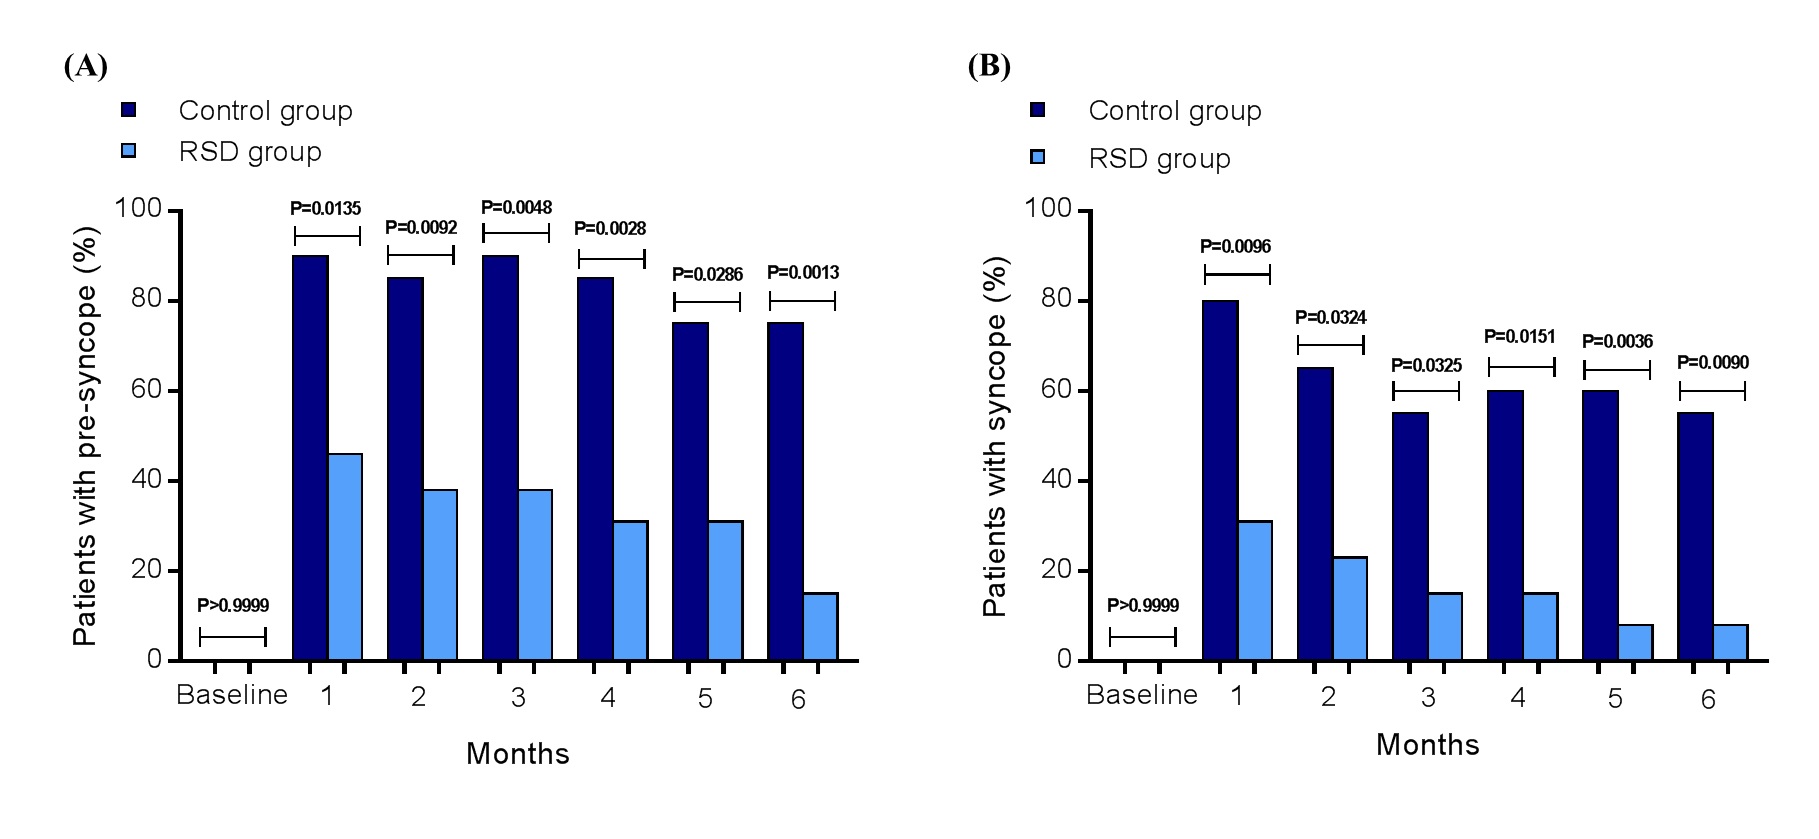
Figure 2. Number of patients (%) presenting spontaneous pre-syncope (A) and syncope (B) in the control group (n=20) and in the RSD group (n=13), at baseline, 1st, 2nd, 3rd, 4th, 5th, and at the 6th month of follow-up; RSD, renal sympathetic denervation.
As expected, the correlation between the decrease in SBP and events of syncope at baseline for control group was (by Pearson): r= -0.5050; 95%CI: -0.7745 to -0.0805; P=0.0231 and for RSD group: r= -0.5934; 95%CI: -0.8624 to -0.0630; P=0.0325. And at the 6th month of follow-up it was: r= -0.6303; 95%CI: -0.8389 to -0.2604; P=0.0029 for control group, and r= -0.6168; 95%CI: -0.8716 to -0.0997; P=0.0247 for the RSD group. Moreover, the correlation between the decrease in HR and events of syncope at baseline for control group was (by Pearson): r= -0.6409; 95%CI: -0.8440 to -0.2769; P=0.0023 and for RSD group: r= -0.7126; 95%CI: -0.9074 to -0.2662; P=0.0063. At the 6th month of follow-up it was: r= -0.8751; 95%CI: -0.9498 to -0.7059; P<0.0001 for control group, and r= -0.8384; 95%CI: -0.9504 to -0.5343; P=0.0003 for the RSD group.
ROC curves and percentage of events during tilt-table testing
The Receiver Operating Characteristic (ROC) curves from the decrease the decrease of SBP and was area under the ROC curve: 0.9931, 95%CI: 0.9805 – 0.9996, P<0.0001, sensitivity: 94%, specificity: 100%, cutoff point of ∆ SBP to trigger the syncope episode during the tilt-table testing: < -62.5 mmHg, and area under the ROC curve: 0.9772, 95%CI: 0.9326 – 0.9989, P<0.0001, sensitivity: 100%, specificity: 95%, cutoff point of ∆ HR to trigger the syncope episode during the tilt-table testing: < -20 bpm, respectively. At baseline, 90% of patients from the control group presented syncope during tilt-table testing vs. 85% of subjects from the RSD group (P>0.9999), as shown in Figure 3A. However, at the 6th month of follow-up, 75% of patients from the control group presented syncope during tilt-table testing vs. 15% of subjects from the RSD group (P=0.0013), as presented in Figure 3B.
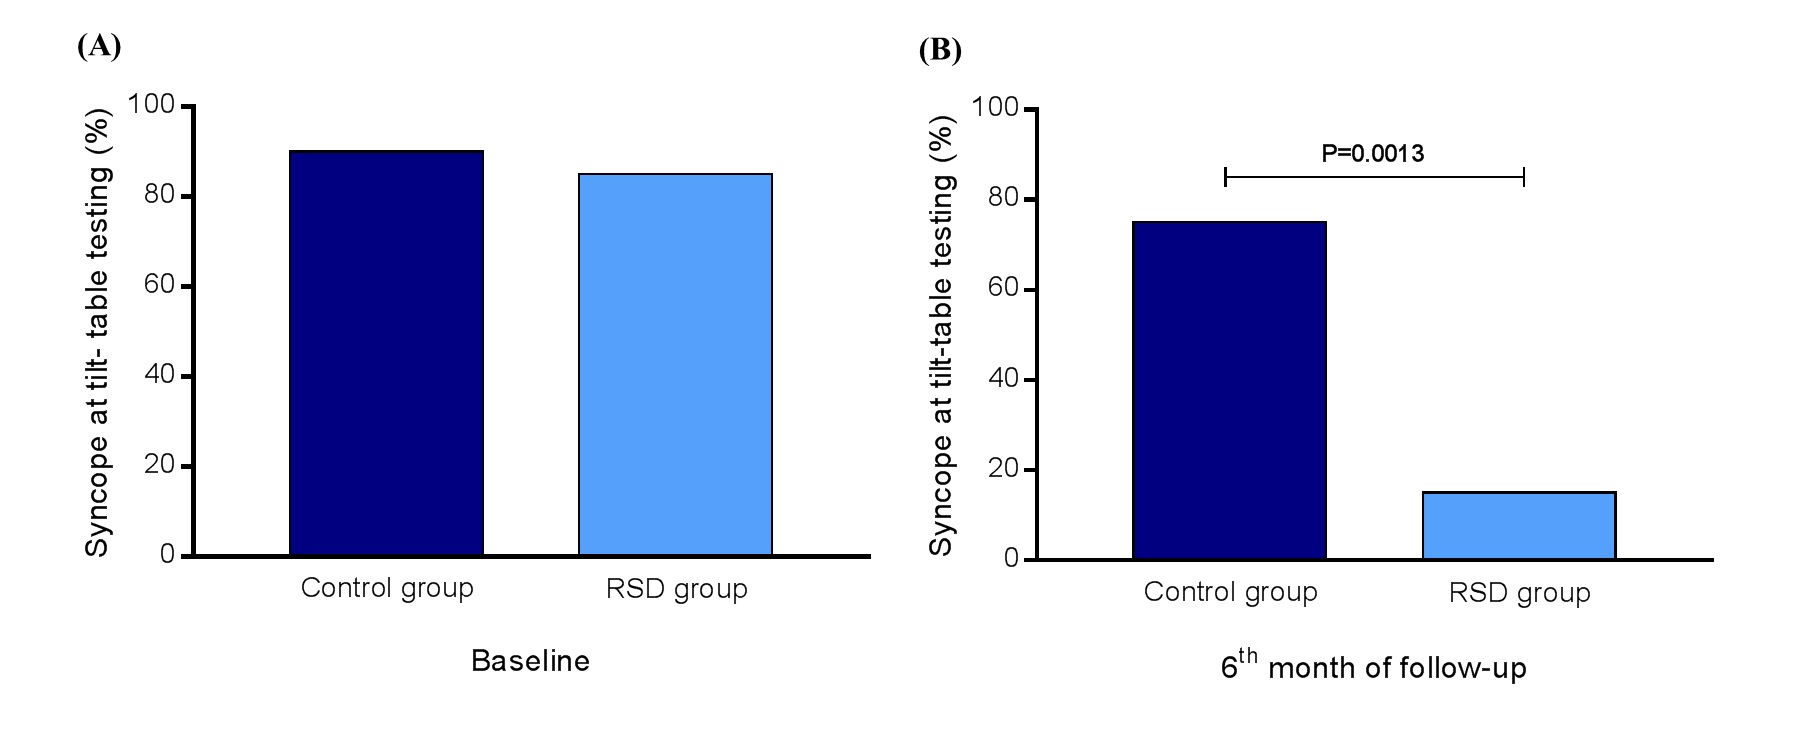
Figure 3. Events of syncope (%) at tilt-table testing at baseline and at the 6th month of follow-up in control group (n=20) vs. RSD group (n=13); RSD, renal sympathetic denervation
Efficacy in blood pressure, heart rate, and renal function
The variation (∆) between 24-hour systolic/diastolic ABPM was not significant from baseline to the 6th month of follow-up in the control group (∆=-1.5/+1.6 mmHg, P=0.9157/0.6703) and in the RSD group (∆=-1.3/+0.9 mmHg, P=0.9688/0.9554). The same comparison between both groups at the 6th month of follow-up did not differ (∆=-1.5/+0.5 mmHg, P=0.9390/0.9891). Analyzing the 24-hour-Holter monitoring we observed that the minimum/average/maximum HR did not differ from baseline to the 6th month of follow-up in the control group (∆=+1.8/+2.4/+4.5 bpm, P=0.8847/0.9049/0.7022) and in the RSD group (∆=-2.3/-3.5/+5.5 bpm, P=0.8755/0.8552/0.7116). The same comparison between both groups at the 6th month of follow-up did not differ (∆=-1.3/-3.7/+3.2 bpm, P=0.9658/0.7898/0.9034). The plasmatic creatinine values also did not differ from baseline to the 6th month of follow-up in the control group (∆=+0.03 mg/dL, P=0.9189) and in the RSD group (∆=-0.02 mg/dL, P=0.9859). The same comparison between both groups at the 6th month of follow-up did not differ (∆=-0.01 mg/dL, P=0.9976). Consequently, the eGFR also did not change from baseline to the 6th month of follow-up in the control group (∆=-5.4 mL/min/1.73m2, P=0.6894) and in the RSD group (∆=+3.4 mL/min/1.73m2, P=0.9436). The same comparison between both groups at the 6th month of follow-up did not differ (∆=+3.4 mL/min/1.73m2, P=0.9266).
Electrophysiological study
As shown in Table 1, the basal PR interval, QRS complex width, QTc interval, AH interval and HV interval are normal and did not differ between groups. The corrected time of sinus node recovery was normal; the His-Purkinje system was normal and electrical stimulation programmed atrial and ventricular did not induce any type of clinical-relevant arrhythmias, as well as, the right and left carotid sinus massage showed a physiological response, and did not differ between the both groups.
Safety
From the 13 patients who underwent RSD, no complication occurred. Real-time renal artery imaging was performed to assess eventual structural changes related to the procedure. Some small focal irregularities of the renal arteries that were present during the procedure (possibly due to minor spasm or oedema) were no longer seen postoperatively. At the 6th month after the procedure all the 13 patients underwent a Doppler scan of renal arteries without any evidence of stenosis or flow limitation.
Discussion
Our results reported that the tilt-table testing showed in both groups that the systolic/diastolic BP at baseline at rest had a significant reduction in comparison to the end of the exam. At the 6th month of follow-up, the both groups presented a significant decrease in the tilt-table testing systolic/diastolic BP from rest to the end of the exam. The comparison, at the 6th month, between the control and the RSD groups for systolic/diastolic BP changes at the end of the tilt-table testing was significant, as well as, the comparison between baseline and 6th month into the RSD group for systolic/diastolic BP variations at the end of the tilt-table testing was also significant. The HR at rest in both groups, at tilt-table testing baseline, suffered an important reduction in comparison to HR at the end of the exam. The same effect in both groups occurred in the 6th month of follow-up. At the 6th month, the comparison between groups showed a significant change in HR at the end of the tilt-table testing, as well as, the important variation between HR at baseline and at the 6th month into the RSD group at the end of the tilt-table testing. At baseline, almost the same percentage of patients from both groups presented syncope during tilt-table testing, instead of the distribution observed at the 6th month of follow-up, when 3/4 of patients from the control group presented syncope during tilt-table testing vs. less than 1/4 of subjects from the RSD group. And the number of patients presenting reported events of pre-syncope and syncope at each month during the follow-p time was expressive minor in the subjects underwent RSD than in the control group. The correlations between the systolic BP and HR decrease with syncope events were already expected in both groups. The cutoff points with high sensitivity and specificity revealed by the ROC curves were a fall of at least 62.5 mmHg for the systolic BP and at least 20 bpm for the HR.
As expected, in normotensive patients with normal heart evaluated by CMR and EPS, our results show that the ∆ between mean 24-hour systolic/diastolic ABPM, HR assessed by 24-hour-Holter monitoring, and eGFR using plasmatic creatinine was not significant from baseline to the 6th month of follow-up in the control individuals and in the RSD subjects, furthermore the same comparison between both groups at the 6th month of follow-up also did not differ.
2021 Copyright OAT. All rights reserv
MRS is triggered by an exaggerated sympathetic response to a situation; in other words, hyper-sympathetic excitation precedes the onset. Numerous issues are known to exacerbate and accelerate the MRS including (a) exhaustion, lack of fluids, and hypovolemia caused by hemorrhage, followed by reduced venous coming back; (b) blood shift and pooling in the lower body; (c) hypersensitivity of the stretch receptors in the left ventricular wall (that is the trigger considered to be crucial for the Bezold-Jarisch reflex), and; (d) fear, emotional stress, and reaction to pain [24]. The Bezold-Jarisch reflex acts an important role in the onset of this type of syncope. This reflex is generated by the cerebral hypoperfusion due to vagal-activation-mediated sympathetic suppression for the protection of myocardium [25]. This vagal activation may be produced by hyperactivity of the left ventricular wall, which initiates the stretch receptors in the wall and trabeculae, and in turn the C-fiber afferents to nucleus tractus solitaries (NTS) in the medulla, which triggers bradycardia and decreased myocardial contractility [26]. Raffel and colleagues [27] reported that 11C-GMO seems to be the first cardiac sympathetic nerve tracer possessing kinetics that can be investigated in a forthright manner to offer strong and sensitive quantitative measures of local heart sympathetic nerve concentration. These quantitative measures will allow to identify mild to moderate sympathetic nerve injuries that happen early in the progression of cardiac denervation, which is not conceivable with existing tracers such as 11C-HED and 123I-MIBG. In addition, 11C-GMO may find application in checking the effectiveness of fresh pharmacological treatments created to pause or reverse cardiac denervation in illnesses associated with heightened risk of sudden cardiac death, such as diabetic autonomic neuropathy and heart failure.
Recently, RSD was currently being investigated in multiple studies of sympathetically driven cardiovascular diseases such as heart failure and arrhythmias, to assess systemic and cardiac sympatholytic effects of RSD by the measurement of cardiac sympathetic activity and cardiovascular parameters. Berukstis and colleagues [28] reported that RSD offers an innovative and safe catheter-based approach for selective reduction of renal sympathetic drive, and perceived a significant modification in cardiac sympathetic nerve activity evaluated by 123I-MIBG scintigraphy, as an rise of late heart to mediastinum ratio, fluctuating from 2.21 ± 0.47 until 2.35 ±0 .52 m/s (p=0.02), which may also explain in part our results. So, inhibiting the hyper-sympathetic excitation that precedes the onset of pre syncope or syncope events by RSD, we can improve the daily symptoms and the evaluated tilt-table testing parameters.
Conclusion
In conclusion, in normotensive patients with normal cardiac function and recurrent mixed reflex syncope, RSD seems to reduce the clinical syncope and pre-syncope events at each point of follow-up, and improve the physical parameters in the tilt-table testing. These favorable effects by RSD appear not associated with additional risk of adverse events. Although encouraging, our data are preliminary and need to be validated in a large population and in the long term. If this were affirmed, RSD would be a potential tool to be incorporated in clinical practice to treat MRS.
Conflict of interest
None declared.
Funding
This study was funded by Pacemed (US $400,000), Rio de Janeiro, Brazil.
Acknowledgements
The authors are grateful to all participants included in this study. The authors also thank Pacemed for stimulating the development of this study and for providing technical support.
References
- Ganzeboom KS, Colman N, Reitsma JB, Shen WK, Wieling W (2003) Prevalence and triggers of syncope in medical students. Am J Cardiol 91: 1006-1008, A8. [crossref]
- Serletis A, Rose S, Sheldon AG, Sheldon RS (2006) Vasovagal syncope in medical students and their first-degree relatives. Eur Heart J 27: 1965-1970. [crossref]
- Colman N, Nahm K, Ganzeboom KS, Shen WK, Reitsma J, et al. (2004) Epidemiology of reflex syncope. Clin Auton Res 14 Suppl 1: 9-17. [crossref]
- van Dijk JG, Sheldon R (2008) Is there any point to vasovagal syncope? Clin Auton Res 18: 167-169. [crossref]
- Levey AS, Stevens LA, Schmid CH, Zhang YL, Castro III AF, et al. (2009) CKD-EPI (Chronic Kidney Disease Epidemiology Collaboration). A new equation to estimate glomerular filtration rate. Ann Intern Med 150: 604–612.
- Moya A, Sutton R, Ammirati F, Blanc JJ, Brignole M, et al. (2009) Task Force for the Diagnosis and Management of Syncope; European Society of Cardiology (ESC); European Heart Rhythm Association (EHRA); Heart Failure Association (HFA); Heart Rhythm Society (HRS) Guidelines for the diagnosis and management of syncope. Eur Heart J 30: 2631-2671.
- Stergiou GS, Kollias A, Destounis A, Tzamouranis D (2012) Automated blood pressure measurement in atrial fibrillation: a systematic review and meta-analysis. J Hypertens 30: 2074-2082.
- Mancia G, Fagard R, Narkiewicz K, Redon J, Zanchetti A, et al. (2013) ESH/ESC guidelines for the management of arterial hypertension: The Task Force for the Management of Arterial Hypertension of the European Society of Hypertension (ESH) and of the European Society of Cardiology (ESC). Eur Heart J 34: 2159-2219.
- Kelle S, Roes SD, Klein C, Kokocinski T, de Roos A, et al. (2009) Prognostic value of myocardial infarct size and contractile reserve using magnetic resonance imaging. J Am Coll Cardiol 54: 1770-1777. [crossref]
- Schulz-Menger J, Bluemke DA, Bremerich J, et al. (2013) Standardized image interpretation and post processing in cardiovascular magnetic resonance: Society for Cardiovascular Magnetic Resonance (SCMR) board of trustees task force on standardized post processing. J Cardiovasc Magn Reson 15: 35.
- Vogel-Claussen J, Finn JP, Gomes AS, et al. (2006) Left ventricular papillary muscle mass: relationship to left ventricular mass and volumes by magnetic resonance imaging. J ComputAssist Tomogr 30: 426–32.
- Papavassiliu T, Kuhl HP, van DockumW HMB, Bondarenko O, Beek IA, et al. (2004) Accuracy of one- and two dimensional algorithms with optimal image plane position for the estimation of left ventricular mass: a comparative study using magnetic resonance imaging. J Cardiovasc Magn Reson 6: 845–854.
- Maceira AM, Prasad SK, Khan M, Pennell DJ (2006) Normalized left ventricular systolic and diastolic function by steady state free precession cardiovascular magnetic resonance. J Cardiovasc Magn Reson 8: 417–426.
- Armstrong AC, Gidding S, Gjesdal O, Wu C, Bluemke DA, et al. (2012) LV mass assessed by echocardiography and CMR, cardiovascular outcomes, and medical practice. JACC Cardiovasc Imaging 5: 837-848. [crossref]
- Nacif MS, Barranhas AD, Türkbey E, Marchiori E, Kawel N, et al. (2013) Left atrial volume quantification using cardiac MRI in atrial fibrillation: comparison of the Simpson's method with biplane area-length, ellipse, and three-dimensional methods. Diagn Interv Radiol 19: 213-220.
- Hudsmith LE, Petersen SE, Francis JM, Robson MD, Neubauer S (2005) Normal human left and right ventricular and left atrial dimensions using steady state free precession magnetic resonance imaging. J Cardiovasc Magn Reson 7: 775-782.
- Artang R, Migrino RQ, Harmann L, Bowers M, Woods TD (2009) Left atrial volume measurement with automated border detection by 3-dimensional echocardiography: comparison with magnetic resonance imaging. Cardiovasc Ultrasound 7: 16.
- Cerqueira MD, Weissman NJ, Dilsizian V, et al. (2002) Standardized myocardial segmentation and nomenclature for tomographic imaging of the heart. A statement for healthcare professionals from the Cardiac Imaging Committee of the Council on Clinical Cardiology of the American Heart Association. Circulation 105: 539–542.
- Wu E, Judd RM, Vargas JD, Klocke FJ, Bonow RO, et al. (2001) Visualisation of presence, location, and transmural extent of healed Q-wave and non-Q-wave myocardial infarction. Lancet 357: 21-28. [crossref]
- Peterson MEV, Williams TR, Sutton R (1995) A comparison of noninvasive continuous finger blood pressure measurements (Finapres) with intra-blood pressure during prolonged head-up tilt. Eur Heart J 16: 1647–1654.
- Brignole M, Menozzi, Gianfranchi L, et al. (1991) Carotid sinus massage, eyeball compression and head-up tilt test in patients with syncope of uncertain origin and in healthy control subjects. Am Heart J 122: 1644 –1651.
- Romano SM, Lazzeri C, Chiostri M, Toso A, Foschi M, et al. (2002) Continuous recording of dicrotic and pulse pressures during head-up tilting test: the vasodepressive profile. Preliminary data. Ital Heart J 3: 665-672. [crossref]
- Kiuchi MG, Mion D Jr, Graciano ML, de Queiroz Carreira MA, et al. (2016) Proof of concept study: Improvement of echocardiographic parameters after renal sympathetic denervation in CKD refractory hypertensive patients. Int J Cardiol 207: 6-12.
- Fenton AM, Hammill SC, Rea RF, Low PA, Shen WK (2000) Vasovagal syncope. Ann Intern Med 133: 714-725. [crossref]
- Wallin BG, Sundlöf G (1982) Sympathetic outflow to muscles during vasovagal syncope. J Auton Nerv Syst 6: 287-291. [crossref]
- Salo LM, Woods RL, Anderson CR, McAllen RM (2007) Nonuniformity in the von Bezold-Jarisch reflex. Am J Physiol Regul Integr Comp Physiol 293: R714-720. [crossref]
- Raffel DM, Koeppe RA, Jung YW, Gu G, Jang KS, et al. (2013) Quantification of cardiac sympathetic nerve density with N-11C-guanyl-meta-octopamine and tracer kinetic analysis. J Nucl Med 54: 1645-1652. [crossref]
- Berukstis A, Vajauskas D, Gargalskaite U, Misonis N, Burneikaite G, et al. (2016) Impact of renal sympathetic denervation on cardiac sympathetic nerve activity evaluated by cardiac MIBG imaging. Euro Intervention 11: 1070-1076.