Editorial
In the previous and this edition of FGNAMB I presented the evidence for a series of rectangular wave infectious-like events which show slow spatial spread, and endure for around 12 months before abating. This unique spatiotemporal spread appears to explain entirely anomalous behaviour in medical admissions observed between 2008 and 2013 in Wigan(near Manchester), and in North East Essex following the 2008 event [1,2].
To my knowledge such infectious behaviour has never been previously documented, probably because it is considered to be impossible. As pointed out, with over 1,400 infectious agent’s specific to humans [3], a number which increases every year, along with potential complex interactions between pathogens, it may be premature to declare that novel types of infectious outbreaks are impossible.
Evidence has also been recently presented to show that the effect on deaths appears to occur across all western countries in both northern and southern hemispheres [4,5].Also in this edition is evidence to show that these events create a fatal flaw in hospital mortality models, which incorrectly assume that such small area perturbations in mortality do not exist [6].
Fig. 1 gives an example of these apparent outbreaks as observed for the whole of Arizona and three relatively large counties within Arizona. During the time series available for Arizona there are five possible outbreaks which show maximum deaths in the UK during the calendar years 2003, 2008, 2010, 2012 and 2014 [7]. It has been observed that on some occasions the US may lag behind the UK in terms of initiation and this seems to apply for the 2003 event [8]. In such relatively large areas the event does not always appear as a prominent feature. This appears to be the case for the 2010 event which was also highly variable in the UK [1,8],but far more prominent in Australia [9]. Differences in the shape and timing of initiation for the events are also apparent.
When presented with a new concept it is always useful to see if the observed behaviour can be replicated by some type of model. A simple Excel spreadsheet has been used to replicate the behaviour and the results are summarised in Table 1,with the most complex simulation shown in Figure 2.In all simulations the initiation of the outbreak occurs across a 24 month period, which is commonly observed to occur during these events [1,8]. In simulation 1 to 3 there are 10 deaths per month jumping to 15 for the 12 months of the outbreak in each smaller area. The size of the larger area increases from 4 to 6 smaller areas, however in all simulations the disposition of the start dates are weighted toward the start of the outbreak which occurs in month 13 in area A. The more complex simulation has six areas but the magnitude of the increase varies considerably between the smaller areas.
Simulation |
Number of Small Areas |
Increase per area |
Average Deaths |
Step-up |
Step-down |
Start Month No |
Apparent
Magnitude |
Start Month No |
Apparent Magnitude |
1 |
4 |
50% |
531 |
14 |
27% |
31 |
24% |
2 |
5 |
50% |
664 |
14 |
26% |
34 |
27% |
3 |
6 |
50% |
797 |
13 |
28% |
31 |
25% |
4 |
6 |
20% to 300% |
872 |
14 |
49% |
34 |
55% |
Table 1.Four simulations of a rectangular wave event moving between smaller areas as part of a larger spatial unit. The simulated start occurs in month 13.
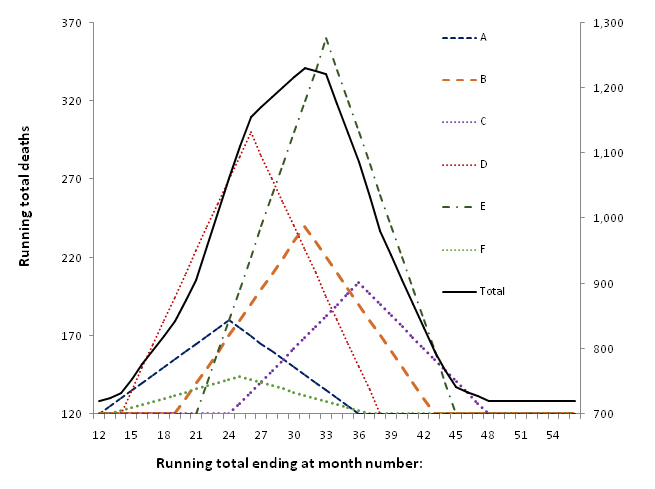
Figure 2. Six rectangular wave events each with different magnitude and timing moving within a larger area
As can be seen in Table 1,both the apparent magnitude and the start date for the step-up (initiation) and step-down (cessation) are influenced by the disposition of the component smaller areas and each generates a different shape for the overall total. Simulation three (6 smaller areas with equal magnitude increase) has a marked plateau between months 26 and 31, which is simply an artefact of the distribution of the initiation dates.
In the more complex simulation in Figure 2 the apparent initiation in the larger area is influenced by early and large initiation in area D, while the apparent step-down is influenced by the very large event in area E which occurs toward the middle of the entire 24 month spread.
Hence it is reasonably easy to generate the wide variety of shapes observed in the real world (Figure 1),and in the study of emergency medical admissions in Wigan and North East Essex [1,2],by mixing rectangular waves of different initiation date and magnitude. We therefore have reasonable grounds to conclude that the apparently bizarre trends seen in deaths and medical admissions around the world [4,10] are the end result of highly granular/heterogeneous but slow spatiotemporal spread of an apparently infectious agent throughout the multitude of social networks present in the wider population.A recent repeat of these events in 2014 showed unusually high spatiotemporal synchrony, and consequently led to unprecedented increases in deaths throughout England and Wales with knock-on financial pressures relating to the associated medical admissions [11].
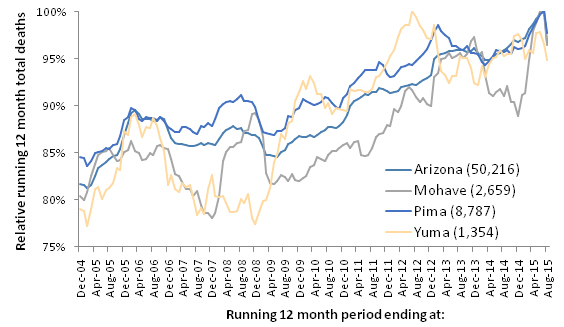
Figure 1.Running 12 month total deaths for counties in Arizona (relative to the maximum count of deaths). Most recent count of deaths is in brackets.
Footnote: Monthly deaths (all-cause mortality) for counties in Arizona between 2004 and 2015 were obtained from the Arizona Health Services website (http://www.azdhs.gov/plan/mu/index.php).
References
- Jones R (2015) Small area spread and step-like changes in emergency medical admissions in response to an apparently new type of infectious event. Fractal Geometry and Nonlinear Anal in Med and Biol1: 42-54.
- Jones R (2015) Infectious-like spread of an agent leading to increased medical hospital admission in the North East Essex area of the East of England. Fractal Geometry and Nonlinear Anal in Med and Biol 1: 97-110.
- Woolhouse M, Gowtage-Sequeria S (2005) Host range and emerging and reemerging pathogens. Emerg Infect Dis 11: 1842-1847.[Crossref]
- Jones R (2015) Deaths and health care expenditure. Brit J Healthc Manage21: 491-493.
- Jones R (2016) Is cytomegalovirus involved in recurring periods of higher than expected death and medical admissions, occurring as clustered outbreaks in the northern and southern hemispheres? Brit J Med Medical Res11: 1-31.
- Jones R (2015) A ‘fatal’ flaw in hospital mortality models: How spatiotemporal variation in all-cause mortality invalidates hidden assumptions in the models. Fractal Geometry and Nonlinear Anal in Med and Biol 1: 82-96.
- Jones R (2015) Are emergency admissions contagious? Brit J Healthc Manage21: 227-235.
- Jones R (2015) A previously uncharacterized infectious-like event leading to spatial spread of deaths across England and Wales: Characteristics of the most recent event and a time series for past events. Brit J Med Medical Res 5: 1361-1380.
- Jones R (2015) A time series of infectious-like events in Australia between 2000 and 2013 leading to extended periods of increased deaths (all-cause mortality) with possible links to increased hospital medical admissions. Int J Epidemiologic Research2: 53-67.
- Jones R (2015) Recurring Outbreaks of an Infection Apparently Targeting Immune Function, and Consequent Unprecedented Growth in Medical Admission and Costs in the United Kingdom: A Review. Brit J Med Medical Res6: 735-770.
- Jones R (2016) The real reason for the huge NHS overspend? Brit J Healthc Manage22: 40-42.