We have previously reported the association between neuropeptide Y2 receptor (NPY2R) gene promoter SNPs and plasma HDL-cholesterol levels in healthy subjects. To clarify this mechanism, we constructed pGL3-Basic plasmid with NPY2R gene promoter with rs6857530GG+rs6857715TT (G+T) or rs6857530AA+ rs6857715CC (A+C), and measured luciferase activity in cultured HepG2 cells, macrophages, and adipocytes. Luciferase activities of (G+T) were detected in HepG2, and (A+C) detected in macrophage. On the other hand, luciferase activities of (G+T) and (A+C) did not differ from those of control pGL3-Basic plasmid without inserts. Mobility shift assay revealed one specific shift bands using HepG2 nuclear extracts and both oligonucleotide with SNP rs6857530A and G, while it revealed another specific shift band with SNP rs6857530G. Mobility shift assay revealed one specific shift band using macrophage nuclear extracts and oligonucleotide with SNP rs6857530G but not with SNP rs6857530A. From these results, SNP- and cell type-dependent expression of NPY2R may be a relevant factor to understand the mechanism underlying the association between NPY2R SNPs and plasma HDL-cholesterol levels.
neuropeptide Y, neuropeptide Y2 receptor, SNPs, HepG2, macrophage, adipocyte, luciferase activity, mobility shift assay, high-density lipoprotein
Neuropeptide Y (NPY) is known as orexigenic peptide that stimulates appetite in the hypothalamus through NPY1 receptor (NPY1R) [1]. NPY plays pleiotropic roles not only through NPY1R but NPY2R and NPY5R in human [2]. NPY rather inhibits appetite through hypothalamic NPY2R in rodents and human [3,4]. However, the previous report has demonstrated stress-induced visceral obesity through NPY2R in the liver and adipose tissues including macrophages in mice [5]. Stress stimulates not only cortisol release from adrenal cortex but also catechol amines and NPY release from sympathetic nerve terminals. NPY also induces ischemic angiogenesis and plaque instability in human vascular tissues through NPY2R [6]. We have previously investigated the association between 5’-flanking region of NPY2R gene SNPs and metabolic traits in subjects coming to the city health center for health checkups [7]. Plasma high-density lipoprotein (HDL)-cholesterol levels were significantly different in subjects with each SNP types (rs6857530; GG<GA<AA or rs6857715; TT<TC<CC). However, the mechanism underlying the association between NPY2R gene variants and plasma HDL-cholesterol levels is still to be clarified. In the present study, we have constructed reporter plasmid of NPY2R gene SNPs rs6857530 or rs6857715 and examined the luciferase activity using these constructs transiently transfected in HepG2, macrophage, and adipocytes. To understand the mechanism of SNP-dependent luciferase activity, we also performed mobility shift assay using oligonucleotides containing SNP rs6857530 type and nuclear extracts of HepG2 and macrophages.
Construction of reporter plasmid
Sequence -662 to +13 from the transcription start site of NPY2R gene including SNP rs6857530GG and SNP rs6857715TT (G+T) or SNP rs6857530AA and SNP rs6857715CC (A+C) were amplified from blood cell DNA using primers (forward primer; 5’-GCAGACACCTGTTAGGGAAATTGCTG-3’, and reverse primer 5’-TCTCAGCCGCCTCCCGGGCTTGCAA-3’) (Figure 1a). DNA was extracted from whole blood cells in subjects with indicated SNP types using the phenol-chloroform method as described previously [8,9]. Our study was approved by the research ethical committee of the University of Hyogo [7]. PCR product and pT7 Blue-vector (Novagen) (Figure 1b) were ligated according to manufacturer’s protocol. After subcloning, this construct and pGL3-Basic/promoter vectors (Promega Corp., Madison, WI) (Figure 1-b) were digested with restriction enzymes Hind III and Kpn I (New England Biolabs, Ipswich, MA) and ligated according to manufacturer’s protocol. After cloning, we obtained pGL3-Basic plasmid with (G+T) or (A+C) and confirmed the DNA inserts of the plasmid by DNA sequencing using autosequencer (Applied Biosystems) (Figure 1c).
Figure 1. For the luciferase experiments, sequence -662 to +13 from the NPY2R gene transcription start site was amplified from blood cell DNA with each SNPs using primers (a). Luciferase promoter plasmid pGL3-Basic, pRL-SV40 for normalization of luciferase assay and pT7 Blue are illustrated (b). PCR products were TA cloned, and then reinserted into the pGL3-Basic plasmid. Correct orientation and SNP typing of DNA insert were confirmed by DNA sequencing (C).
Cell culture
The human hepatoma cell line HepG2 (JCRB1371), the human acute monocytic leukemia cell line THP-1 (JCRB0112.1), and the mouse fibroblast cell line 3T3-L1 (IF050416) were obtained from JCRB cell bank in National Institute of Biomedical Innovation (Osaka, Japan). HepG2 cells were cultured in DMEM with 1 g/L glucose, 1% L-glutamine, 10% fetal bovine serum (FBS) (GIBCO). THP-1 cells were cultured in RPMI 1640 medium with 5% FBS and were differentiated to macrophage by adding 160 nM phorbol 12-myristate 13-acetate (LC Laboratories, Woburn, MA). 3T3-L1 cells were cultured in DMEM with 1 g/L glucose, 1% L-glutamine, 10% FBS and were differentiated to adipocytes by initially adding 170 nM insulin (SAFC Biosciences) + 0.5 mM IBMX (SIGMA) + 250 nM dexamethasone and subsequently adding 170 nM insulin [10]. All cell cultures were performed at 37 C, 5% CO2 in a humidified incubator, and the medium was changed every 2-3 days.
Luciferase reporter assay
All cells were seeded in 12-well plates. THP-1 cells were differentiated to macrophage 1 day after the addition of phorbol 12-myristate 13-acetate. 3T3-L1 cells were differentiated to adipocytes 2-3 weeks after the addition of initial cocktail. When HepG2 cells were sub-confluent, and macrophage and adipocytes continued to be stable at least one week after the differentiation, cells were co-transfected with 1 µg of indicated plasmids or control plasmids without inserts and 10 ng of the pRL-SV40 plasmid containing SV40 promoter linked to a constitutively expressing Renilla luciferase reporter gene (Promega) (illustrated in Figure 1b). Transfections were performed for 24 hours using FuGENE (Promega). The cells were harvested according to manufacturer’s instructions and luciferase activity was determined using the Dual-Luciferase Reporter Assay System (Promega) and a Turner design luminometer TD-20/20 (Promega, Tokyo, Japan) as described previously [11]. All data were normalized to Renilla luciferase activity. The experiments were done at least three times in quadruplicate. Statistical siginificance was assessed by analysis of variance using SPSS (IBM SPSS, v. 22.0).
Mobility shift assay
Mobility shift assay was performed by methods slightly different from those used in our previous reports [11,12]. Briefly, nuclear extracts of HepG2 were prepared using NE-PER Nuclear and Cytoplasmic Extraction Kit (Thermo Scientific). Mobility shift reaction was carried out using
LightShift Chemiluminescent EMSA kit (Thermo Scientific) according to manufacturer’s instructions. Reaction mixture included 20 μl consisting of nuclear extract, binding buffer, 2.5% glycerol, 5 mM MgCl2, 50 ng/μl poly (dI/dC), 0.05% NP-40, and 40 fmole biotin-labeled oligonucleotide containing
SNP rs6857530G or rs6857530A. Unlabeled (competitor) or 5’-biotinylated oligonucleotide with rs6857530G (5’-GCTGATCATGGGCGGCAGGATCTGAACTCG-3’) or rs6857530A (5’-GCTGAT CATGGGCAGCAGGATCTGAACTCG-3’) was synthesized (GENEray Biotechnology). For competition assays, 0.8 to 8 pmole unlabeled oligonucleotides were added as competitors. Binding reaction was performed for 20 min. The complexes were separated on a 6% polyacrylamide gel in 0.5 x TBE. After electrophoresis, gel was electro-transferred at 380 mA for 30 min to nylon membrane. After cross linking by trans-illuminator, blotted membrane was washed, blocked and reacted with streptavidin-horseradish peroxidase solution. After reacting with luminol/enhancer solution, the membrane was exposed to ECL mini-camera (Amersham Pharmacia Biotech).
We performed luciferase assays in HepG2, macrophage differentiated from THP-1, and adipocytes differentiated from 3T3-L1 to study whether the NPY2R cis-regulatory regions (-662 to +13 sequence from transcription initiation site) including SNPs rs6857530G+rs6857715T (G+T) or rs6857530A+ rs6857715C (A+C) can induce transcriptional activity. We co-transfected the cell lines with pGL3-Basic promoter plasmid containing (G+T) or (A+C), or pGL3-Basic promoter plasmid without insert (control) and pRL-SV40 (containing the Renilla luciferase) for normalization. Relative luciferase activity of cell lysates from HepG2 with pGL3-Basic plasmid inserted by (G+T) was 4.9 ± 3.0 (mean ± SD) which was significantly higher than (A+C); 1.48 ± 0.76 (P<0.05), and control; 1.0 ± 0.3 (P<0.05) (Figure 2a). On the other hand, relative luciferase activity of cell lysates from macrophage with pGL3-Basic plasmid inserted by (A+C) was 2.72 ± 0.48, which was significantly higher than (G+T); 1.5 ± 0.51 (P<0.05) and control; 1.0 ± 0.21 (P<0.05) (Figure 2b). Luciferase activity of cell lysates from adipocytes with pGL3-Basic plasmid inserted by (G+T) and (A+C) were not detected (G+T; 1.07 ± 0.21, A+C; 1.08 ± 0.15 and control; 1.0 ± 0.07, P=0.694) (Figure 2c).
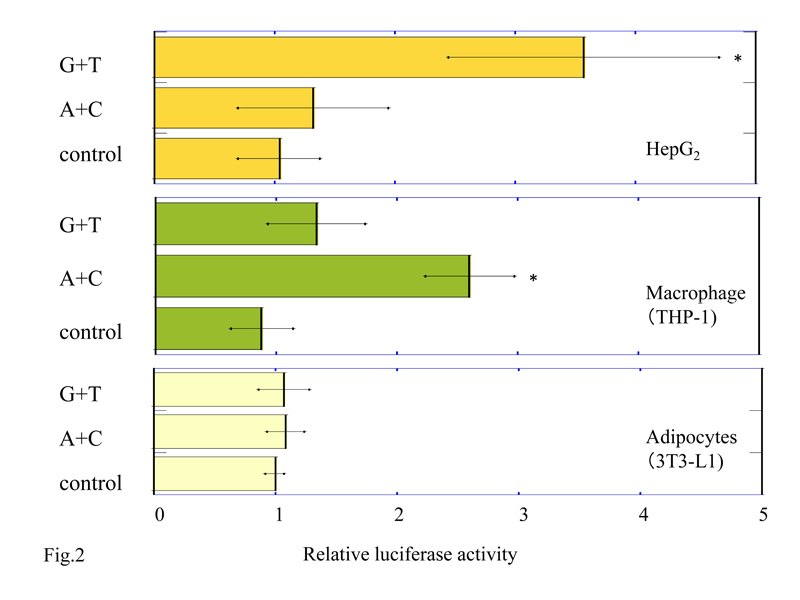
Figure 2. Luciferase activity in HepG2 cells (a), macrophages differentiated from THP-1 cells (b), and adipocytes from 3T3-L1 cells (c) transfected by 5’-NPY2R gene with SNPs rs6857530G+rs6857715T (G+T) or rs6857530A+rs6857715C (A+C). Each bar represents mean +/-standard deviation. *P<0.05 vs. control and (A+C) in HepG2 (a). *P<0.05 vs. control and (G+T) in macrophages (b). Control; pGL3-Basic plasmid without inserts.
SNP rs6857530 is located at the putative Sp1 consensus cite 5’-(G/T)GGGCGG(G/A)(G/A)(C/T) -3’. SNP rs6857530G accords 80% of this consensus sequence, while SNP rs6857530A accords 70%. To clarify the cause of the SNP- and cell type-dependent transcriptional activity, mobility shift assay was performed using oligonucleotides with rs6857530G or rs6857530A and nuclear extracts of HepG2 or macrophages. Mobility shift assay revealed a similar band when the assay used nuclear extracts of HepG2 and oligonucleotide with rs6857530A or rs6857530G (Figure 3a, arrow A). In addition, mobility shift assay revealed another band only when the assay used oligonucleotide with rs6857530G (Figure 3a, arrow B). Mobility shift assay revealed a single band when the assay used nuclear extracts of macrophage and oligonucleotide with rs6857530G but not rs6857530A (Figure 3b). All of these appeared specific shift bands because bands were not detected without adding nuclear extracts and less clear by dose-dependent addition of unlabeled competitor.
Figure 3. Mobility shift assay revealed specific shift bands using nuclear extracts of HepG2 cells (a) and macrophages (b) with oligonucleotides of cis-regulatory region of NPY2R gene containing rs6857530A and rs6857530G.
We have previously shown that NPY2R upstream gene SNPs associates with plasma HDL-cholesterol levels in healthy subjects. Liver cells, adipocytes, and macrophages are important to determine plasma HDL-cholesterol levels. Since this SNP is located on the cis-regulatory region of NPY2R gene, we hypothesized that NPY2R gene expression is dependent on this SNP type in HepG2, macrophages differentiated from THP-1, adipocytes from 3T3-L1 as a model of these cells. Transcriptional levels of NPY2R gene were low or absent assessed by luciferase assay irrespective of SNP types or cell types. It was consistent with the data in such as Gepis Tissue or GeneCards. These data base showed that NPY2R gene were ubiquitously expressed in a variety of cells including the liver, adipocytes and monocytes but the expression levels were quite low. Interestingly, the present study demonstrated that the luciferase activity of pGL3-Basic plasmid inserted by NPY2R gene upstream with SNPs (G+T) was detected in HepG2 cells and that with SNPs (A+C) was detected in macrophages (Figure 2). It is interesting to speculate that hepatic NPY2R is expressed in subjects with SNPs (G+T) but not with (A+C) to decrease plasma HDL-cholesterol levels and that NPY2R is expressed in macrophages of subjects with SNPs (A+C) but not with (G+T) to raise plasma HDL-cholesterol levels. Liver expressed major regulators of plasma HDL-cholesterol such as apolipoprotein A1 (Apo A1), ApoA1 binding protein, cholesterol ester transfer protein (CETP), lecithin cholesterol acyl transferase, scavenger receptor-B1, and hepatic lipase [13-15]. THP-1 expressed major regulators of plasma HDL-cholesterol such as ATP binding cassette A1 and ATP binding cassette G1 [16,17]. Further studies are required to examine how the expression of molecules involved in HDL metabolism are regulated by NPY through NPY2R in HepG2 and macrophage. The luciferase activity of pGL3-Basic plasmid inserted by NPY2R gene upstream with SNPs both (G+T) and (A+C) was not detectable in adipocytes (Figure 2), suggesting that the difference of plasma HDL-cholesterol levels is unlikely attributable to the SNP dependent difference of NPY2R expression in adipocytes. However, we cannot exclude the possibility that the absence of luciferase activity is due to the species difference of preadipocytes. Human preadipocyte cell line was not available.
The sequence around rs6857715 did not include the consensus sequence possible to bind known transcription factors (DNASIS-Mac v3.2; Hitachi Tokyo, Japan). Thus, the mechanism underlying the association between NPY2R gene SNP rs6857715 and plasma HDL-cholesterol levels remains unclarified. However, the sequence around rs6857530 included the consensus sequence possible to bind Sp1. It was reported that Sp1 is a zinc finger transcription factor that binds to G-C rich motifs of many promoters and is involved in a variety of processes such as cell growth, apoptosis, differentiation and immune responses [18-20]. In the present study, mobility shift assay demonstrated similar complex of HepG2 nuclear extracts with oligonucleotide containing rs6857530G or rs6857530A and another complex with oligonucleotide containing rs6857530G (Figure 3a). On the other hand, mobility shift assay demonstrated single complex of nuclear extracts of macrophage with rs6857530G but not rs6857530A (Figure 3b). If a band shown by arrow A in Figure 3a and that by arrow in Figure 3b is assumed to include a repressor and a band shown by arrow B in Figure 3a include an activator, it may be consistent with SNP- and cell type-dependent transcriptional activity, although it needs another assumption that the activator is more dominantly effective than the repressor to activate transcription of NPY2R gene with SNP rs6857530G in HepG2. It is still to be clarified what kinds of transcription factors are relevant for determining SNP- and cell-dependent NPY2R gene transcriptional activity.
These results suggest that expression of NPY2R gene with (G+T) in hepatocytes and those with (A+C) in macrophages may determine, at least in part, plasma HDL-cholesterol levels. Recent drugs such as CETP inhibitor could raise plasma HDL-cholesterol levels without adverse hypertension but not reduce the risk of recurrent cardiovascular events [21]. Thus, it is still controversial whether simple reduction of plasma HDL-cholesterol is beneficial. Moreover, HDL has pleiotropic effects including immune functions [22]. Although further studies are required to understand the more precise underlying mechanism, NPY2R may be a useful therapeutic target for hypo HDL-cholesterolemia in subjects with specified NPY2R gene SNPs.
- Mullins D, Kirby D, Hwa J, Guzzi M, Rivier J, et al. (2001) Identification of potent and selective neuropeptide Y Y(1) receptor agonists with orexigenic activity in vivo. Mol Pharmacol 60: 534-540. [Crossref]
- Kaji H (2013) Neuropeptide Y and its receptors: molecular structure and pathophysiological role in food intake and energy homeostasis. In Neuropeptide Y ed. by Parker SL. Nova Science Publisher, 39-82.
- Batterham RL, Cowley MA, Small CJ, Herzog H, Cohen MA, et al. (2002) Gut hormone PYY(3-36) physiologically inhibits food intake. Nature 418: 650-654. [Crossref]
- Degen L, Oesch S, Casanova M, Graf S, Ketterer S, et al. (2005) Effect of peptide YY3-36 on food intake in humans. Gastroenterology 129: 1430-1436. [Crossref]
- Kuo LE, Kitlinska JB, Tilan JU, Li L, Baker SB, et al. (2007) Neuropeptide Y acts directly in the periphery on fat tissue and mediates stress-induced obesity and metabolic syndrome. Nat Med 13: 803-811. [Crossref]
2021 Copyright OAT. All rights reserv
- Pankajakshan D, Jia G, Pipinos I, Tyndall SH, Agrawal DK (2011) Neuropeptide Y receptors in carotid plaques of symptomatic and asymptomatic patients: effect of inflammatory cytokines. Exp Mol Pathol 90: 280-286. [Crossref]
- Takiguchi E, Fukano C, Kimura Y, Tanaka M, Tanida K, et al. (2010) Variation in the 5'-flanking region of the neuropeptide Y2 receptor gene and metabolic parameters. Metabolism 59: 1591-1596. [Crossref]
- Takahashi Y, Kaji H, Okimura Y, Goji K, Abe H, et al. (1996) Brief report: short stature caused by a mutant growth hormone. N Engl J Med 334: 432-436. [Crossref]
- Kaji H, Nose O, Tajiri H, Takahashi Y, Iida K, et al. (1997) Novel compound heterozygous mutations of growth hormone (GH) receptor gene in a patient with GH insensitivity syndrome. J Clin Endocrinol Metab 82: 3705-3709. [Crossref]
- Murata M, Kaji H, Takahashi Y, Iida K, Mizuno I, et al. (2000) Stimulation by eicosapentaenoic acids of leptin mRNA expression and its secretion in mouse 3T3-L1 adipocytes in vitro. Biochem Biophys Res Commun 270: 343-348. [Crossref]
- Kaji H, Tai S, Okimura Y, Iguchi G, Takahashi Y, et al. (1998) Cloning and characterization of the 5'-flanking region of the human growth hormone secretagogue receptor gene. J Biol Chem 273: 33885-33888. [Crossref]
- Iguchi G, Okimura Y, Takahashi T, Mizuno I, Fumoto M, et al. (1999) Cloning and characterization of the 5'-flanking region of the human growth hormone-releasing hormone receptor gene. J Biol Chem 274: 12108-12114. [Crossref]
- Kathiresan S, Melander O, Guiducci C, Surti A, Burtt NP, et al. (2008) Six new loci associated with blood low-density lipoprotein cholesterol, high-density lipoprotein cholesterol or triglycerides in humans. Nat Genet 40: 189-197. [Crossref]
- Wolfs MGM, Rensen SS, Bruin-Van Dijk EJ, Verdam FJ, Greve JW, et al. (2010) Co-expressed immune and metabolic genes in visceral and subcutaneous adipose tissue from severely obese individuals are associated with plasma HDL and glucose levels: a microarray study. BMC Med Genom 3: 1-15.
- Willer CJ, Sanna S, Jackson AU, Scuteri A, Bonnycastle LL, et al. (2008) Newly identified loci that influence lipid concentrations and risk of coronary artery disease. Nat Genet 40: 161-169. [Crossref]
- Kennedy MA, Barrera GC, Nakamura K, Baldán A, Tarr P, et al. (2005) ABCG1 has a critical role in mediating cholesterol efflux to HDL and preventing cellular lipid accumulation. Cell Metab 1: 121-131. [Crossref]
- Rosenson RS, Brewer HB Jr, Chapman MJ, Fazio S, Hussain MM, et al. (2011) HDL measures, particle heterogeneity, proposed nomenclature, and relation to atherosclerotic cardiovascular events. Clin Chem 57: 392-410. [Crossref]
- Zhang JP, Zhang H, Wang HB, Li YX, Liu GH, et al. (2014) Down-regulation of Sp1 suppresses cell proliferation, clonogenicity and the expressions of stem cell markers in nasopharyngeal carcinoma. J Transl Med 12: 222. [Crossref]
- Cho JH, Lee RH, Jeon YJ, Shin JC, Park SM, et al. (2015) Role of transcription factor Sp1 in the 4-O-methylhonokiol-mediated apoptotic effect on oral squamous cancer cells and xenograft. Int J Biochem Cell Biol 64: 287-297. [Crossref]
- Schilling D, Kühnel A, Tetzlaff F, Konrad S, Multhoff G (2015) NZ28-induced inhibition of HSF1, SP1 and NF-κB triggers the loss of the natural killer cell-activating ligands MICA/B on human tumor cells. Cancer Immunol Immunother 64: 599-608. [Crossref]
- Schwartz GG, Olsson AG, Abt M, Ballantyne CM, Barter PJ, et al. (2012) Effects of dalcetrapib in patients with a recent acute coronary syndrome. N Engl J Med 367: 2089-2099. [Crossref]
- Kaji H (2013) High-density lipoproteins and the immune system. J Lipids 2013: 684903. [Crossref]