An Australian homicide case in 2007 provided the catalyst for a series of soil transference experiments. Trace evidence of soil and brick particles on a victim’s clothing provided evidence that the victim was initially attacked in her front yard and not where her body was buried. Police investigators hoped to use the patterns of soil and brick particles on the victim’s clothing to prove the circumstances of the initial attack and the method by which the victim’s body was moved. However during court proceedings, it became apparent that no relevant scientific literature existed that would enable forensic investigators to recognise or interpret trace soil patterns on clothing.
In response, methodology to study soil transference was designed to enable distinctive trace soil patterns on bra fabric to be identified and categorised. In this paper, the new methodology involving visual observation, digital photography of the soil patterns and image processing software is applied to test the influence of four common clothing fabrics on the abundance of soil transferred and the patterns produced. The clothing fabrics tested involved cotton, nylon, polyester-cotton and polar fleece (polyester brushed both sides), clothing seams and buttons. The soil types tested were expanded to twenty different soils to better understand the influence of soil type, moisture content and clay fraction (<2 μm) mineralogy on soil transfer patterns. Experiments simulated a clothed human body dragged across different natural and anthropogenic soil surfaces, under both wet and dry conditions in the laboratory.
clothing fabric, dragging, forensic, image-processing, soil, transference
Forensic soil scientists have a range of sophisticated analytical techniques available to compare soil with possible places of origin [1-9]. Their expertise has provided compelling evidence in criminal investigations; especially when forensic soil evidence strongly associates a suspect with a victim or crime scene [1]. For example, in a Western Australian homicide trial in 2012, which was before a judge only, the judge concluded that the mineralogy data from the brick particles on the victim’s clothing and the bricks from her front driveway [10,11] suggested she was initially attacked in her front yard and not at Kings Park where her body was buried [12,13]. However, an important question raised during the trial and by the judge was the method by which the brick particles were transferred to the victim’s clothing [12,13]. During court proceedings, it became apparent that no research specific to identifying or interpreting soil transfer patterns on clothing existed and that there was a need for systematic studies to determine whether soils deposited by dragging produced characteristic features that could identify this method of transfer [14].
This led to the work reported in the first two papers in this series by Murray et al. [15,16] on transfer patterns produced when clothing comes into contact with soil due to a dragging motion or by placing the clothing on soil with no movement. The methodology involved visual observation and digital photography of the soil patterns. Image processing software was adapted to analyse the digital photographs of the trace soil patterns to provide an objective methodology for determining the characteristics caused by dragging.
The objective of the work reported in this paper was to apply the methodology of Murray et al. [15] to discover the extent that wider fabric types could influence resulting trace soil patterns on clothing from a broader range of soil types. Soil transfer experiments will be conducted under similar laboratory conditions as original experiments to the following four common fabrics: (i) cotton, (ii) cotton-polyester, (iii) nylon and polar fleece (polyester brushed both sides), and (iv) seams and buttons.
Soil samples
Soil diversity enables forensic soil experts to differentiate soil from different locations by its range of crystalline minerals and organic matter, as well as trace amounts of manufactured materials such as brick fragments and road gravel [1-7]. Variations in soil colour provide one of the most distinguishing characteristics of trace soil evidence [17] and is routinely identified by agricultural [18] and forensic soil scientists [19] working in the field or laboratory using the standard Munsell soil colour system [20].
Twenty anthropogenic, human-altered or human-transported (HAHT) soils and natural soil types originated from three sources in Tasmania, Australia (Figure 1): (i) the University of Tasmania (UTas) Research Farm on Richmond Rd, Cambridge, (ii) Pinnacle Rd, Mount Wellington and (iii) the Royal Tasmanian Botanical Gardens (RTBG), Lower Domain Rd, Hobart.
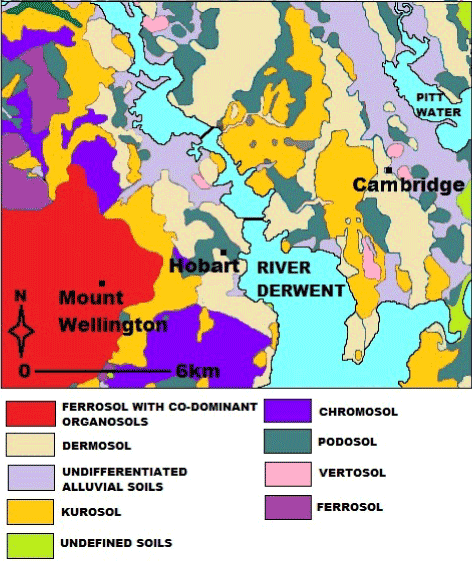
Figure 1. Soil map encompassing the three soil site locations in Tasmania at Mount Wellington, Hobart and Cambridge [22].
The soil classifications used in this paper incorporate international and national general-purpose classifications as well as a local special-purpose soil classification system (Table 1) so as to be of global relevance to the greatest number of forensic investigators and researchers. Detailed soil morphological descriptions and classifications including carbon content, mineralogy (by X-ray diffraction) and pH is detailed in Murray et al. [15,21] and summarised in Table 1.
Table 1. Soil morphology, Australian Soil Classification of soil materials [23] and the approximate corresponding World Reference Base for Soil resources class [24].
Locality (depth cm) |
Centre for Australian Forensic Soil Science (CAFSS) code |
Munsell¹ Soil Colour fine <2 mm (wet)
(dry) |
Soil type² |
Brief description |
The Australian soil classification |
The world reference base for soil resources (WRB) |
Site 1: UTas farm horizon 1 (0-10cm) |
110.1.1 |
Very dark brown 10YR 2/2
Dark grayish brown 10YR 4/2 |
Duplex soil with nonrestricted clayey subsoil |
Gravel (50%); clayey sand, water repellent, 6.92% Carbon (C). |
Humose, Mesotrophic, Brown Chromosol; medium, moderately gravelly, loamy, clayey, moderate |
Haplic, Luvisol (Clayic, Cutanic) |
Site 1: UTas farm horizon 2 (15-30 cm) |
110.1.2 |
Very dark brown 10YR 2/2
Brown 10YR 5/3 |
As above |
Gravel (45%); sandy loam, water repellent, 2.46% Carbon (C). |
As above |
As above |
Site 1: UTas farm horizon 3 (40-60 cm) |
110.1.3 |
Strong brown 7.5YR 4/6
Strong brown 7.5YR 5/6 |
As above |
Gravel (90%); heavy clay, non-water repellent, 0.92% Carbon (C). |
As above |
As above |
Site 1: UTas farm horizon 4 (60-80 cm) |
110.1.4 |
Strong brown 7.5YR 5/6
Reddish yellow 7.5YR 6/6 |
As above |
Gravel (90%); medium-heavy clay, non-water repellent, 0.26% Carbon (C). |
As above |
As above |
Site 1: UTas farm horizon 5 (80-100 cm) |
110.1.5 |
Dark brown 7.5YR 3/4
Reddish yellow 7.5YR 6/6 |
As above |
Gravel (40%); clayey sand, non-water repellent, 0.19% Carbon (C). |
As above |
As above |
Site 2: UTas farm horizon 1 (0-17 cm) |
110.2.1 |
Very dark brown 10YR 2/2
Grayish brown 10YR 5/2 |
Duplex soil with restricted sodic clayey subsoil |
Gravel (35%); sandy loam, non-water repellent, 2.61% Carbon (C). |
Vertic, Mottled-Mesonatric, Brown Sodosol; medium, moderately gravelly, loamy, clayey, deep |
Vertic, Abruptic Solonetz (Albic, Hypernatric) |
Site 2: UTas farm horizon 2 (17-34 cm) |
110.2.2 |
Brown 10YR 4/3
Pale brown 10YR 6/3 |
As above |
Gravel (95%); medium-heavy clay, non-water repellent, 1.14% Carbon (C). |
As above |
As above |
Site 3: UTas farm horizon 1 (0-10 cm) |
110.3.1 |
Very dark gray 10YR 3/1
Dark grayish brown 10YR 4/2 |
Poorly structured cracking clay |
Gravel (90%); medium clay, water repellent, 2.37% Carbon (C). |
Endocalcareous, Massive, Brown Vertosol; very gravelly, fine, very fine, deep |
Calsic, Vertisol (Gilgaic, Gleyic) |
Site 3: UTas farm horizon 2 (20-40 cm) |
110.3.2 |
Yellowish brown 10YR 5/4
Grayish brown 10YR 4/2 |
As above |
Gravel (97%); heavy clay, non-water repellent, 0.84% Carbon (C). |
As above |
As above |
Site 3: UTas farm horizon 3 (40-70 cm) |
110.3.3 |
Light yellowish brown 10YR 6/4
Light gray 10YR 7/2 |
As above |
Gravel (90%); medium clay, non-water repellent, 3.54% Carbon (C). |
As above |
As above |
Site 3: UTas farm horizon 4 (70-110 cm) |
110.3.4 |
Yellowish brown 10YR 5/4
Brown 10YR 5/3 |
As above |
Gravel (90%); heavy clay, non-water repellent, 0.44% Carbon (C). |
As above |
As above |
Locality (depth cm) |
Centre for Australian Forensic Soil Science (CAFSS) code |
Munsell¹ Soil Colour fine <2 mm (wet)
(dry) |
Soil type² |
Brief description |
The Australian soil classification |
The world reference base for soil resources (WRB) |
Site 4: Mount Wellington horizon 1 (0-10 cm) |
110.4.1 |
Very dark brown 10YR 2/2
Very dark grayish brown 10YR 3/2 |
Well structured clayey soil with boulders |
Gravel (70%); sandy clay loam, water repellent, 12.8% Carbon (C). |
Humose-Mottled, Placic, Brown Kandosol; medium, moderately gravelly, loamy, clayey, deep |
Xanthic, Ferretic, Ferralsol (Clayic, Colluvic) |
Site 4: Mount Wellington horizon 3 (40-60 cm) |
110.4.3 |
Strong brown 7.5YR 4/6
Brownish yellow 10YR 6/6 |
As above |
Gravel (70%); sandy clay loam, non-water repellent, 0.96% Carbon (C). |
As above |
As above |
Site 4: Mount Wellington horizon 5 (110-140 cm) |
110.4.5 |
Strong brown 7.5YR 4/6
Strong brown 7.5YR 5/6 |
As above |
Gravel (75%); sandy clay loam, non-water repellent, 0.34% Carbon (C). |
As above |
As above |
Site 5: rose garden path (0-10 cm) |
110.5.1 |
Dark brown 7.5YR 3/2
Brown 7.5YR 5/2 |
Anthropogenic gravelly sandy loam soil |
Gravel (90%; arkosic sandstone and andesitic-to-weathered mafic igneous rock) loamy sand, water repellent, 0.7% Carbon (C). |
Spolic anthroposol, very gravelly, sandy, very shallow |
³Spolic technosol (Densic) |
Site 6: brick fragments (0-2 cm) |
110.6.2 |
Red 2.5YR 5/8
Light red 2.5YR 7/8 |
Anthropogenic brick fragment-rich soil |
Gravel (90%), sandy, water repellent, weathered brick fragments (0.5-4 cm),1.2% C. |
Urbic anthroposol, very gravelly, sandy, very shallow |
³Urbic Ekranic technosol
(Transportic) |
Site 7: rose garden bed (0-10 cm) |
110.7.1 |
Black 10YR 2/1
Black 7.5YR 2.5/1 |
Anthropogenic, organic-rich sandy loam soil |
Gravel (15% coarse river sand), loamy sand (25%), water repellent, 30% fine compost, 30% composted pine bark, 14% C. |
Hortic anthroposol non-gravelly, sandy, shallow |
⁴Hortic anthrosol (Escalic) |
Site 8: Japanese garden bed (0-10 cm) |
110.8.1 |
Dark reddish gray 2.5YR 3/1
Reddish gray 2.5YR 6/1 |
Anthropogenic, quartz-rich, gravelly, sandy soil |
Gravel (90%: ~80% rounded quartz, 10% sub-rounded to angular dolerite;5% ironstone), loamy sand, water repellent, 3% C. |
Spolic anthroposol, very gravelly, sandy, very shallow |
³Spolic technosol (Grossartefactic, Transportic) |
Site 9: south eastern boundary horizon 1 (5-0 cm) |
110.9.1 |
Leaves not analysed for Munsell soil colour by naked eye |
Natural organic-rich soil |
Undecomposed Leaves (60%) and decomposed (40%) |
Humose, mesotrophic, Brown Dermosol, non-gravelly, sandy, deep |
⁵Eutric Cambisol (Humic) |
Site 9: south eastern boundary horizon 2 (0-10 cm) |
110.9.2 |
Very dark brown 10YR 2/2
Very dark brown 7.5YR 2.5/2 |
Natural loamy soil |
Gravel (2%), loamy sand, water repellent, 23% C. |
As above |
As above |
Where:
1Munsell soil colour [20]: measured on the fine earth fraction (<2 mm).
2Special-purpose technical soil classification system [25], which uses plain English and places strong emphasis on being either an anthropogenic soil or natural soil, the soil texture (e.g. gravelly, sandy, sandy loam) and the presence of high quantities of organic carbon (>10%; organic-rich).
3Classification of technosols [24]: Connotation: soils dominated or strongly influenced by human-made material; from Greek technikos, skilfully made. They contain a significant amount of artefacts.
4Classification of Anthroposol [24]: Connotation: soils with prominent characteristics that result from human activities; from Greek anthropos, human being (e.g. such as addition of organic material and cultivation).
5Classification of natural soils: Connotation: soils with substantial soil formation such as Dermosols [23] or Cambisols [24].
Experimental design
Dragging experiments: The dragging method used was adapted from previous Murray et al. [15] laboratory soil transference experiments (STE’s) that dragged weighted bras across seven soil types under both wet and dry conditions. A glass Pyrex 3 qt/2.8 L dish was filled >3 cm with bulk soil. The non-slip mat and heavy weights on one side ensured the dish did not move during experiments. A smooth-surfaced 2 kg weight with a yellow ‘drag line’ was enclosed in a tightly-fitted plastic bag, enabling easy cleaning between STEs. 30 cm² fabric squares had a raised seam sewn down the middle; to replicate seams joining sections of clothing fabric together. Half of the cotton squares also had a 1 cm plastic button sewn onto them. White fabric enabled easy detection of trace soil transferred.
A fabric square was secured to the weight by a strong rubber-band and each fabric square was dragged in timed three second runs through wet or dry soil using the drag line (Figure 2). The attached weight stabilised soil transfer patterns during analysis. A minor difference from initial experiments [15] was that the fabric squares were not secured so tight as to inhibit creases or folding of clothing fabric that might realistically occur if a clothed victim was dragged across a soil surface [16].
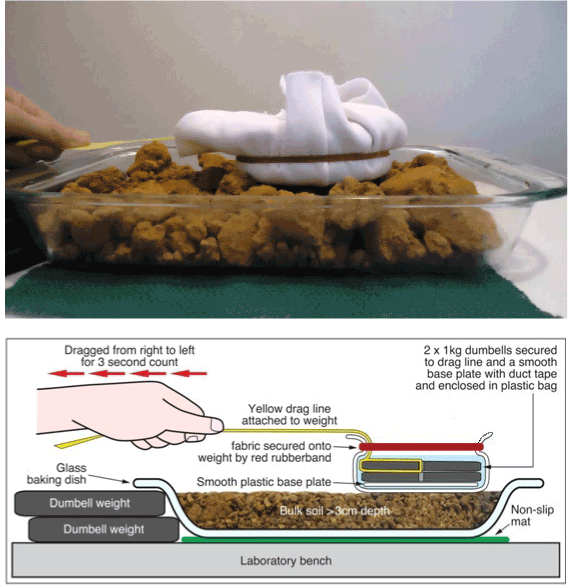
Figure 2. Photograph (above) and cross-section of weighted fabric dragged from right to left over soil material during a three second count Soil Transference Experiment (STE). The glass dish containing soil was on a nonslip mat with a backstop of weights on the left to prevent movement during the STE (modified from Murray et al. [15])
Munsell soil colour [20] and trace soil ‘patterns’ on fabric were measured using the image processing method developed by Murray et al. [15]. This method could enable a crime scene photographer equipped with a basic digital camera, a standard white scale bar and computer with image processing software to analyse forensic soil evidence with minimal training. The methodology was purposefully kept as simple as possible to allow an objective scientific analysis of forensic soil evidence to be within reach of all police departments, regardless of funding, resources or geographic location. To test the ability of image processing software to analyse digital photographs taken under less than optimal lighting conditions, STEs were photographed under artificial lighting and not first moved into natural sunlight, as recommended by Munsell [20].
Image processing data on directionality was entered into GEOrient version 9.5.0 [26] to produce rose Diagrams of trace soil patterns for quick and clear comparisons.
Trimble eCognition Developer image processing of photographs of the trace soil patterns on fabric was used to:
- Confirm patterns observed visually by human eye,
- Provide standardised numerical data of the colour and shape of soil objects ≥100 μm/2 pixel,
- Allow statistical comparison of observed soil patterns.
This included quantity and directionality of soil transferred, percentage of individual soil objects and aggregates and Munsell soil colour range. However, the primary focus of this paper was to investigate whether new or previously documented trace soil patterns identified by Murray et al. [15,16] could be identified on different fabric types; by visual analysis or through use of image processing software.
Limitations in software programming were overcome by disregarding soil objects <100 μm. Difficulties differentiating mineral from organic soil objects could feasibly be overcome with more complex programming. Full details of this method are provided in Murray et al. [15,21].
Trace soil patterns documented on fabric using transfer method of ‘dragging’
Ten patterns were identified in soil transferred onto the weighted fabric squares (Table 2). Six of the ten patterns were seen in all 20 soil types (Figures 3-6). Soil transfer pattern numbers 1, 2, 4 and 6 were originally documented in laboratory experiments by Murray et al. [15] Pattern numbers 3, 5 and 7 were first documented in field experiments by Murray et al. [16] The final three patterns involving plastic buttons are new patterns, never before documented.
Table 2. Trace soil patterns identified on fabric using ‘dragging’ as the transfer method.
|
Soil transfer pattern |
Symbol used |
Figure |
Location on fabric |
Contributing soil characteristic |
1 |
Soil 'trails' |
red circle |
Figure 3 Figure 4 Figure 5 |
parallel to direction of movement |
Greater quantity of wet soil objects transferred than dry
|
2 |
Soil accumulated on
raised surfaces |
yellow circle |
Figure 3
Figure 4 |
raised middle seams perpendicular to direction of movement |
no consistent trends |
3 |
Fold and crease marks |
green circle |
Figure 3
Figure 4 |
approx. parallel to direction of movement |
no consistent trends |
4 |
Damaged or frayed
fabric |
purple circle |
Figure 4 |
where fabric has caught
on hard surface soil objects |
hard gravel-textured soil |
5 |
Soiled water stains |
blue circle |
Figure 4 |
sporadically where fabric had
made contact with soil surface |
wet soil |
6 |
Elongated particles
aligned and/or embedded |
orange circle |
Figure 3
Figure 4 |
embedded in or on fabric
parallel to direction of movement |
no consistent trends |
7 |
Speckling of soil on fabric |
_ |
Figure 4 |
sporadically where fabric had made contact with soil surface |
no consistent trends |
8 |
Dusted' plastic buttons |
pink circle |
Figure 5 |
buttons sewn onto cotton fabric
(no other fabrics had buttons) |
very dry soil |
9 |
Muddy clumps on wet
shiny plastic buttons |
_ |
Figure 5 |
buttons sewn onto cotton
fabric |
wet soil |
10 |
Elongated scratches on
plastic buttons |
black circle |
Figure 5 |
buttons sewn onto cotton
fabric |
Greater occurance on dry soil
than wet soil |
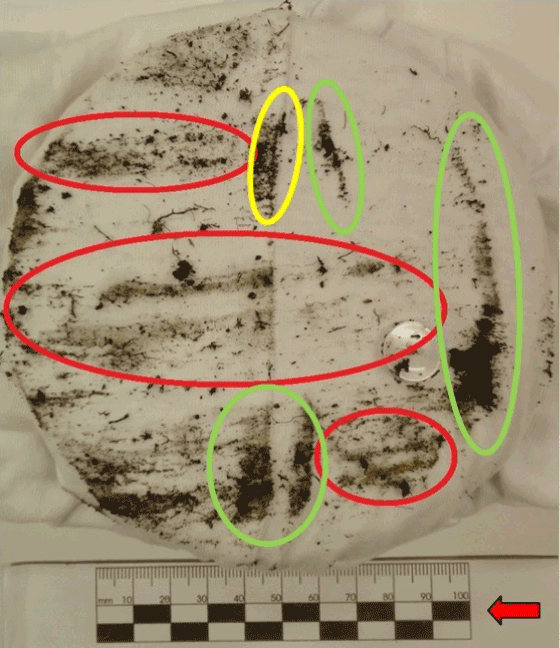
Figure 3a. Trace soil patterns using the transfer method of dragging weighted fabric for a three second count across a soil bed containing wet soil. (Direction of movement = right to left). Red circles = soil trails; yellow circles = soil build upon or in front of raised seam; green circles = fold marks delineated by soil.
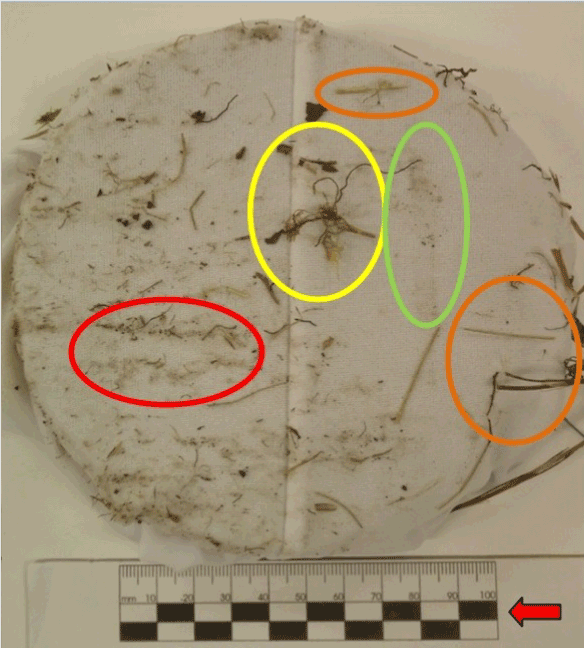
Figure 3bTrace soil patterns using the transfer method of dragging weighted fabric for a three second count across a soil bed containing dry soil. (Direction of movement = right to left). Red circles = soil trails; yellow circles = soil build upon or in front of raised seam; green circles = fold marks delineated by soil; orange circles = elongate organic soil objects aligned with direction of movement.
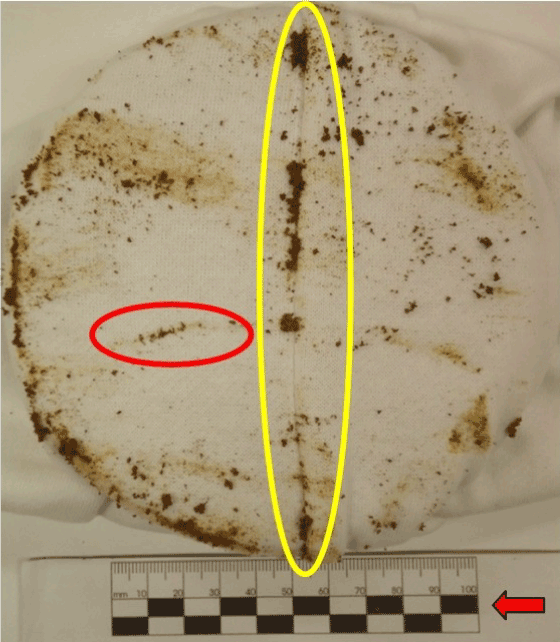
Figure 3cTrace soil patterns using the transfer method of dragging weighted fabric for a three second count across a soil bed containing wet soil. (Direction of movement = right to left). Red circles = soil trails; yellow circles = soil build upon or in front of raised seam.
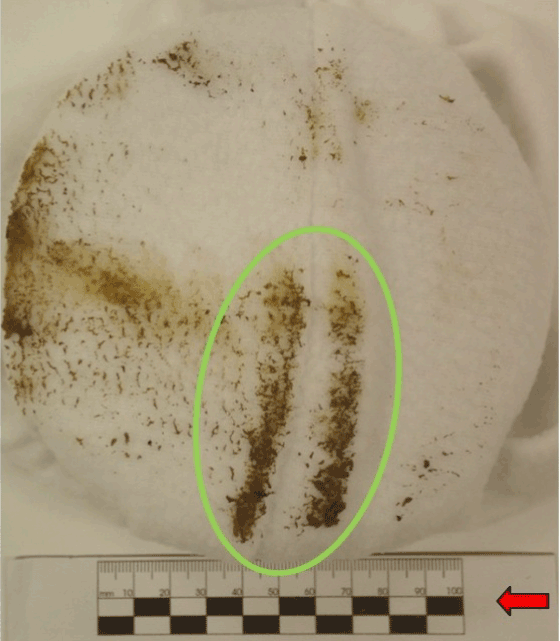
Figure 3dTrace soil patterns using the transfer method of dragging weighted fabric for a three second count across a soil bed containing wet soil. (Direction of movement = right to left). Green circles = fold marks delineated by soil.
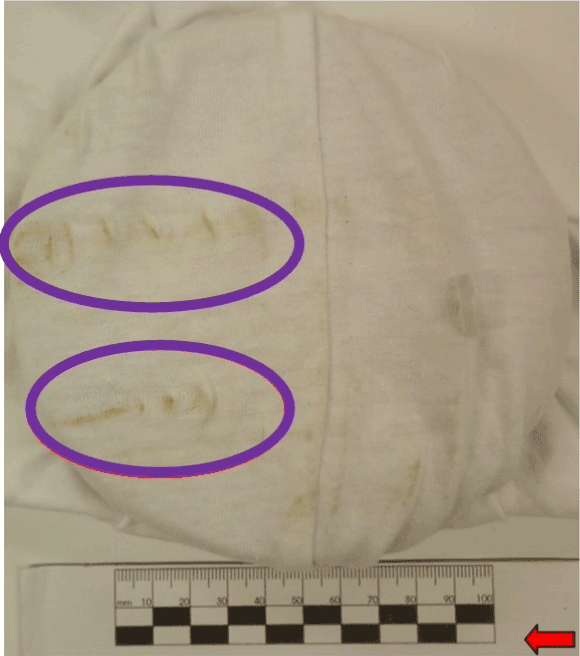
Figure 4aTrace soil patterns using the transfer method of dragging weighted fabric for a three second count across a soil bed containing dry soil. (Direction of movement = right to left). Purple circle = fabric damaged or gouged by hard or gravel-rich soil surface.
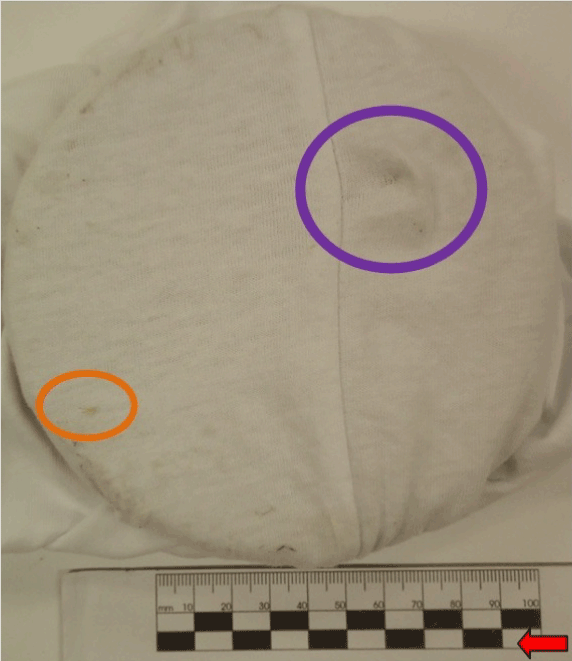
Figure 4bTrace soil patterns using the transfer method of dragging weighted fabric for a three second count across a soil bed containing dry soil. (Direction of movement = right to left). Orange circle = elongate organic soil object (grass seed) aligned with direction of movement and or embedded in fabric; purple circle = fabric damaged or gouged by hard or gravel-rich soil surface.
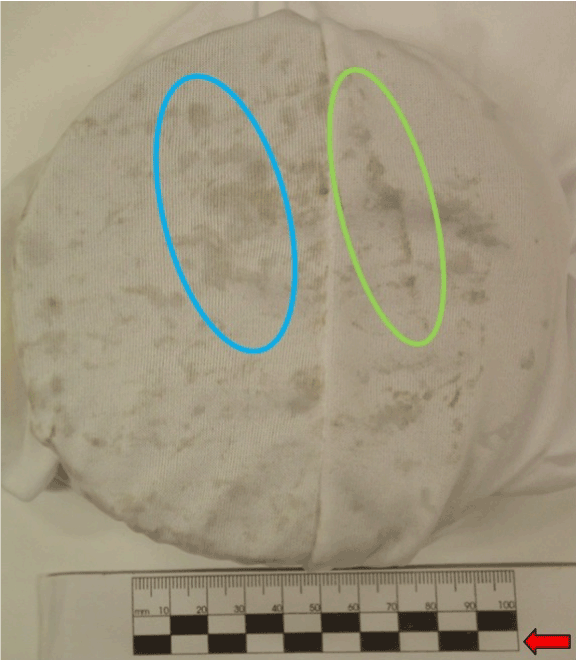
Figure 4cTrace soil patterns using the transfer method of dragging weighted fabric for a three second count across a soil bed containing wet soil. (Direction of movement = right to left). Blue circle = water marks; green circle = fold marks delineated by soil.
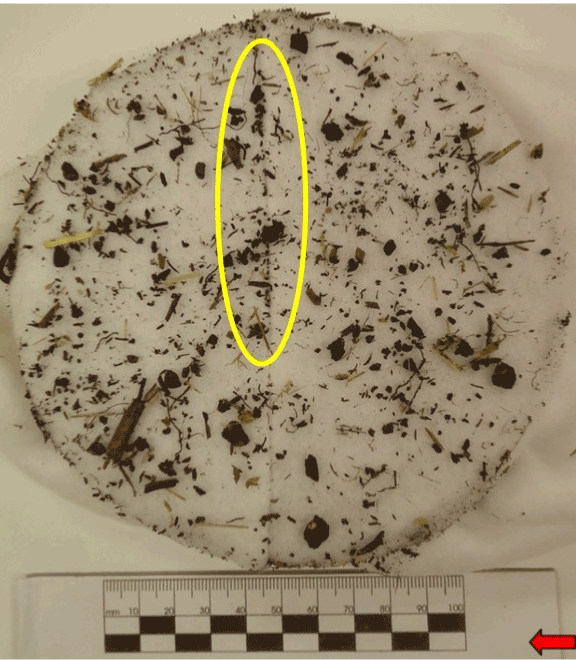
Figure 4dTrace soil patterns using the transfer method of dragging weighted fabric for a three second count across a soil bed containing dry soil. (Direction of movement = right to left). Yellow circle = soil building up in front or on top of raised seam.
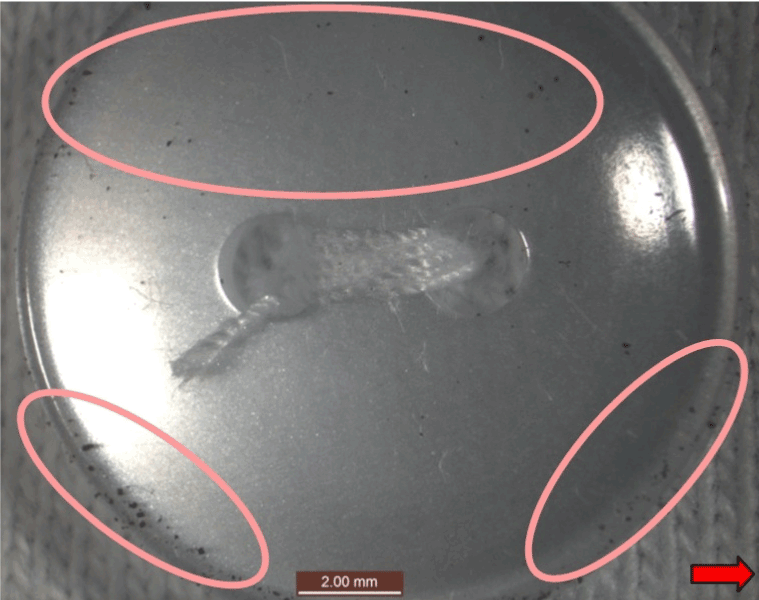
Figure 5aTrace soil patterns on buttons using the transfer method of dragging weighted fabric for a three second count across a soil bed containing dry soil. (Photomicrographs display direction of movement = left to right). Button shows ‘dusting’ of very fine soil objects (pink circles).
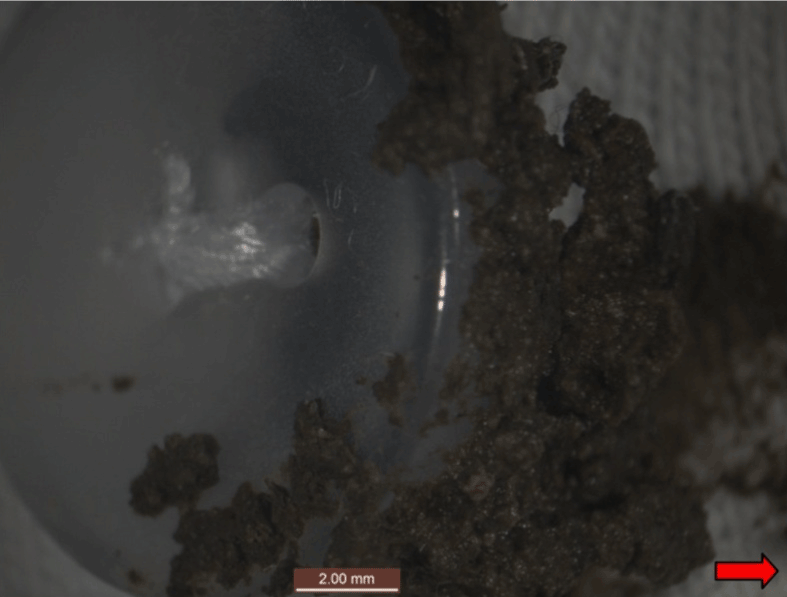
Figure 5bTrace soil patterns on buttons using the transfer method of dragging weighted fabric for a three second count across a soil bed containing wet soil. (Photomicrographs display direction of movement = left to right). Wet soil has built up on leading (right) edge and underneath button.
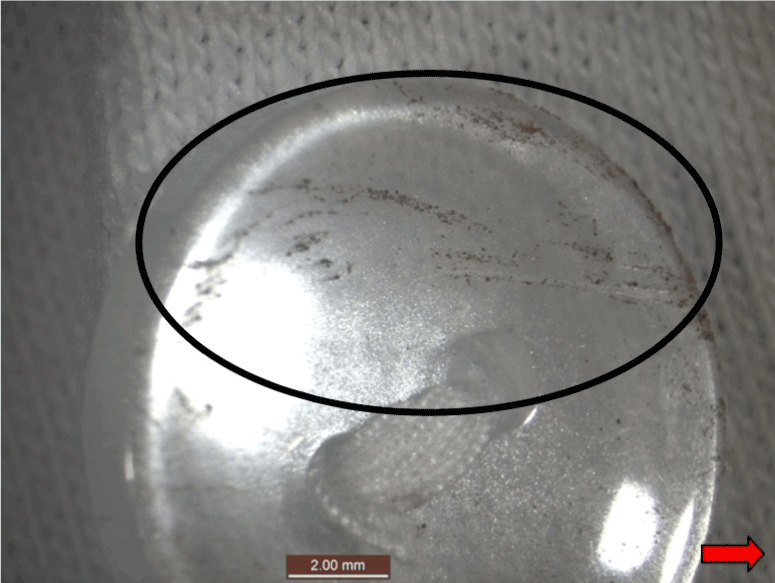
Figure 5cTrace soil patterns on buttons using the transfer method of dragging weighted fabric for a three second count across a soil bed containing dry soil. (Photomicrographs display direction of movement = left to right). Button displays horizontal scratches (black circle) and dusting of soil along scratch lines. Horizontal scratches on the surface of this plastic button indicates dragging as the method of soil transfer.
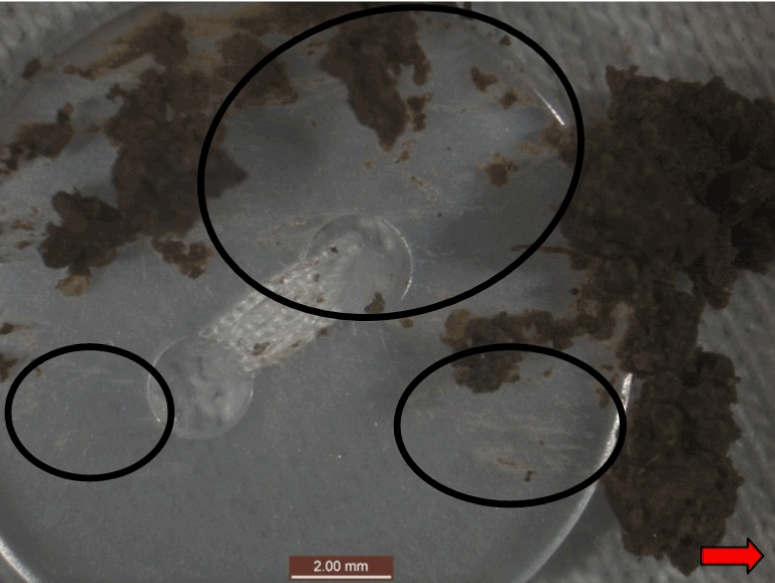
Figure 5dTrace soil patterns on buttons using the transfer method of dragging weighted fabric for a three second count across a soil bed containing wet soil. (Photomicrographs display direction of movement = left to right). Button displays horizontal scratches (black circles) and wet soil has built up on leading (right) edge and underneath button. Horizontal scratches on the surface of this plastic button indicates dragging as the method of soil transfer.
Directionality of soil objects transferred, analysed by soil and fabric type and seams
Using image processing directional numerical data, quick and simple rose diagrams [26] mapped directionality of thousands of dry or wet soil particles ≥2 pixels diameter transferred onto fabric (Figure 6 and Figure 7). This not only provided an objective confirmation of naked eye interpretation of trace soil directionality, but was accurate enough to detect directionality of thousands of soil objects down to 100 μm diameter. Fabric type did not reveal a consistent influence on soil objects transferred. Soil mineralogy (in particular the amount of smectite in the clay fraction (<2 um) and soil moisture content had a greater influence on resulting trace soil patterns. Fabric seams and buttons also had a definite influence on trace soil patterns produced.
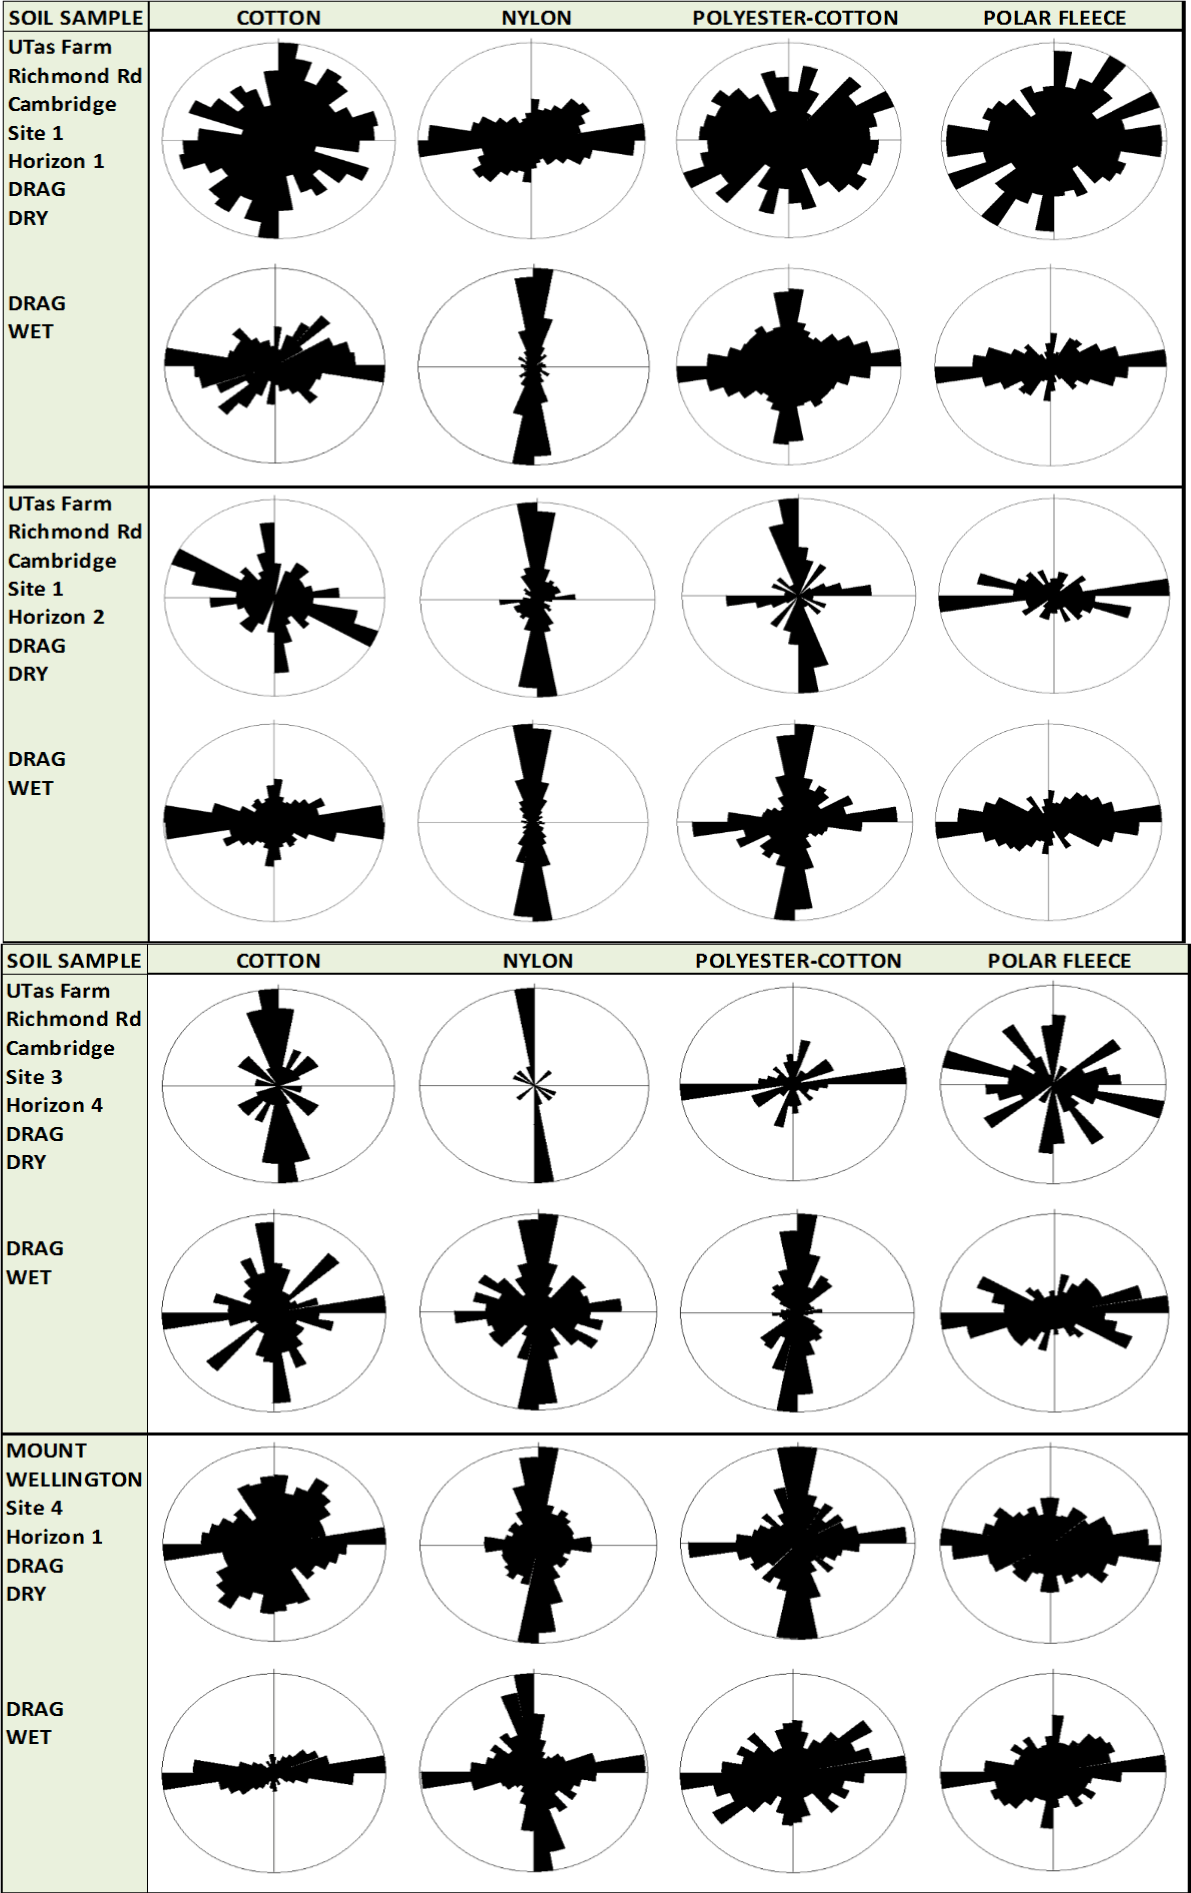
Figure 6Rose diagrams indicate directionality of dry and wet soil transferred from site 1 horizons 1 and 2 and site 3 horizon 4 from UTas farm. Site 4 horizon 1 from Mt Wellington is also displayed. Numerical data from two digital photographs are combined in each rose diagram. Direction of movement = right to left.
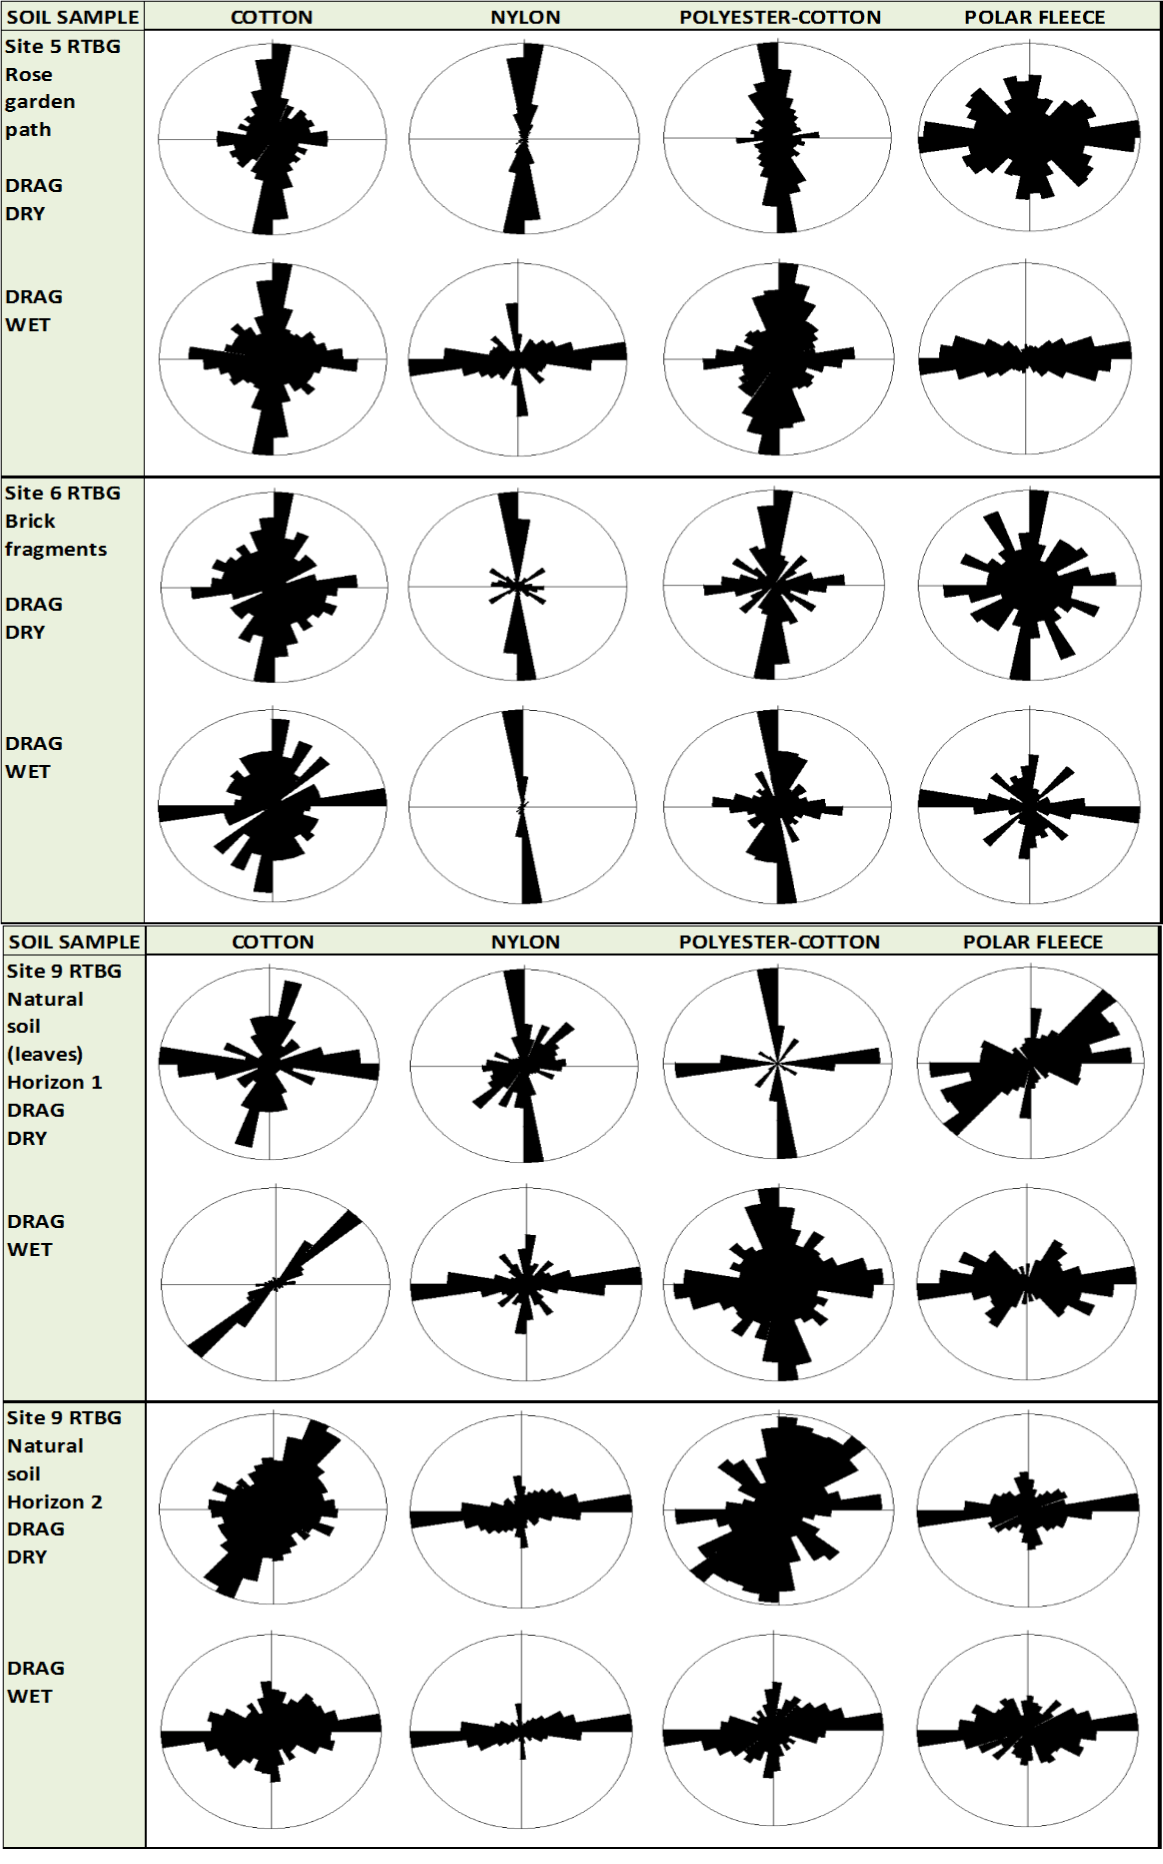
Figure 7Rose diagrams display directionality of dry and wet soil transferred onto fabric from sites 5, 6 and 9 (two horizons) at RTBG. Strong uni-modal directionality was produced when fabric was dragged right to left across soil. Dry soil objects more than wet soil tended to gather against the middle seam, creating more bi-modal directionality. Numerical data from two digital photographs are combined in each rose diagram. (Direction of movement = right to left).
Strong uni-modal directionality was displayed when fabric was dragged in one direction across soil. On the rose diagrams, black directional lines reaching the edges of the rose diagram show the directions with the greatest number of soil objects aligned. In most of the images, there was a strong horizontal line indicating direction of drag from right to left. This is particularly the case when wet soil was transferred to fabric.
In other rose diagrams, loose soil objects gathered against the raised middle seam to produce a strong uni-modal vertical (or bi-modal cross-like) directionality. This tended to occur when dry soil was transferred. In cases where very minute traces of soil were transferred (such as site 9: natural soil horizon of undecomposed leaves), microscopic soil objects tended to be found pushed against the middle raised seam, creating a uni-modal vertical directionality.
Dry soil also tended to have a higher quantity of loose soil objects scattered more randomly over fabric. The lack of directionality that very dry friable soil displayed, was reminiscent of rose diagrams created by placing fabric on soil [16]. This transfer pattern is documented in rose diagrams produced using dry soil from UTas farm site 1 and 3 and brick fragments from RTBG (Figure 6 and Figure 7).
Different horizons from the same soil profile produced very different modes of directionality. Natural surface soil at UTas site 1 (horizon 1) had a granular structure and clayey-sand texture. This soil produced a more random directionality than the undisturbed lower horizon 2 with a granular to sub-angular blocky soil structure and sandy-loam texture. When both soils were wet, there was a strong uni-modal to bi-modal directionality to soil particles transferred. UTas site 3 (horizon 4) had a similar granular-to-angular blocky structure which was combined with a heavy clay texture. Directionality results using this wet and dry soil type were similar to soil from UTas site 1 (horizon 2).
Natural surface soil at Mt Wellington (site 4 horizon 1) had a massive structure and sandy-clay-loam texture. A greater quantity of soil objects was transferred under dry conditions than wet. On the rose diagram, this was indicated by the thicker black section in the middle of the rose diagram; as multiple loose soil objects scattered in a full spectrum of directions. Despite this, there was still a uni-modal to bimodal directional trend, which was indicated by black lines on the rose diagram reaching to the very edges in a horizontal and/or vertical direction.
Gravel-rich rose garden path soil at site 5 RTBG (Figure 7) had a granular-to-single grain structure with a loamy-sand textured matrix. Brick fragments at site 6 shared a similar gravel-rich structure and produced very similar directionality results.
Natural soil on the SE boundary of RTBG had two horizons analysed for directionality (Figure 7). The surface layer of undecomposed leaves (horizon 1) showed minimal trace soil transferred. However, a strong uni-modal to bi-modal directionality was still recorded. Underlying natural mineral soil (horizon 2) transferred a greater quantity of trace soil to fabric. Using this dry soil, a larger quantity of loose soil objects was gathered against the perpendicular seam of cotton and polyester-cotton fabrics than seen using nylon and polar fleece fabrics.
Quantity of soil objects transferred to fabric analysed by soil type
Quantity of soil objects transferred to fabric was measured by image processing analysis using digital photographs taken of each STE. Image processing of digital photographs taken of individual and aggregate soil objects transferred onto fabric provided an objective approach to graphically present soil transfer patterns. Quantitative graphical presentation of soil patterns, including texture, mineralogy, chemistry, moisture content, quantity and directionality of soil transferred, added standardised objectivity not possible through identification by naked eye alone. Image processing numerical data is summarised in Figure 8 and Table 3.
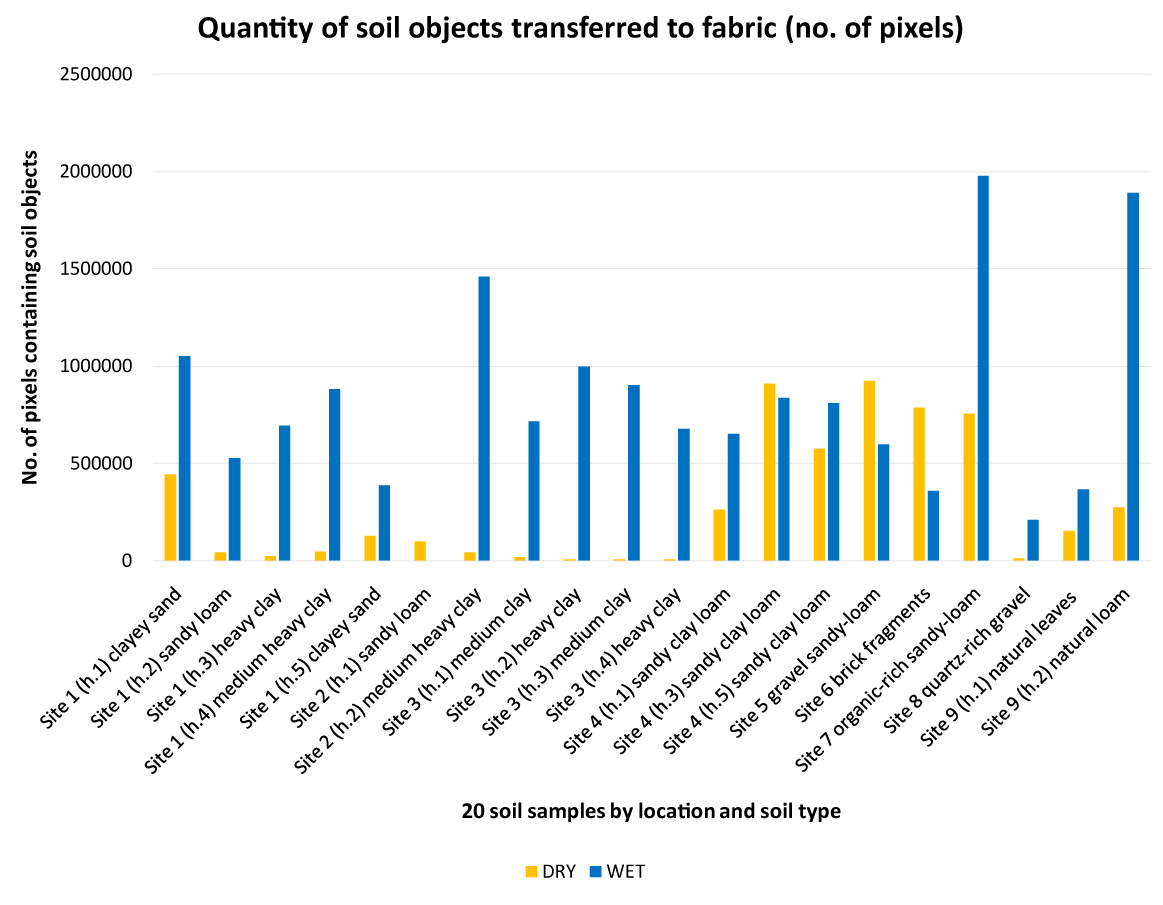
Figure 8Quantity of soil transferred to fabric, analysed by number of pixels in digital photographs that contained individual or aggregate soil objects. Image processing numerical data is subdivided by location and soil moisture content.
Soils were grouped by location and soil moisture content. Numerical data for individual and aggregate soil objects transferred from each soil sample to fabric, were combined and averaged.
Soil objects covering > 0.5 million pixels were classified as being a low quantity of soil transferred to fabric.
Soil objects covering 0.5 million to >1 million pixels were classified as a moderate quantity of soil transferred.
Soil objects covering 1 million pixels and higher were classified as a high quantity of soil transferred.
Using image processing numerical data that measured the quantity of trace soil objects (individual and aggregates) transferred to fabric, the following associations between soil types, clay mineral properties (smectite) and soil moisture content was discovered:
- Natural quartz and smectite-rich soil (site 1: UTas farm, horizons 1 to 5; Table 3) with 0 to 12% organic content, produced a low quantity of light gray soil objects when transferred to fabric when dry and increasing to a moderate to high quantity when wet (light gray to very dark brown).
- Natural quartz-rich soil (site 2: UTas farm, horizons 1 to 2) with low organic content, produced a low quantity of light gray soil objects when transferred dry to fabric and increasing to a moderate quantity when wet (light gray).
- Natural smectite and quartz-rich soil (site 3: UTas farm, horizons 1 to 4) with low organic content (note: horizon 3 had 21% calcite) produced a low quantity of light gray soil particles when transferred dry to fabric and increasing to moderate quantity when wet (light gray).
- Natural quartz-rich soil (site 4: Mt Wellington), with organic-rich horizon 1, and kaolinite, gibbsite and goethite-rich horizons 3 and 5, produced a low to moderate quantity of light gray soil objects when transferred dry to fabric and increasing to moderate quantity when wet (light gray).
- Anthropogenic, gravelly, sandy loam soil (site 5: rose garden path) with low organic carbon content, produced a moderate quantity of light gray soil objects when transferred to the fabric when dry and increasing (but staying within) the moderate quantity when wet (light gray).
- Anthropogenic brick fragment-rich soil (site 6: brick fragments) with high quartz and negligible organic and smectite content, produced a moderate quantity of light gray soil objects when transferred to fabric when dry, decreasing to a lower quantity when wet (light gray).
- Anthropogenic, organic-rich sandy loam soil (site 7: rose garden bed) with approximately 15 to 19% smectite and high amounts of arkosic sandstone and andesitic-to-weathered mafic igneous rock produced a moderate quantity of very dark brown soil objects when transferred to the fabric when dry and increasing to a high quantity when wet (very dark brown).
- Anthropogenic, quartz-rich gravelly sandy soil (site 8: Japanese garden bed) with high quartz content and negligible organic and smectite content, produced a low quantity of very dark brown soil objects to fabric when dry, increasing (but remaining within) a low quantity when wet (very dark brown).
- Natural organic-rich soil (site 9: horizon 1 organic-rich soil) with very high organic carbon content (undecomposed leaves), produced a low quantity of very dark brown soil particles when transferred to the fabric when dry and increasing (but remaining within) a low quantity when wet (very dark brown).
- Natural loamy soil (site 9: underlying mineral soil) with approximately 20% smectite produced a low quantity of very dark brown soil objects when transferred to the fabric when dry and increasing to high quantity when wet (very dark brown). This is because smectite is highly responsive to soil moisture and soils with high smectite content can undergo as much as a 30% volume change; an indication of smectite’s shrink/swell potential [27]. This characteristic of smectite clay may help explain the distinctly observable differences seen in trace soil patterns when dry or wet soil was transferred to fabric.
In summary, there was a strong trend for a greater quantity of soil objects, in particular soil aggregates, to be transferred to clothing fabric when these soils were wet (Table 3 and Figure 8). Soil aggregates made up approximately two-thirds of all soil objects detected by image processing. Dry soil produced the largest percentage of individual soil objects transferred per area of fabric; with wet soil producing a greater percentage of aggregates.
Table 3. Summary of soil data using naked eye, image processing, XRD and NDIR analysis of the seven soil types and trace soil transferred to fabric
Locality |
Centre for Australian Forensic Soil Science (CAFSS) |
Munsell¹ soil colour <2 mm fraction |
Dominant trace soil² Munsell colour |
Ave. soil transferred (individual + aggregates) in pixels³ |
|
Weight % Clay content⁴ (Smectite) |
% Organic content⁵ |
% Gravel content⁶ |
(Depth cm)
|
code
|
(wet) (dry)
|
(wet) (dry)
|
(wet) (dry)
High quantity
Moderate
Low |
(H)
(M)
(L) |
|
|
|
Site 1: UTas farm
horizon 1
(0-10 cm) |
110.1.1
|
Very dark brown 10YR 2/2
Dark grayish brown 10YR 4/2 |
Very dark brown 7.5YR 2.5/2
Light gray 10YR 7/2 |
1052138
442082 |
(H)
(L) |
5 ± 1
|
6.92
|
50
|
Site 1 horizon 2
(15-30 cm)
|
110.1.2
|
Very dark brown 10YR 2/2
Brown 10YR 5/3
|
Light gray 10YR 7/2
Light gray 10YR 7/2
|
526340
41055
|
(M)
(L)
|
13 ± 2
|
2.46
|
45
|
Site 1 horizon 3
(40-60 cm)
|
110.1.3
|
Strong brown 7.5YR 4/6
Strong brown 7.5YR 5/6
|
Light gray 10YR 7/2
Light gray 10YR 7/2
|
692803
23437
|
(M)
(L)
|
56 ± 5
|
0.92
|
90
|
Site 1 horizon 4
(60-80 cm)
|
110.1.4
|
Strong brown 7.5YR 5/6
Reddish yellow 7.5YR 6/6
|
Light gray 7.5YR 2.5/2
Light gray 10YR 7/2
|
882729
44044
|
(M)
(L)
|
59 ± 5
|
0.26
|
90
|
Site 1 horizon 5
(80-100 cm)
|
110.1.5
|
Dark brown 7.5YR 3/4
Reddish yellow 7.5YR 6/6
|
Light gray 10YR 7/2
Light gray 10YR 7/2
|
386965
125753
|
(L)
(L)
|
52 ± 5
|
0.19
|
40
|
Site 2: UTas farm
horizon 1
(0-17 cm) |
110.2.1
|
Very dark brown 10YR 2/2
Grayish brown 10YR 5/2 |
no image data available⁷
Llight gray 10YR 7/2 |
no image data available⁷
98056 |
(M) |
3 ± 1
|
2.61
|
35
|
Site 2 horizon 2
(10-34 cm)
|
110.2.2
|
Brown 10YR 4/3
Pale brown 10YR 6/3
|
Light gray 10YR 7/2
Light gray 10YR 7/2
|
1461174
43375
|
(H)
(L)
|
5 ± 2
|
1.14
|
95
|
Site 3: UTas farm
horizon 1 (0-10 cm) |
110.3.1
|
Very dark gray 10YR 3/1
Dark grayish brown 10YR 4/2 |
Light gray 10YR 7/2
Light gray 10YR 7/2 |
715203
16573 |
(M)
(L) |
41 ± 4
|
2.37
|
90
|
Site 3 horizon 2
(20-40 cm) |
110.3.2
|
Yellowish brown 10YR 5/4
Grayish brown 10YR 5/2 |
Light gray 10YR 7/2
Light gray 10YR 7/2 |
996395
4256 |
(M)
(L) |
58 ± 5
|
0.84
|
97
|
Site 3 horizon 3
(40-70 cm) |
110.3.3
|
Light yellowish brown 10YR 6/4
Light gray 10YR 7/2 |
Light gray 10YR 7/2
Light gray 10YR 7/2 |
900580
4230 |
(M)
(L) |
46 ± 4
|
3.54
|
90
|
Site 3 horizon 4
(70-110 cm) |
110.3.4
|
Yellowish brown 10YR 5/4
Brown 10YR 5/3 |
Light gray 10YR 7/2
Light gray 10YR 7/2 |
675637
4459 |
(M)
(L) |
64 ± 5
|
0.44
|
90
|
Site 4: Mount Wellington
horizon 1 (0-10 cm) |
110.4.1
|
Very dark brown 10YR 2/2
Very dark grayish brown 10YR 3/2 |
Light gray 10YR 7/2
Light gray 10YR 7/2 |
651041
262720 |
(M)
(L) |
7 ± 2
|
12.8
|
70
|
Site 4 horizon 3
(40-60 cm) |
110.4.3
|
Strong brown 7.5YR 4/6
Brownish yellow 10YR 6/6 |
Light gray 10YR 7/2
Light gray 10YR 7/2 |
837508
910006 |
(M)
(M) |
10 ± 2
|
0.96
|
70
|
Site 4 horizon 5
(110-140 cm) |
110.4.5
|
Strong brown 7.5YR 4/6
Strong brown 7.5YR 5/6 |
Light gray 10YR 7/2
Light gray 10YR 7/2 |
809442
574757 |
(M)
(M) |
5 ± 2
|
0.34
|
75
|
Site 5: RTBG rose
garden path
(0-10 cm)
|
110.5.1
|
Dark brown
7.5YR 3/2
Brown
7.5YR 5/2 |
Light gray
10YR 7/2
Light gray
10YR 7/2 |
596435
925693
|
(M)
(M)
|
19 ± 3
|
0.70
|
90
|
Site 6: RTBG brick fragments
(0-2 cm)
|
110.6.2
|
Red
2.5YR 5/8
Light red 2.5YR 7/8 |
Light gray
10YR 7/2
Light gray 10YR 7/2 |
358527
785580 |
(L)
(M) |
Trace of Mullite
|
0.29
|
90
|
Site 7: RTBG rose garden bed
(0-10 cm)
|
110.7.1
|
Black
10YR 2/1
Black
7.5YR 2.5/1 |
Very dark brown
7.5YR 2.5/2
Very dark brown
7.5YR 2.5/2 |
1977927
755414
|
(H)
(M)
|
2 ± 1
|
14.0
|
15
|
Site 8: RTBG Japanese
garden bed
(0-10 cm)
|
110.8.1
|
Dark reddish gray
2.5YR 3/1
Reddish gray
2.5YR 6/1 |
Very dark brown
7.5YR 2.5/2
Very dark brown
7.5YR 2.5/2 |
209871
11683
|
(L)
(L)
|
2 ± 1
|
3.10
|
90
|
Site 9: RTBG
SE boundary
horizon 1 (5-0 cm
above surface) |
110.9.1
|
Leaves
leaves
|
Very dark brown
7.5YR 2.5/2
Very dark brown
7.5YR 2.5/2 |
367741
150810
|
(L)
(L)
|
No XRD analysis
|
No NDIR analysis
|
Leaves
|
|
Site 9 horizon 2
(0-10 cm)
|
110.9.2
|
Very dark brown
10YR 2/2
Very dark brown
7.5YR 2.5/2 |
Very dark brown
7.5YR 2.5/2
Very dark brown
7.5YR 2.5/2 |
1891918
272163
|
(H)
|
20 ± 3
|
22.8
|
2
|
(L)
|
|
|
|
Where: 1Munsell Soil Colour [20]: measured by naked eye on the fine earth fraction (<2 mm).
2Munsell Soil Colour measured by image processing software from two digital photographs of trace soil on fabric.
3Average of two STEs tested using either wet or dry soil sample.
4XRD analysis of % weight clay (Smectite) content in homogenous bulk soil sample.
5NDIR analysis of organic content of homogenous bulk soil sample.
6Estimate by naked eye alone using method of McDonald and Isbell [28].
7Image data not available for this source digital photograph because the current manual method of clicking on each image to be analysed, led to this accidental omission due to human error.
These soil transference experiments (STEs) can only indicate potential soil transfer patterns when a clothed victim is dragged across soil. Other modes of soil transfer onto fabric, such as placing a clothed victim on soil [16], or trace soil patterns from a violently struggling victim, will produce their own unique sets of soil transfer patterns.
Of primary interest in these STEs was whether fabric type, irregularities in the structure of the fabric (such as seams) and appendages (buttons) could influence resulting soil transfer patterns. These latest experiments found that:
- fabric type did not show a consistent influence on transfer patterns and
2021 Copyright OAT. All rights reserv
- appendages (buttons) and irregularities in fabric structure (seams) did influence the directionality of soil objects transferred and were important markers in determining the direction of drag.
Six of the ten patterns were seen in all 20 soil types: soil trails, soil accumulating in front and on top of raised seams, soil accumulating and delineating on crease marks and folds. Soil transfer patterns involving buttons were extremely consistent, with soil traces on buttons occurring in both wet and dry soil STEs on all soils tested. Buttons were ‘dusted’ with dry soil with 100% consistency and when using wet soil, buttons had clumps of soil on top or underneath the leading edge with 90% consistency. Elongate scratches on buttons occurred using 18 of the 20 soils tested.
The least consistent soil transfer patterns were random speckling of fabric with soil, damage to fabric and elongate organic soil particles aligned with direction of movement. A random speckle of soil on the fabric, which is a pattern consistently seen when weighted fabric is only placed on the soil [16], was noted in only 1.5% of fabric squares. The soil types this pattern appeared in were very dry and rich in light-weight organic particles, such as straw.
The other pattern not seen in all soils was minor damage to the fabric involving disruption of the fibre structure caused by forced contact with fragments of hard angular surface soil. Out of the four fabric types tested, this pattern only persisted when cotton fabric was dragged across very dry, clay-rich soil, with a hard massive structure. The length of time this minor fabric damage persisted was not documented in these STEs. It must be noted that movement over the soil surface only occurred for 3 seconds and the fabric was weighed down by a 2 kg weight.
The previously described method of comparing the quantity of individual and aggregate soil objects was chosen to illustrate the effect of different soil types on trace soil patterns. To ascertain whether fabric type had any consistent effect on the amount of soil transferred, image processing data recording the number of soiled pixels transferred in two STEs/ fabric type was collated and averaged (Figure 11 and Figure 12). It was hoped that comparing the quantity of soiled pixels of fabric would better enable any effect of four different fabric types on soil transference to be discovered.
When wet natural clay-rich soils from UTas farm (sites 1 to 3) were used, there was a clear trend for a distinctly greater quantity of pixels to record soiling; regardless of the fabric used. Site 1 is classified as a Brown Chromosol [23]; a duplex soil with non-restricted clayey subsoil (Table 1; (i.e., water flow and roots have easy access into the subsoil)). Site 2 is a Brown Sodosol, a duplex soil with restricted sodic clayey subsoil (i.e., water flow and roots have restricted access into the subsoil). Site 3 is a Brown Vertosol, a poorly-structured cracking clay. This trend was also identified at RTBG using natural loamy Brown Dermosol at site 9 and anthropogenic, organic-rich sandy loam soil from the rose garden bed (site 7). These results correspond with previous laboratory and field results [15,16,21]. Natural well-structured clayey Brown Kandosol with boulders from Mt Wellington (site 4) and Anthropogenic gravel-rich soil sites 5, 6 and 8 at RTBG did not show this trend. The reason why wet clay-rich soil from site 4 did not display the same distinct influence on trace soil patterns as other clay-rich soils tested from UTas Farm is not clear. The surface layer of this Brown Kandosol was water repellent and had a higher carbon content (12.8%) than soils from UTas farm (sites 1 to 3). All three horizons from site 4 had a sandy clay loam texture [28], which also differed from the predominantly clayey texture of soils from UTas farm.
Out of the four fabrics tested, nylon fabric tended to record the lowest-to-second-lowest quantity of soiled pixels when dragged across wet soil. Otherwise, no particular fabric type could be consistently identified as influencing the resulting trace soil pattern when soil was dry or wet.
Laboratory soil transference experiments (STEs) used the transfer method of dragging weighted clothing fabric across wet and dry soil from UTas farm, Mt Wellington and RTBG, to document trace soil patterns.
Three hundred and twenty (320) STEs were undertaken on anthropogenic and natural soils produced ten patterns identified by naked eye and confirmed by light microscopy and image processing. Out of the ten patterns identified, three involved buttons that had not been previously documented and another four patterns had only been documented in field experiments. Six patterns were identified in trace soil on the four different fabric types, using all 20 soils. However, there was no consistent trend identified that fabric type had influenced resulting trace soil patterns. Of greater impact to trace soil patterns was clothing seams, buttons, soil moisture and the mineralogical content of clay fractions (i.e. presence of smectite) in producing trace soil patterns. Abundance of soil transferred was dependant primarily on soil moisture, clay content, particle size and clay mineralogy (e.g. smectite). Dark organic loamy-sand textured soil provided the most easy to identify soil transfer patterns against the white fabric.
Image processing software proved valuable in providing quantifiable graphical presentations on:
- quantity of soil transferred, (ii) percentage of individual soil objects and aggregates transferred and (iii) direction patterns and (iv) the ability to identify and compare Munsell colours.
Future experiments will be required to test this new method of forensic soil analysis using an expanded range of clothing fabrics and other methods of soil transfer (e.g. in saturated subaqueous soils under water). At present, image processing software was only programmed to identify soil objects on a white homogenous fabric background. Trace soil patterns on clothing will differ depending on whether a victim is conscious or unconscious when their body makes contact with a soil surface. Developing a method to objectively and scientifically identify and interpret these trace soil patterns would be of substantial benefit to forensic investigators as to warrant further investigations.
We would like to thank the following people:
- The principal author’s sister, Cheryl Robins, for sewing all the fabric squares used in the experiments.
- Associate Professor Ron Berry (Retired), CODES, School of Physical Sciences, The University of Tasmania, for providing invaluable technical expertise with operating image processing software.
- Richie Woolley, Technical Officer, Mineral Resources Tasmania, for providing technical assistance for X-ray Diffraction.
- David Reid, Horticultural Coordinator, Royal Tasmanian Botanical Gardens, Hobart, for his invaluable historical knowledge regarding the establishment of the gardens and the heritage-listed convict-built Eardley Wilmot brick wall.
Garth Oliver, Project Manager, Soil carbon, TIAR, School of Land and Food, University of Tasmania, for his technical support in the laboratory.
- Fitzpatrick R, Raven M (2012) How pedology and mineralogy helped solve a double murder case: using forensics to inspire future generations of soil scientists. Soil Horiz 53: 14-29.
- Fitzpatrick R, Raven M, Forrester S (2009) A systematic approach to soil forensics: criminal case studies involving transference from crime scene to forensic evidence. In: Ritz K, Dawson L, Miller D (eds.) Criminal and Environmental Soil Forensics. Netherlands: Springer p. 105-127.
- Fitzpatrick R, Raven M (2013) Soils In: Siegel J, Saukko P (eds.) Encyclopedia of Forensic Sciences. second ed. Waltham, MA: Academic Press. p. 206-12.
- Fitzpatrick R (2013) Soil: forensic analysis. In: Jamieson A, Moenssens A (eds.) Wiley Encyclopedia of Forensic Science. Chichester, West Sussex
- Murray R (2011) Evidence from the Earth: Forensic Geology and Criminal Investigation. (2ndedn.) Missoula, MT: Mountain Press Publishing.
- Pye K (2007) Geological and Soil Evidence: Forensic Applications. Boca Raton, FL: CRC Press.
- Ruffell A, McKinley J (2008) Geoforensics. Chichester: John Wiley & Sons, Ltd.
- Morgan R, Bull P (2007) Forensic geosciences and crime detection: Identification, interpretation and presentation in forensic geoscience. Minerva Medicolegale 127: 73-89.
- Bull PA, Parker A, Morgan RM (2006) The forensic analysis of soils and sediment taken from the cast of a footprint. Forensic Sci Int 162: 6-12. [Crossref]
- Fitzpatrick R, Raven M, Self P (2011) Detailed mineralogical characterization of small brick and soil fragments (<0.5mm diameter) by Synchrotron X-ray diffraction analyses for further forensic comparisons relating to operation Dargan. Centre for Australian Forensic Soil Science Restricted Client Report. p. 1-116.
- Raven M, Fitzpatrick R, Self P (2016) Trace evidence examination using laboratory and synchrotron X-ray diffraction techniques Paper no. 1131. 35th International Geological Congress, Symposium on Forensic Soil Science and Geology. Cape Town, South Aftrica.
- Martin B (2012) The State of Western Australia v. Rayney. [No 3]: WASC 1-369.
- Martin B (2012) Judgement Summary: The State of Western Australia v. Rayney. [No 3]: WASC; p. 1-13.
- Morgan R, Cohen J, McGookin I, Murly-Gotto J, O’Connor R, Muress S, et al. (2009) The relevance of the evolution of experimental studies for the interpretation and evaluation of some trace physical evidence. Sci Justice 49: 277-285. [Crossref]
- Murray K, Fitzpatrick R, Bottrill R, Berry R, Kobus H (2016) Soil transference patterns on bras: Image processing and laboratory dragging experiments. Forensic Sci Int 258: 88-100. [Crossref]
- Murray K, Fitzpatrick R, Bottrill R, Kobus H (2017) Patterns produced when soil is transferred to bras by placing and dragging actions: the application of digital photography and image processing to support visible observations. Forensic Science Int. [In Press]
- Sugita R, Marumo Y (1996) Validity of color examination for forensic soil identification. Forensic Science Int 83: 201-210.
- Bigham J, Ciolkosz E (1993) Soil Color. SSSA Special Publication 31: 159.
- Fitzpatrick R, Raven M (2016) Guidelines for conducting criminal and environmental soil forensic investigations: Version 10.1. South Australia: Centre for Australian Forensic Soil Science (CAFSS).
- Munsell_Color_Company (2009) Munsell Soil Color, Book. Michigan: Munsell Color X-rite.
- Murray K, Fitzpatrick R, Bottrill R, Berry R, Woolley R, Doyle R, et al. (2016) Soil patterns on bra fabrics dragged across different soil surfaces using image analyses: laboratory dragging experiments. Acid Sulfate Soils Report No ASSC_096.
- Adelaide: The University of Adelaide, Australia (2015) p. 1-100. (http://www.adelaide.edu.au/directory/robert.fitzpatrick?dsn=directory.file;field=data;id=34394;m=view).
- Department of Primary Industries P, Water and Environment (2015) LISTmap - Land Information System Tasmania. Tasmania: DPIPWE; http://maps.thelist.tas.gov.au/listmap/app/list/map.
- Isbell R, National_Committee_on_Soils_and_Terrain (2016) The Australian Soil Classification. 2nd ed. Clayton, Victoria, Australia: CSIRO Publishing.
- IUSS_Working_Group_WRB. World Reference Base for Soil Resources 2014. International soil classification system for naming soils and creating legends for soil maps. World Soil Resources Reports No 106. Rome: FAO p. 1-181. (http://www.fao.org/3/a-i3794e.pdf).
- Fitzpatrick R (2013) Demands on soil classification and soil survey strategies: special-purpose soil classification systems for local practical use. In: Taha F, Abdelfattah M (eds.) Developments in Soil Classification, Land Use Planning and Policy Implications: Innovative Thinking of Soil Inventory for Land Use Planning and Management of Land Resources. Netherlands: Springer; p. 51-83.
- Holcombe R (2011) GEOrient. Queensland, Australia: School of Earth Sciences, University of Queensland. http://www.holcombe.net.au/software/rodh_software_georient.htm.
- Weaver C (1990) Clays, muds and shales. In: Weaver C (ed.) Developments in Sedimentology. Amsterdam: Elsevier.
- McDonald R, Isbell R (2009) Soil Profile (3rdedn.) Melbourne: CSIRO Publishing.


