The negatively charged gold nanoparticles (nano-Au) in solutions of high ionic strength interact with free, linear double-stranded (ds) DNA or synthetic poly(ribonucleotide) (poly(I)×poly(C) or poly(A)×poly(U)) molecules or with these molecules ordered in spatial structure of the cholesteric liquid-crystalline dispersion (CLCD) particles formed as a result of their phase exclusion from solutions containing poly(ethylene glycol). However, the consequences of these interactions are differing noticeably. If first to pretreate free ds nucleic acid (NA) molecules with nano-Au and then to create the dispersion, the orientationally ordered structures do not form. This leads to disappearance of abnormal band in the circular dichroism spectra at very low concentration of added nano-Au. If to treat condensed ds NA, i.e., ds NA in the content of CLCD particles, with nano-Au, the orientational order is remaining stable. This order evolves (from cholesteric to untwisted, nematic-like) upon increase of nano-Au concentration. The preliminary measurements and evaluations show the analogous spectral changes are typical also for palladium nanoparticles. The differences in nano-Au action on free and condensed ds NA molecules can result in various damaging effects in living cells and be accompanied by various genetic consequences.
nanoparticles of noble metals; double-stranded nucleic acids; circular dichroisms; cholesteric liquid-crystalline DNA dispersions; aggregated DNA molecules
In recent years several review papers [1–3] devoted to hybrid materials formed by nanoparticles dispersed in liquid-crystalline (LC) phases or lamellar structures of low molecular mass compounds. Especially interesting in this respect cholesteric liquid crystals because of competition between non-chiral nanoparticle aggregation and chiral cholesteric twisting. Such hybrid materials can combine typical electronic properties of metal nanoparticles (light absorption, electrical conductivity, magnetism, etc.) with characteristic properties of liquid crystals (fluidity, anisotropy, etc.)
The investigation of these materials has become the focus of intense worldwide research, motivated by the perspective of practical applications (display technology, drug delivery, information storage and so on). From a more fundamental point of view, this approach allows one to create materials with new, sometimes unexpected, properties.
It is noteworthy that many studies in this branch of nanotechnology are dealing to the properties of liquid crystals or lamellar phases doped with silver or gold nanoparticles (nano-Au) due to their exceptional optical properties [4-9]. Indeed, the chemical and physical properties of noble metal nanoparticles depend on their size, shape, structure, and dielectric environment [10,11].
Concerning the liquid crystals made of high molecular mass biopolymers (e.g., of DNA molecules), such systems were handled with nano-Au. The latter investigations have been started in 2010 [12], although properties of linear single-stranded (ss) and double-stranded (ds) DNA molecules containing nano-Au on their surfaces were reported in pioneering contributions by Mirkin [13] and Alivisatos [14].
One can note that the physicochemical properties of spatially twisted (cholesteric) liquid-crystalline dispersions (CLCDs) of ds DNA reflect some properties of these macromolecules in biological objects such as chromosomes of primitive organisms (for instance, chromosomes of the Dinoflagellate) and DNA-containing viruses [15,16].
Hence, doping ds DNA CLCDs with nano-Au is interesting for both biologists and researchers in the area of nanotechnology.
From fundamental point of view, the current understanding of physical and chemical mechanisms behind CLCDs + nano-Au properties still remains limited. Specifically, a question why linear ss DNA can effectively adsorbs nano-Au whereas ds DNA does not, is still poorly investigated. Besides, there is a set of papers [17-24] with opposite statements concerning interaction of linear ds DNA molecules with nano-Au. These inconsistencies in the literature reflect the lack of a complete understanding of the fundamental interaction mechanism between nano-Au and DNA molecules.
The purpose of our study is to reveal phenomena caused by the nano-Au action on ds DNA molecules. It seems constructive to pose a few questions and to answer them on a general level. Namely we tried to answer the following questions.
1) Whether nano-Au are coordinated to linear ds DNA molecules in colloid solutions?
2) Whether (linear ds DNA-nano-Au) complex can form CLCD in polymer-containing solution?
3) Whether nano-Au can interact with the ds DNA molecules assembled in particles of CLCDs and alter their spatial structure?
Preparation of metal nanoparticles and determination their average sizes
Colloid solutions containing nano-Au of different sizes were used in this study. Solutions (hydrosols) containing nano-Au with the average diameters of 2, 5 and 15 nm were prepared by reduction of HAuCl4 according to the previously described procedures. Specifically, 2 nm nano-Au with the number particle concentration of CN = 3.5 × 10¹⁵ particle ml-1 were obtained by Duff method [25] 5 nm nano-Au (CN = 1.3 × 10¹³ particle ml-1) were fabricated according to method described by Khlebtsov et al., [26] Finally, 15 nm nano-Au(CN = 5 × 10¹² particle ml-1) were synthesized according to Frens citrate protocol [27] The numerical concentrations of all nano-Au samples were calculated using the material balance (provided that Au is reduced completely).
Pulsed laser ablation in water was used to prepare nano-Au and palladium nanoparticles (nano-Pd). Generation of metal nanoparticles via laser ablation of solid target in liquid was described in details elsewhere [28].
Bulk metallic target immersed into deionized water was ablated by laser irradiation. For generation of nano-Au ytterbium fiber laser with pulse duration of 70 ns, repetition rate of 20 kHz and pulse energy of 1 mJ at 1060-1070 nm was used. Focal spot on the target surface was about 50 mm in diameter with 207 mm F-Theta objective.
Nano-Pd were obtained by means of the first harmonics of Nd:YAG Fuego laser system (Time-Bandwidth) with pulse duration of 10 ps, repetition rate of 200 kHz and pulse energy of 500 mJ at 1064 nm. Focal spot on the target surface was about 70 mm in diameter with 150 mm F-Theta objective. Laser focal spot was moved across the sample surface with scanning galvo mirror system at the speed of 1000 mm s-1.
Ablation process leads to the reddish coloration of solution for nano-Au and brownish for nano-Pd [29].
All nanoparticles were negatively charged. Their ξ -potentials at neutral pH values were approximately – 40 mV.
The average sizes (diameters) of the metal nanoparticles in stock preparations were verified by transmission electron microscopy (TEM). Micrographs of nanoparticles were obtained using a Jem-100CX electron microscope (Jeol, Japan).
Nucleic acids and chemicals
A calf thymus depolymerized ds DNA (Sigma, USA) with a molecular mass of ∼(0.6–0.8) × 106 Da after additional purification was used. A synthetic ds poly(ribonucleotides) poly(I)×poly(С) (Sigma, lot 023K4032, USA; molecular mass ∼0.3 × 10⁶ Da) and poly(A)×poly(U) (Sigma, lot 066K4015, USA; molecular mass ∼0.3 × 10⁶ Da) were used without additional purification.
Ds nucleic acid (NA) concentrations in the water–salt solutions were determined spectrophotometrically using the known values of the molar extinction coefficients
(εmax = 6,600 M-1 cm–1 for DNA, εmax = 4,900 M-1 cm–1 for poly(I)×poly(С) and εmax = 5,740 M-1 cm–1 for poly(A)×poly(U)).
Poly(ethylene glycol) (PEG; Serva, Germany; molecular mass of 4,000 Da) and cyanine dye SYBR Green I (SG; Sigma, USA) samples were used without additional purification. SG concentration in the water-salt solutions was determined spectrophotometrically using the known value of the molar extinction coefficient (emax ∼ 73000 M-1 cm–1 [30]). The stock solution of SG was stored at 4°C in the light-tight container.
Formation of ds NA CLCDs
Standard CLCDs of ds linear ds DNA or poly(ribonucleotide) molecules were prepared according to the technology of intensive mixing (stirring) of PEG-containing water-salt (∼ 0.3 M NaCl) solution with water-salt (∼ 0.3 M NaCl) ds NA solution. Al details of this technology can be found in [16].
Measurements
The absorption spectra were taken by Cary 100 Scan (Varian, USA) spectrophotometer. The circular dichroism (CD) spectra were recorded using a SCD-2 portable dichrometer (produced by Institute of Spectroscopy of the Russian Academy of Sciences, New Moscow-Troizk) [31]. The CD spectra were represented as a dependence of the difference between the intensities of absorption of left- and right-handed polarized light (ΔA; ΔA = (AL – AR)) on the wavelength (λ).
Structure analysis of the DNA phases by SAXS
Pellet (∼3 mg) obtained by slow speed centrifugation (5,000 rev. min.-1, 40 min., 4°C; centrifuge K-23, Germany) of the DNA CLCD particles and the particles formed as a result condensation of DNA molecules pretreated with nano-Au (∼15 nm) in PEG-containing water-salt solution were analyzed by small-angle X-ray scattering (SAXS). The measurements were done on a laboratory diffractometer Amur-K using a Kratky-type (infinitely long slit) geometry in the range of the momentum transfer 0.12<s<10.0 nm-1, where s=(4psinq)/l, 2q is the scattering angle, and λ=0.1542 nm is the X-ray wavelength. The experimental scattering profiles were corrected for the background scattering from the solvent, and preliminary processed using standard procedures [32].
The repeating distances of the periodical motifs in the crystalline regions ( = 2π/smax), corresponding to the peak position (smax) on the scattering patterns, were calculated using program PEAK [32]
The mean long-range order dimension, L, (the size of crystallites) and the degree of disorder in the system
(Δ/ đ ) were calculated from the standard equations as described in [33-35].
We have used three different approaches to clarify a problem of
(ds NA-nano-Au) possible (if any) interaction:
1) doping of linear ds NAs with nano-Au;
2) condensation of (linear ds NA-nano-Au) complexes (if they are formed);
3) doping of CLCDs formed by linear ds NAs with nano-Au.
CD spectra of linear ds NAs doped with nano-Au
Here we have used a low concentration of ds NA molecules (∼10-8 M) to prevent their nonspecific aggregation in solution.
To investigate if nano-Au can bound to ds NAs, CD spectra for these biopolymers doped with nano-Au were measured first and compared with spectra for control samples without particles.
Figure 1a shows that the amplitude of band at λ∼275 nm in the CD spectrum of linear
ds DNA (B-form) in the presence of nano-Au (2 nm; curves 2-3) is somewhat diminished in comparison to the free ds DNA (curve 1).
However, in the case of linear ds poly(I)×poly(C) (A-form) doped with nano-Au the decrease in amplitudes of both bands in the CD spectrum of this polymer is more noticeable Figure 1b, compare curve 1 with curves 2-5).
The observed spectral changes in both cases detected at R values about 2-8 (R is number of nano-Au per 1 NA molecule) are not consistent with denaturation of ds NA molecules [36].
Hence, under used conditions the small alterations in the CD spectra of water-salt solutions containing linear ds DNA or ds poly(I)×poly(C) molecules doped with nano-Au can reflect a minor perturbation of the linear, ds structure of these molecules induced by nano-Au binding.
Because the concentrations of chemically synthesized nano-Au with diameters of about
5 and 15 nm were 1013 and 1012 particles ml-1, respectively, we cannot experimentally obtain high R value for these cases and, hence, we cannot quantitatively definitely detect the changes in the CD spectra of linear ds NAs at their doping of with such Nano-Au.
Comparison of data obtained by us to results of [37] suggests that statement about binding of linear ds NAs with nano-Au, based only on modifications in their CD spectra, needs additional verification.
The phase exclusion from PEG-containing solutions of linear ds NAs pretreated with nano-Au
Here we utilize experimental approach: ‘Solution of linear ds NAs was doped with
nano-Au (of definite size) and stored within 1 h at room temperature. Then final composition was mixed under stirring with PEG solution. As a result, phase exclusion of ds NA molecules (or (ds NA-nano-Au) complexes, if they are formed) takes place. After 1 h of additional exposition, the CD spectra of obtained mixture were measured’. (One can add that the process of phase exclusion of linear ds NAs is known since Lerman’s experiments as “ψ-condensation” (psi is the acronym for polymer-salt-induced) [38,39].
In the case of linear, rigid, low molecular mass ds NAs it is accompanied by formation of LC dispersion [16]. Particles of this dispersion have spatially twisted or a so-called ‘cholesteric’ structure and the term ‘cholesteric liquid-crystalline dispersion’ (CLCD) is used to signify dispersion formed by these particles [16].
The CD spectra of CLCDs formed by ds linear DNA and ds poly(I)×poly(C) pretreated with nano-Au (∼2 nm) are compared in Figure 2a.
First of all, one can see that the formation of CLCDs of both types of ds NA
(compare curve I-1 and curve II-1) in PEG-containing water-salt solutions is accompanied by an appearance of abnormal bands in the CD spectra located in the region of absorption of nitrogen bases (λ∼270 nm). The appearance of these abnormal (negative or positive) bands univocally testifies the cholesteric twist of neighboring quasinematic layers in particles of NA dispersions [36] The negative sign of the band in the CD spectrum proves the left-handed twist of the right-handed DNA molecules (B-form, curve I-1), whereas the positive sign corresponds the right-handed twist of the right-handed poly(I)×poly(C) molecules (A-form, curve II-1) in the formed particles [36]
Figure 2b shows that in both cases the amplitudes of abnormal bands in the CD spectra drop. Hence, the decrease in the amplitudes of abnormal bands in the CD spectra (curves I-2 - I-5 and II-2 – II-5) does not depend on parameters of the secondary structure of ds NA molecules. The higher the concentration of nano-Au in solution, the greater is decrease in abnormal band in CD spectra of CLCDs of both types of NAs.
The CLCDs were formed as well by ds DNA molecules pretreated with 5, 15 nm
nano-Au and with nano-Pd (the average size is about 10 nm). The CD spectra of all these CLCDs were measured and the dependences of abnormal band amplitudes upon concentration of nanoparticles are compared in Figure 2b (curves 4-6). One can see, first of all, that there is strong dependence of spectral effect upon concentration of all nanoparticle types. The higher the concentration of nano-Au in solution, the greater is decrease in abnormal band in CD spectra of CLCDs of NAs. Second, spectral effect depends on the size of nano-Au, i.e., the greater the size of nano-Au, the smaller is the critical value of R for vanishing of abnormal band in the CD spectra. The disappearance of abnormal bands for the CLCDs takes place at very low R values (below 1). For instance, in the case of big nano-Au (15 nm, curve 5) it happens at R about 0.2 (i.e., at 1 nano-Au per 5 ds DNA molecules). It is worth to note that the similar changes in the CD spectrum occur also for linear ds DNA pretrated with nano-Pd (curve 6).
The CLCDs have been formed by ds poly(A)×poly(U) pretreated with 2 nm nano-Au. Figure 2b (curve 3) shows disappearance of abnormal band in this case, as well.
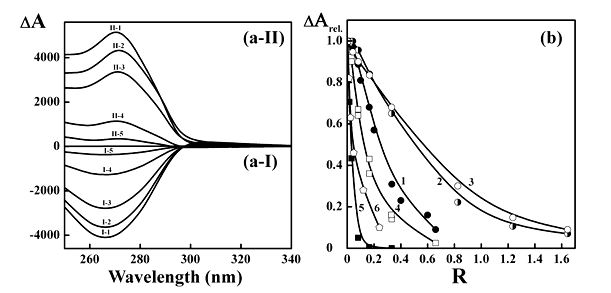
Figure 2. (a-I) The CD spectra of LCDs formed by ds DNA molecules pretreated in solution of moderate (∼0.3) ionic strength with different concentrations of nano-Au.
I-1 - R = 0; I-2 – R = 0.083; I-3 – R = 0.165; I-4 – R = 0.333; I-5 – R = 0.660.
СDNA = 10 μg ml-1; СPEG = 170 mg ml-1.
0.3 M NaCl + 0.002 M sodium phosphate buffer.
(a-II) The CD spectra of LCDs formed by ds molecules of synthetic poly(ribonucleotide) poly(I)×poly(C) pretreated in solution of moderate (∼0.3) ionic strength with different concentrations of nano-Au.
II-1 - R = 0; II-2 - R = 0.165; II-3 - R = 0.331;
II-4 - R = 0.826; II-5 - R = 1.645.
Сpoly(I)×poly(C) = 10.5 μg ml-1; СPEG = 190 mg ml-1.
0.3 M NaCl + 0.002 M sodium phosphate buffer.
The average size of nano-Au is ∼ 2 nm.
R – see Figure 1.
ΔА×10-6 optical units; l = 1 cm.
(b) The dependence of the relative amplitude band (λ = 270 nm) in the CD spectra of the LCDs formed by linear ds DNA molecules and synthetic polynucleotides pretreated in solutions of moderate (~0.3) ionic strength with nano-Au of different sizes versus R value.
1 – DNA + 2 nm nano-Au;
2 – poly(I)×poly(C) + 2 nm nano-Au;
3 - poly(A)×poly(U) + 2 nm nano-Au;
4 – DNA + 5 nm nano-Au;
5 – DNA + 15 nm nano-Au;
6 – DNA + 10 nm nano-Pd (produced by pulsed laser ablation in water).
СDNA = 10 µg ml-1; СPEG = 170 mg ml-1.
0.3 M NaCl + 0.002 M sodium phosphate buffer.
Сpoly(I)×poly(C) = 10.5 µg ml-1; СPEG = 190 mg ml-1;
0.3 M NaCl + 0.002 M sodium phosphate buffer.
Сpoly(A)×poly(U) = 10 µg ml-1; СPEG = 190 mg ml-1;
0.3 N NaCl + 0.002 M sodium phosphate buffer.
ΔАотн. = ΔА/ΔАmax.
The CD spectra shown in Figure 2 demonstrate clearly that the negatively charged
nano-Au and nano-Pd must undoubtedly be bound to initial ds NA molecules to induce the changes in abnormal optical activity of CLCD particles. The binding process depends definitely upon size of nanoparticles. Namely, the greater the size of nanoparticles, the more effective changes in the abnormal optical activity of the CLCD particles.
To confirm possible correlation between change in the abnormal optical activity of the CLCD particles and binding of nano-Au to ds DNA molecules the fluorescence images of the particles formed by DNA molecules, pretreated with the most ‘effective’ nano-Au (15 nm) (obtained DNA particles were also additionally doped with intercalating fluorescence dye – SG), were investigated. These images (Figure 3c) were compared to the images of the CLCD formed by initial ds DNA (Figure 3a). Then both systems were diluted with water to diminish osmotic pressure of PEG solution and to obtain its concentration below ‘critical’ value [16]. Figure 3b and Figure 3d show that under these conditions (i.e., at low concentration of PEG) the spatial structure of ds DNA CLCD is disintegrated and ds DNA molecules are existing in isotropic (noncondensed) state. This process results in full disappearance of fluorescence images of ds DNA CLCD (Figure 3b). However, fluorescence images of CLCD formed by ds DNA molecules pretreated with nano-Au exist despite of its dilution (Figure 3d). This is possible only if nano-Au are connecting neighboring ds DNA molecules and formed aggregate from DNA molecules can exist in absence of high osmotic pressure of PEG-containing solution.
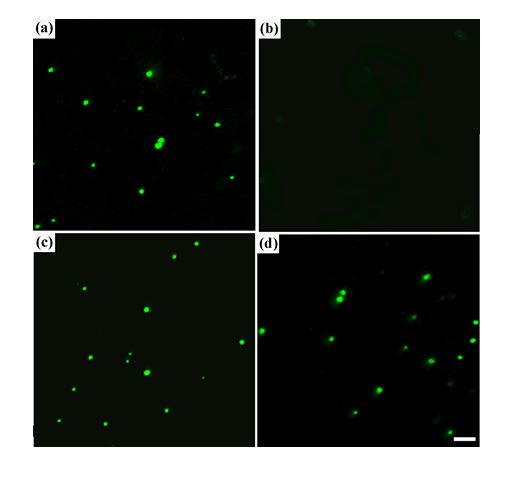
Figure 3. Fluorescent ‘images’ of the free ds DNA CLCD particles (a) and the dispersion particles formed in the PEG-containing water-salt solution by the ds DNA molecules pretreated with nano-Au (c). Both types of the DNA particles were doped with intercalating compound – cyanine dye SG.
(b) and (d) – ‘images’ obtained after dilution with water of initial PEG solutions containing particles shown in Figs. (a) and (c).
The scale bar corresponds to 2 µm.
(a) СDNA = 15 µg ml-1; СPEG = 170 mg ml-1; 0.3 M NaCl + 0.002 M sodium phosphate buffer; Сt SG = 4.9×10⁻⁶ M.
(c) СДНК = 15 µg ml-1; СPEG = 170 mg ml-1; 0.3 M NaCl + 0.002 M sodium phosphate buffer; Сnano-Au = 2.5×10¹² particle ml-1; Сt SG = 4.9×10⁻⁶ M.
The average size of nano-Au is ∼ 15 nm.
To get more information on the properties of condensed phase formed by ds DNA molecules pretreated with nano-Au (15 nm) we apply SAXS.
Experimental scattering intensity profiles from the cholesteric phase of ds DNA (curve 1, control,) and from the phase formed from the ds DNA pretreated with nano-Au (curve 2) are presented in Figure 4. Scattering profile from the cholesteric phase formed by free linear ds DNA molecules (Figure 4, curve 1) demonstrates characteristic Bragg peak typical for densely packed ds DNA molecules in CLCD particles with structural parameters shown in Table 1.
Table 1. Structural characteristics of the DNA cholesteric phase
Sample |
smax, nm-1
(± 0.1 nm-1) |
đ, nm
(± 0.1 nm) |
L, nm
(± 3.0 nm) |
∆ / đ
(± 0.01) |
DNA
liquid-crystalline phase |
1.9 |
3.4 |
16.0 |
0.15 |
Note: smax – the wave vector (s = 4πSinθ/λ; 2θ - the scattering angle; λ - the X-ray
wavelength equal 0.1542 nm);
đ - the periodicity of the structure (the interhelical distance);
L - the crystallite size;
∆/đ - the degree of disorder (∆ - the mean square deviation of distances between
neighboring regularly packed structural elements; đ - the periodicity
of the structure (the interhelical distance)).
Figure 4 (curve 2) shows as well that pretreatment of linear ds DNA with nano-Au and phase exclusion of the formed complex (ds DNA-nano-Au) from PEG-containing solution results in: (i) the disappearance of the Bragg maximum, i.e., in a total, even nematic-like, disintegration of the orientational order of ds DNA molecules and spatial structure of the CLCD, and (ii) in the emerging of the characteristic scattering caused by big size nano-Au. The latter phenomenon allows us to determine a size of the nano-Au using ratio: R = 4.49/sn, where sn – position of the first minimum on the scattering pattern [40]. In our case R = 4.49/0.64 ≈ 7 nm, that is, about 14 nm in diameter. The value, which fits results of 15 nm nano-Au TEM micrographs, should be considered as an average size due to polydispersity of the nano-Au sample.
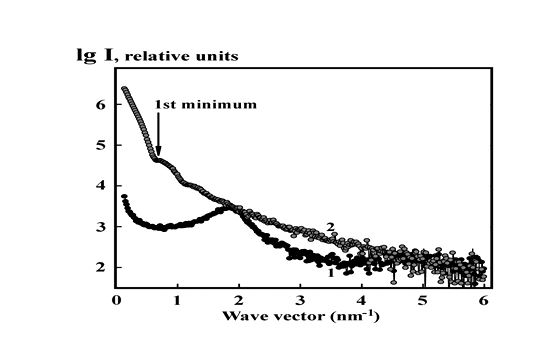
Figure 4. Experimental SAXS curves of phase obtained from the CLCD formed by free, linear, ds DNA molecules in PEG-containing water-salt solution (curve 1, control) and of phase formed in the PEG-containing water-salt solution by ds DNA molecules pretreated with nano-Au (curve 2).
Arrow marks the first minimum on the scattering curve 2.
1 - СDNA = 15 µg ml-1; СPEG = 170 mg ml-1; 0.3 M NaCl + 0.002 M sodium phosphate buffer;
2- СДНК = 15 µg ml-1; СPEG = 170 mg ml-1; 0.3 M NaCl + 0.002 M sodium phosphate buffer; Сnano-Au = 2.5×10¹² particle ml-1 (the average size of nano-Au is ∼ 15 nm).
The results of SAXS demonstrate that 15 nm nano-Au affect the interaction between molecules of (ds DNA-nano-Au) complex. Instead of ordered spatial structure of ds DNA CLCD only random disordered aggregates are formed by molecules of these complexes at their condensation.
Hence, all obtained in this section results speak in favor of binding of nano-Au to the ds DNA molecules. However, such complexes of (ds DNA-nano-Au) complexes, in contrast to the free ds DNA molecules, lose an ability to form spatially twisted structure at their condensation. They are capable of forming only aggregates, which do not possess abnormal band in the CD spectrum.
Doping of CLCD particles formed by ds NA molecules with nano-Au
The CD spectra of CLCDs formed by ds NAs and doped with different concentrations of nano-Au (2 nm) after formation of these dispersions are compared in Figure 5a. In both cases the amplitudes of abnormal bands in the CD spectra drop. The higher the concentration of nano-Au in solution, the greater is decrease in abnormal band in CD spectra of CLCDs of both types of NAs. (Here a comment is in order. Any possible aggregation of independent nano-Au outside of the ds NA CLCD particles cannot induce any change in the value of the abnormal band in the CD spectra in the region of absorption of these molecules).
The dependences of abnormal band amplitudes upon concentration of nano-Au are compared in Figure 5b. One can see, first of all, that there is dependence of spectral effect upon concentration of nano-Au, expressed as R value. Second, comparison of Figure 5b to Figure 2b clearly shows that the disappearance of abnormal bands in the case of the formed CLCDs takes place at R values, which are much (∼25 times) higher in comparison to the case of CLCDs formed by ds NA molecules pretreated with nano-Au. Third, the disappearance of abnormal bands in the CD spectra indicates diminishing in twist in spatial structure of CLCD particles. Nevertheless, spatial structure of CLCD particles with ordered packing of 104 ds NA molecules [41] is not changed so easily at nano-Au binding.
It is necessary to note, that doping of CLCDs formed by ds NAs with nano-Au sizes of 5 and 15 nm is accompanied only by small (if any!) changes in the CD spectra [42].
Figure 5 demonstrates that nano-Au of small size (2 nm) are incorporated by this or that way into spatial structure of CLCDs particles, i.e., such small nano-Au can interact even with ds NAs inside of CLCD particles, despite of very tight packing of these molecules.
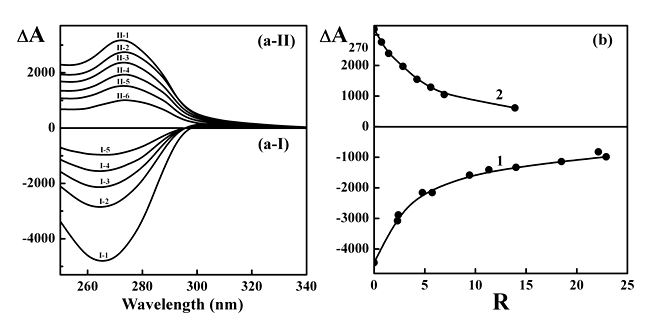
Figure 5. (a) The CD spectra of DNA (a-I) and poly(I)×poly(С) CLCDs (a-II), doped with different concentrations of nano-Au.
(a-I): 1 - R = 0; 2 –R = 2.39; 3 –R = 4.77; 4 – R = 9.42; 5 –R = 22.9.
СDNA = 10 µg ml-1; СPEG = 190 mg ml-1;
0.3 M NaCl + 0.002 M sodium phosphate buffer.
(a-II): 1 - R = 0; 2 –R = 0.72; 3 –R = 1.44; 4 – R = 2.85; 5 –R = 4.23; 6 –R = 6.93.
Сpoly(I)×poly(C) = 12 µg ml-1; СPEG = 190 mg ml-1;
0.3 M NaCl + 0.002 M sodium phosphate buffer.
The average size of nano-Au is ∼ 2 nm.
R – see Figure 1.
ΔА ×10-6 optical units; l = 1 cm.
The CD spectra of NA CLCDs were measured 2 hrs after of their doping with nano-Au.
(b) Dependences of the amplitude of band (λ = 270 nm) in the CD spectra of DNA CLCD (curve 1) and poly (I)×poly(C) CLCD (curve 2) doped with different concentrations of nano-Au on the R value.
СDNA = 10 µg ml-1; Сpoly(I)×poly(C) = 12 µg ml-1;
СPEG = 190 mg ml-1; 0.3 M NaCl + 0.002 M sodium phosphate buffer.
The average size of nano-Au is ∼ 2 nm.
R – see Figure 1.
ΔА270×10-6 optical units; l = 1 cm.
The CD spectra of NA CLCDs were measured 2 hrs after of their doping with nano-Au .
The CD spectra of CLCDs formed by ds NAs and doped with nano-Au (2 nm) after their formation are compared in Figure 6a. It can be seen that the doping of CLCDs with nano-Au reduces the amplitudes of the abnormal bands in the CD spectra of both types of formed dispersions. The curves characterizing the time dependences of the amplitude of the abnormal bands in the CD spectra of DNA and poly(I)×poly(C) CLCDs doped with nano-Au are compared in Figure 6b (curves 1 and 2, respectively). It can be seen that the reduction of the band amplitude occurs in two stages. The duration of the first, fast stage is about 20-40 min
(Figure 6b). The slow stage does not lead, to any significant change in amplitudes of abnormal bands.
Hence, doping of NA CLCDs with nano-Au (2 nm; Figure 6) demonstrates that these negatively charged nanoparticles can be aggregated with tightly packed ds NA molecules. The interaction leads to a ‘disturbance’ of the spatial structure of CLCD particles and causes a decrease in abnormal band in the CD spectra. Phenomenologically, this spectral change can be described as unwinding of the cholesteric spiral, i.e., phase transition of cholesteric → nematic [43].
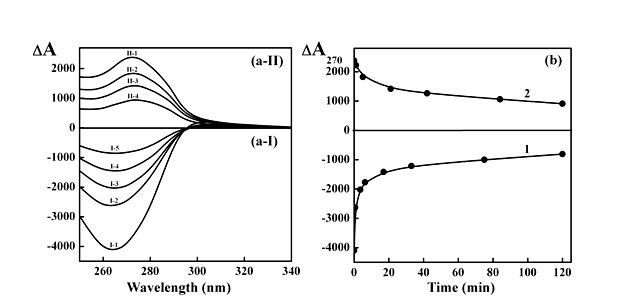
Figure 6. (a) The CD spectra of DNA (a-I) and poly(I)×poly(C) CLCDs (a-II) measured after different time of their doping with nano-Au.
(a-I): I-1 – 0 min; I-2 – 0.6 min; I-3 –3.5 min; I-4 – 17 min; I-5 – 120 min.
(a-II): II-1 – 0 min; II-2 –5 min; II-3 – 21 min; II-4 – 120 min.
(b) Time dependences of the amplitude of the abnormal bands (∆A270) in the CD spectra of DNA (curve 1) and poly(I)×poly(C) CLCDs (curve 2) doped with nano-Au.
СDNA = 10 µg ml-1; Сpoly(I)×poly(C) = 12 µg ml-1;
СPEG = 190 mg ml-1; 0.3 M NaCl + 0.002 M sodium phosphate buffer.
Сnano-Au = 1.67×10¹⁴ particle ml-1 (the average size of nano-Au is ∼ 2 nm).
ΔА×10-6 optical units; DА270×10-6 optical units; l = 1 cm.
The results presented above describe two different situations: i) doping of free, linear ds NA molecules in solution with negatively charged nano-Au, and ii) doping of CLCD particles formed by ds NA molecules with negatively charged nano-Au.
1. Considering minor spectral changes shown in Figure 1 we can suppose that negatively charged nano-Au are somehow attached to the free, linear ds NA molecules in solutions of moderate (∼0.3) ionic strength. Note to the point that the authors of [21] showed earlier that the amplitude of band in the CD spectrum of synthetic ds DNA molecule (ds 25) of very low molecular mass (16.5 × 10³ Da) treated with nano-Au (with an average diameter 13 nm and concentration of 9×10⁻⁹ M, i.e., CN ∼ 5.43 × 10¹² particles ml-1) is reduced compared to the free ds form.
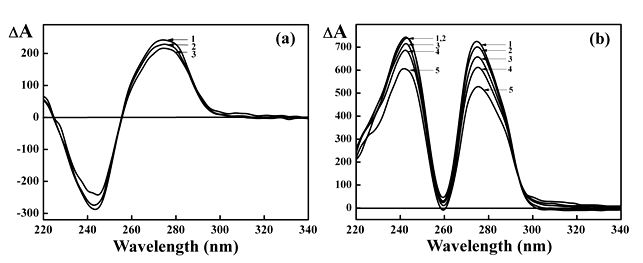
Figure 1. (a) The CD spectra of ds DNA in absence (curve 1) and presence (curves 2-3) of different concentrations of nano-Au.
1 – Cnano-Au = 0 (R = 0);
2 – Cnano-Au = 0.854×10¹⁴ particle ml-1 (R = 3.91);
3 – Cnano-Au = 1.667×10¹² particle ml-1 (R = 7.64).
СDNA = 29 μg ml-1; 0.3 NaCl M + 0.002 M sodium phosphate buffer.
(b) The CD spectra of synthetic ds poly(ribonucleotide) poly(I)×poly(C) in absence (curve 1) and presence (curves 2-5) of different concentrations of nano-Au.
1 – Cnano-Au = 0 (R = 0);
2 – Cnano-Au = 0.174×10¹⁴ particle ml-1 (R = 0.285);
3 – Cnano-Au = 0.517×10¹⁴ particle ml-1 (R = 0.848);
4 – Cnano-Au = 0.854×10¹⁴ particle ml-1 (R = 1.40);
5 – Cnano-Au = 1.667×10¹⁴ particle ml-1 (R = 2.732).
Сpoly(I)×poly(C) = 30.4 μg ml-1; 0.3 M NaCl + 0.002 M sodium phosphate buffer.
The average size of nano-Au is ∼ 2 nm.
R is the ratio of the number of nano-Au to the number of DNA (or poly(I)×poly(C)) molecules in solution.
ΔА×10-6 optical units; l = 1 cm.
Because we were not in position to repeat this result, due to pure experimental reasons, the statement concerning interaction of negatively charged nano-Au with ds NA molecules, based on detection of minor changes in the CD spectra, needs additional verification.
2. The decrease in amplitudes of abnormal bands of CLCDs formed by linear ds DNA and poly(I)×poly(C) molecules pretreated with nano-Au (Figure 2) demonstrates that the negatively charged nano-Au are bound to linear ds NA molecules prior to their ψ-condensation to induce the shown spectral changes. The greater the size of nano-Au, the more effective is changes in the abnormal optical activity of the NA CLCD particles. To rationalize this observation two different mechanisms (‘chemical’ and ‘physical’) can be proposed.
The ‘chemical’ mechanism of nano-Au-ds NA interaction
i) Having in mind the high negative charge of ds NA molecules and the anionic properties of nano-Au, the first question to answer is how these particles bind to these molecules [44].
ii) Indeed since both nano-Au and ds NAs are negatively charged, the long range electrostatic repulsion should suppress any aggregation. However, to obtain ds NA CLCDs we are using the technology of intensive mixing of PEG-containing water-salt (∼0.3 M NaCl) solutions with water-salt (∼0.3 M NaCl) ds NA solutions was used. Under these conditions the electrostatic repulsion between nano-Au and ds biopolymer molecules is minimal. Hence, high salt concentration can facilitate the close approach of nano-Au to the ds NA molecule surface.
iii) If nano-Au are sufficiently close to ds NA molecule surface, the binding event is accompanied by a partial substitution of the stabilizing organic anions on nano-Au for negatively charged phosphates of the DNA, which most likely bound the nano-Au due to the high electronegativity of the metal [44]. Besides, under these conditions, small-size nano-Au (∼2 nm) can be sterically embedded into the major groves of ds DNA molecules, thereby causing a slight distortion in the structural geometry of the B-DNA [45,46]. This mechanism requires a rather strong size limitation, because nano-Au, larger than 2 nm, would be less likely to interact with B-form of DNA or A-form of poly(I)×poly(C) in such a way due to sterical reasons [47].
Hence, the sterical embedment of nano-Au with sizes of 5 and 15 nm into the major groves, as a possible mechanism of (ds NA-nano-Au) interaction must be rejected.
iv) A single nano-Au of any size can, in principle, form complexes with nitrogen base pairs (namely, N7 atoms of purine and N3 atoms of pyrimidine) [17,48] of ds NA. Taking into account a possibility of deformation of spatial structure of nano-Au [49,50] chemical interaction between nitrogen bases and nano-Au appears to be a function of nano-Au size. In this case increasing of nano-Au size may increase the number of free electrons to share with nitrogen bases. But the efficiency of the formation of complexes between nitrogen bases of ds NAs and nano-Au is again limited due to sterical location of nitrogen bases in the spatial structure of ds NAs, and it cannot be considered as the main mechanism of (ds NA-nano-Au) interaction.
So, one has to look for some other explanation for why nano-Au bind to ds NA molecules. In our opinion, the ‘physical’ mechanism (see below) is a good candidate.
The ‘physical’ mechanism of nano-Au-ds NA interaction
Taking into account that CLCDs of ds NAs were obtained at high salt concentration that decreases the electrostatic repulsion between nano-Au and ds molecules, we consider higher other electric multipoles as a possible mechanism of nano-Au binding to ds NAs [21]. One can add here, that the theoretical simulations [51-53] which are modelling the process for “metallization” of ds DNA fragment in an aqueous solution via nano-Au showed that nano-Au are polarized in the intrinsic electric field of DNA molecule. For this case no special chemical functionalization of the surface of the nano-Au is supposed to be performed.
We advocate here the following mechanism of (nano-Au-ds NA) interaction. The charges of the phosphate groups of ds NAs induce a dipole in the highly polarizable nano-Au. This mechanism is quite short ranged (∼1/d4), (where d is the distance between polarization center of nanoparticle and DNA base pair local charge). One might think that the Coulomb repulsion keeps the species apart at longer distances. Under our conditions, the high ionic strength (∼0.3) of the water-salt solution screens the long-range repulsion so the nano-Au are allowed to approach to the DNA base pair charges. At a certain distance, the ion-induced dipole interaction takes over, resulting in a net attractive force. This is accompanied by fixation (immobilization) of nano-Au nearby the surface ds NA molecules. Besides, the polarizability of a conducting sphere is proportional to the cube of the sphere radius, resulting in a large drop in polarizability when changing from 15 nm nano-Au to 2 nm nano-Au. This results in drop of efficiency of nano-Au-ds NA interaction with decrease in the size of nano-Au.
If this is a case, it means that 15 nm nano-Au can be bound with ds NAs stronger in comparison to 2 nm.
Figure 2 shows that pretreatment of ds NAs with 15 nm nano-Au is accompanied by much pronounced drop in an abnormal optical activity of the formed CLCDs in comparison to 2 or 5 nm nano-Au treatment.
If negatively charged nano-Au are indeed bound to the ds NA molecules, the next question to answer is why the amplitude of abnormal band in the CD spectra of CLCDs formed by ds NA pretreated with nano-Au, decreases?
Two points are important here.
1) It was shown earlier that the packing mode of ds DNA molecules in CLCD particles is determined ‘at the moment of their ‘recognition’ [54] during the spatial juxtaposition of neighboring DNA molecules. Spatially, this ‘recognition’ process begins to realize when the distance between neighboring DNA molecules corresponds to 5.0-10.0 nm [15,55-59].
The peculiarities of the ds DNA secondary structure and the distribution pattern of ‘quest’ molecules on their surfaces define not only their ‘recognition’ but the mode of their ordering in quasinematic layers of spatial structure of dispersion particles. The theoretical considerations [36] reveal that formation of the twisted structure of dispersion particles is determined by interaction between neighboring ds DNA molecules, which possess the ‘double’ inherent anisotropy (related with helical structure and the presence of optically active carbon atoms in sugar residues) of DNA molecules. As a result, each subsequent quasinematic layer, formed by ds DNA molecules, is turned by a certain angle (approximately 0.5°) with respect to the previous one. The rotation gives rise to the cholesteric LC structure of a dispersion particle. The ds DNA molecules (B-form) with a right-handed helical twist of the secondary structure form, as a rule, particles with a left-handed helical packing of the quasinematic layers. This is demonstrated by the appearance of a negative CD band in the absorption region of DNA nitrogen bases. Hence, the anisotropic character of the free linear ds DNA molecules and sterical interaction between them specifies helically twisted packing of these molecules in particles formed.
However, combination of shown two items can result in a distortion of the spatially twisted structure of the CLCD particles, and hence, in the decrease (down to full disappearance) of their abnormal optical activity (nematization of spatial structure). This means that abnormal band in the CD spectrum of the CLCD can be considered as a criteria, which reflects any mode of alteration of ds DNA structure induced by chemical or biological compounds.
2) The first experiments [13,14] demonstrated that positively charged nano-Au chemically linked to ss DNA molecules do not prevent their hybridization. Obtained ds DNA molecules, after immobilization on a surface of film for TEM, form planar superstructure, which consists of a few repetitive neighboring ds DNA molecules and nano-Au. In planar superstructure of type (DNA…Au…DNA…Au…DNA) spatial twist of neighboring DNA molecules is absent, despite anisotropy of these molecules [19,60,61].
Coming back to our cas2021 Copyright OAT. All rights reservtion of spatial twisted structure of free ds DNA CLCD particles, as a result of the phase exclusion of these molecules, depends on relatively week anisotropic contribution into electrostatic or Van-der-Waals interaction between neighboring ds DNA molecules. It can be very sensitive to the presence of metallic nanoparticles, i.e., nano-Au.
Taking into account that at formation of CLCD particle with ordered arrangement of
ds NA molecules the ‘recognition’ distance between these molecules is close to 5.0-10.0 nm, one can expect that if nano-Au are indeed fixed nearby surfaces of these molecules, they must sterically prevent both ‘recognition’ and proper spatial orientation of these molecules, which define mutual twist of ds molecules.
Besides, the facet spatial structure of nano-Au [11,62] creates conditions under which neighboring ds DNA molecules in water-salt solutions of high ionic strength can be assembled on various facets of these nanoparticles [63]. This leads to disordered and uncorrelated arrangement of ds DNA molecules on surface of nano-Au, i.e., to formation of ds DNA aggregates (Figure 7). In the framework of this model, the greater the size of nano-Au, the effective is formation of ds DNA aggregates.
Results of SAXS support such consideration. They showed (Figure 4) that ds DNA molecules pretreated with 15 nm nano-Au and condensed in PEG-containing water-salt solution form aggregates with disordered arrangement of these molecules. If this is a case, the abnormal band in the CD spectrum typical for DNA CLCD with spatially twisted structure must be decreased at increase of nano-Au concentration and increase of nano-Au size. Figure 2 confirms this statement, i.e., the greater the size of nano-Au, the smaller is R value of disappearance of abnormal band in the CD spectra.
Hence, negatively charged nano-Au are undoubtedly can be bound to initial ds NA molecules in water-salt solutions of high ionic strength and can form (ds DNA-nano-Au) complexes. Taking into account a possibility of uncorrelated positions of neighboring ds DNA molecules on surface of nano-Au, phase exclusion of these complexes results only in one process, i.e., in formation of disordered aggregates from ds DNA molecules linked via nano-Au (Figure 7). This allows one to suppose that spatial topography of nano-Au may play a role of ‘random external field’, which suppresses both ds DNA molecules recognition and formation of cholesteric structure from (ds DNA-nano-Au) complexes. Analogous transformation of lamellar phases under influence of nanoparticles, including nano-Au (2 nm), was considered in [8,64].
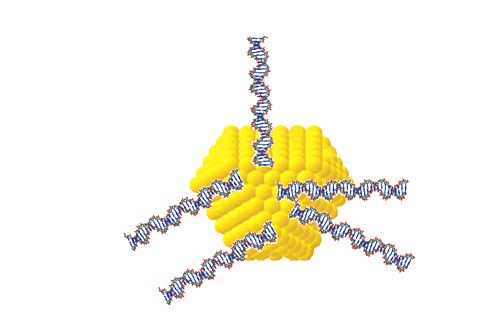
Figure 7. Proposed structure of aggregate formed by a few ds DNA molecules fixed on crystal facets of one gold nanoparticle (15 nm).
Quite different process happens at doping of ds NA CLCDs with high concentration of
nano-Au (2 nm) (Figures 5 and 6).
Taking into account that the changes in the CD spectra of ds NA CLCDs take place at high R values within 20-40 min (Figure 6b), it was supposed that nano-Au with the size (∼ 2 nm) comparable to the distance between ds DNA molecules in quasinematic layers (∼ 3.4 nm ) can quickly incorporate between these molecules ordered in spatial structure of CLCD particles. (The nano-Au with the sizes equal to 5 nm and 15 nm are too ‘big’ in comparison to the distance between ds NA molecules in quasinematic layers, and this prevents their incorporation into content of CLCD particles). Then, within slow stage, which does not result in significant change in amplitude of abnormal band in the CD spectra, interaction between adjacent nano-Au is accompanied by formation of nano-Au clusters in the content of CLCD particles [43].
To check this scenario we made the SAXS measurements of the phases obtained as a result of slow centrifugation of ds DNA CLCD particles doped with different concentrations of nano-Au (2 nm) [42]. (The CLCD phase of free, initial ds DNA was used as a control sample). The results of SAXS measurements showed that all samples doped with nano-Au (2 nm) possess diffuse Bragg maxima. The doping is accompanied only by increase by 0.4–0.5 nm of characteristic size (i.e., the distance between the ds DNA molecules arranged parallel in quasinematic layers. The mutual position of neighboring ds DNA molecules (and, correspondingly, quasinematic layers in ds DNA CLCD particles) changes albeit insignificantly [42,65].
This means that doping of ds DNA CLCD with nano-Au (2 nm) does not lead to the modification in ordering of ds DNA molecules in the particles of CLCD.
However, the incorporation of nano-Au into quasinematic layers of ds DNA CLCD particles and their spatial ordering between these molecules in quasinematic layers must be ‘transformed’ by this or that way into the changes in the total energy of interaction between neighboring ds DNA molecules. For instance, the ‘dipoles’ of neighboring (DNA–nano-Au) complexes would tend to be arranged parallel, which can induce a change in the helical twist of neighboring quasinematic layers. This means that nano-Au may change the contributions determining the helical twist of neighboring quasinematic layers of NA molecules (in particular, the anisotropic contribution to the van-der-Waals interaction). In this case, the twist angle between the layers may turn to zero, which is equivalent to the untwisting of the cholesteric structure of dispersion particles at nano-Au doping. For this process the differences in the secondary structure of various ds NA molecules, are not important.
Figures 5 and 6 indeed demonstrate a quick decrease in amplitudes of abnormal bands in the CD spectra. However, in contrast to case shown in Figure 2, these spectral changes reflect the unwinding of the particle spatial structure (regardless of the origin of NAs) as a result of incorporation of nano-Au into CLCD particles formed by ds NA molecules [36]. This effect is unique as none of the other chemical or biological compounds can cause the complete unwinding of the spatial structure of CLCD particles as a result of their interaction with ds DNA molecules at the room temperature.
Therefore, the results presented above strongly suggest that the negatively charged nanoparticles of noble metals can interact with free ds NA molecules or with these molecules ordered in spatial structure of the CLCD particles. This allows one to hypotesize that nano-Au can induce different damaging effects in mammalian cells which depend on state of ds DNA molecules. The conclusions about the damaging effect of the small nano-Au are confirmed by experimental studies [66-69], which demonstrated their ability to reduce the locomotor activity of ejaculated human and bovine sperms by 25 and 22%, respectively, as well as destroy the nuclear apparatus of mature gametes. Besides it was suggested that the small nano-Au are highly active with respect to the male sperm cells of mammals and humans.[66,70,71] These results provide background to assume that the in vitro and in vivo action of nano-Au on spatially arranged ds DNA structures is similar to that of molecules that possess mutagenic activity.
Results presented above allow one to draw a few important conclusions.
1. The negatively charged nano-Au in solutions of high ionic strength can interact with free ds molecules of NAs or with these molecules ordered in spatial structure of the CLCD particles. This interaction leads to decrease in amplitude of specific bands in the CD spectra.
2. The decrease in abnormal bands in the CD spectra of CLCDs can be induced by two very different reasons: i) formation of aggregates from ds NAs pretreated with nano-Au, or
ii) disappearance of twist of spatial structure of ds NA CLCD particles doped with nano-Au.
3. The processes of dispersing nanoparticles and condensing ds DNA do not commute. If first one disperses nanoparticles in isotropic dilute solution of ds DNA, and then tries to condense the obtained mixture, orientationally ordered structures do not occur. If in other way around, one first condenses the ds DNA and only after formation of cholesteric structure, disperses the nanoparticles, the orientational order remains stable. This order evolves (from cholesteric to untwisted nematic like) upon increasing of nanoparticle concentration. Our working hypothesis is that the both procedures do not commute due to random anchoring field created by a complex topography of nanoparticle surfaces (facets). This random field disorients ds DNA long axis in a dilute solution (where ds DNA can more or less freely rotate individually). On the contrary in the condensed twisted structure the same random field cannot rotate cooperatively ordered ds DNA. Instead, the field disorients the nanoparticles.
4. The changes in the CD spectra of CLCDs do not depend on methods of nano-Au synthesis, but depends on concentration and size of used nanoparticles.
5. According to preliminary measurements and evaluations, analogous spectral changes are typical also for nano-Pd.
6. It is not excluded, that differences in action of nano-Au on ‘free’ and ‘condensed’
ds DNA molecules can result in various damaging effects in living cells and be accompanied by various genetic consequences.
The authors are sincerely grateful to B.N. Khlebtsov and V.A. Khanadeev (Institute of Biochemistry and Physiology of Plants and Microorganisms, the Russian Academy of Sciences) for synthesizing high quality gold nanoparticle samples and for determining their parameters. This work was supported by the Russian Foundation for Basic Research (project no. 16–04–00438-a). E.I. Kats participation in this work was supported by the Russian Science Foundation under Grant number 14-12-00475.
- Hegmann T, Qi H, Marx VM (2007) Nanoparticles in liquid crystals: synthesis, self-assembly, defect formation and potential applications. J Inorg Organomet Polym Mater 17: 483-508.
- Nealon GL, Greget R, Dominguez C, Nagy ZT, Guillon D, et al. (2012) Liquid-crystalline nanoparticles: hybrid design and mesophase structure. Beilstein J Org Chem 8: 349-370.
- Stamatoiu O, Mirzaei J, Feng X, Hegmann T (2012) Nanoparticles in liquid crystals and liquid crystalline nanoparticles. Top Curr Chem 318: 331-393.
- Wang W, Efrima S, Regev O (1999) Directing silver nanoparticles into colloid-surfactant lyotropic lamellar systems. J Phys Chem B 103: 5613-5621.
- Firestone MA, Williams DE, Seifert S, Csencsits R (2001) Nanoparticle arrays formed by spatial compartmentalization in a complex fluid. Nano Lett 1: 129-135.
- Eiser E, Bouchama F, Thathagar MB, Rothenberg G (2003) Trapping metal nanoclusters in "soap and water" soft crystals. Chemphyschem 4: 526-528. [Crossref]
- Kumar PS, Pal SK, Kumar S, Lakshminarayanan V (2007) Dispersion of thiol stabilized gold nanoparticles in lyotropic liquid crystalline systems. Langmuir 23: 3445-3449.
- Pansu B, Lecchi A, Constantin D, Impéror-Clerc M, Veber M, et al. (2011) Insertion of gold nanoparticles in fluid mesophases: size filtering and control of interactions. J Phys Chem C 115: 17682–17687.
- Constantin D, Davidson P (2014) Lamellar Lα mesophases doped with inorganic nanoparticles. Chemphyschem 15: 1270-1282. [Crossref]
- Dykman LA, Bogatyrev VA, Shchegolev SYu, Khlebtsov NG (2008) Golden nanoparticles: synthesis, properties and biomedical application. Moscow: Nauka.
- Louis C, Pluchery O (2012) Gold nanoparticles for physics, chemistry and biology. London: Imperial College Press.
- Skuridin SG, Dubinskaya VA, Rudoy VM, Dement'eva OV, Zakhidov ST, et al. (2010) Effect of gold nanoparticles on DNA package in model systems. Dokl Biochem Biophys 432: 141-143. [Crossref]
- Mirkin CA, Letsinger RL, Mucic RC, Storhoff JJ (1996) A DNA-based method for rationally assembling nanoparticles into macroscopic materials. Nature 382: 607-609. [Crossref]
- Alivisatos AP, Johnsson KP, Peng X, Wilson TE, Loweth CJ, et al. (1996) Organization of 'nanocrystal molecules' using DNA. Nature 382: 609-611. [Crossref]
- Livolant F, Leforestier A (2000) Condensed phases of DNA: structures and phase transitions. Prog Polym Sci 21:1115-1164.
- Yevdokimov YuM, Salyanov VI, Semenov SV, Skuridin SG. Yevdokimov YuM (2011) DNA liquid-crystalline dispersions and nanostructures. Boca Raton - London - New York: CRC Press.
- Herne TM, Tarlov MJ (1997) Characterization of DNA probes immobilized on gold surfaces. J Am Chem Soc 119: 8916-8920.
- Zanchet D, Micheel CM, Parak WJ, Gerion D, Alivisatos AP (2001) Electrophoretic isolation of discrete Au nanocrystal/DNA conjugates. Nano Lett 1: 32-35.
- Kumar A, Pattarkine M, Bhadbhade M, Mandale AB, Ganesh KN, et al. (2001) Linear superclusters of colloidal gold particles by electrostatic assembly on DNA templates. Adv Mater 13: 341-344.
- Storhoff JJ, Elghanian R, Mirkin CA, Letsinger RL (2002) Sequence-dependent stability of DNA-modified gold nanoparticles. Langmuir 18: 6666-6670.
- Sandström P, Boncheva M, Åkerman B (2003) Nonspecific and thiol-specific binding of DNA to gold nanoparticles. Langmuir 19: 7537-7543.
- Li H, Rothberg L (2004) Colorimetric detection of DNA sequences based on electrostatic interactions with unmodified gold nanoparticles. Proc Natl Acad Sci U S A 101: 14036-14039. [Crossref]
- Nelson EM, Rothberg LJ (2011) Kinetics and mechanism of single-stranded DNA adsorption onto citrate-stabilized gold nanoparticles in colloidal solution. Langmuir 27: 1770-1777. [Crossref]
- Liu J1 (2012) Adsorption of DNA onto gold nanoparticles and graphene oxide: surface science and applications. Phys Chem Chem Phys 14: 10485-10496. [Crossref]
- Duff DG, Baiker A, Edwards PP (1993) A new hydrosol of gold clusters. 1. Formation and particle size variation. Langmuir 9: 2301–2309.
- Khlebtsov NG, Bogatyrev VA, Dykman LA, Melnikov AG (1996) Spectral extinction of colloidal gold and its biospecific conjugates. J Colloid Interface Sci 180: 436-445.
- Frens G (1973) Controlled nucleation for the regulation of the particle size in monodisperse gold suspensions. Nature Phys Sci 241: 20-22.
- Shafeev GA (2008) Editor Lackner M. Lasers in Chemistry. Wienheim: Wiley-VCH Verlag.
- Barcikowski S, Menéndez-Manjón A, Chichkov B, Brikas M, Raciukaitis G (2007) Generation of nanoparticle colloids by picosecond and femtosecond laser ablations in liquid flow. Appl Phys Lett 91: 083113.
- Zipper H, Brunner H, Bernhagen J, Vitzthum F (2004) Investigations on DNA intercalation and surface binding by SYBR Green I, its structure determination and methodological implications. Nucleic Acids Res 32: e103. [Crossref]
- Kompanets ON (2004) Portable optical biosensors for detection of biologically active and toxic compounds. Physics-Uspekhi 47: 630-633.
- Konarev PV, Volkov VV, Sokolova AV, Koch MHJ, Svergun DI (2003) PRIMUS: Windows PC-based system for small-angle scattering data analysis. J Appl Cryst 36: 1277-1282.
- Vainshtein BK (1966) Difraction of X-rays by chain molecules. Amsterdam - London - New York: Elsevier Publishing Company 1966.
- Svergun DI (1992) Determination of the regularization parameter in indirect-transform methods using perceptual criteria. J Appl Cryst 25: 495-503.
- Svergun DI (1999) Restoring low resolution structure of biological macromolecules from solution scattering using simulated annealing. Biophys J 76: 2879-2886.
- Yevdokimov YM, Skuridin SG, Salyanov VI, Volkov VV, Dadinova LA, et al. (2015) [About the Spatial Organization of Double-stranded DNA Molecules in the Cholesteric Liquid-crystalline Phase and Dispersion Particles of this Phase]. Biofizika 60: 861-876. [Crossref]
- Li H, Rothberg L (2004) Colorimetric detection of DNA sequences based on electrostatic interactions with unmodified gold nanoparticles. Proc Natl Acad Sci U S A 101: 14036-14039. [Crossref]
- Lerman LS (1971) A transition to a compact form of DNA in polymer solutions. Proc Natl Acad Sci U S A 68: 1886-1890. [Crossref]
- Lerman LS. Editor Hahn FE (1971) Progress in molecular and subcellular biology. Vol. 2. Berlin – Heidelberg – New York: Springer-Verlag 1971.
- Feigin LA, Svergun DI (1987) Structure analysis by small-angle X-ray and neutron scattering. New York: Plenum Press.
- Yevdokimov YuM (2000) From particles of liquid-crystalline dispersions to rigid deoxyribonucleic acid nanoconstructions. Liq Cryst Today 20: 2-19.
- Yevdokimov YuM, Skuridin SG, Salyanov VI, Popenko VI, Rudoy VM, et al. (2011) A dual effect of Au-nanoparticles on nucleic acid cholesteric liquid-crystalline particles. J Biomater Nanobiotechnol 2: 461-471.
- Yevdokimov YuM, Salyanov VI, Kats EI, Skuridin SG (2012) Gold nanoparticle clusters in quasinematic layers of liquid-crystalline dispersion particles of double-stranded nucleic acids. Acta Naturae 4: 78-90.
- Zhang X, Servos MR, Liu J (2012) Surface science of DNA adsorption onto citrate-capped gold nanoparticles. Langmuir 28: 3896-3902. [Crossref]
- Liu Y, Meyer-Zaika W, Franzka S, Schmid G, Tsoli M, et al. (2003) Gold-cluster degradation by the transition of B-DNA into A-DNA and the formation of nanowires. Angew Chem Int Ed Engl 42: 2853-2857. [Crossref]
- Tsoli M, Kuhn H, Brandau W, Esche H, Schmid G (2005) Cellular uptake and toxicity of Au55 clusters. Small 1: 841-844. [Crossref]
- Pan Y, Neuss S, Leifert A, Fischler M, Wen F, et al. (2007) Size-dependent cytotoxicity of gold nanoparticles. Small 3: 1941-1949. [Crossref]
- Jang NH (2002) The coordination chemistry of DNA nucleosides on gold nanoparticles as a probe by SERS. Bull Korean Chem Soc 23: 1790-1800.
- Pichugina DA, Mazhuga FG, Shestakov AF. Razumov VF, Klyuev MV (2013) editors. Organic and hybrid nanomaterials: trends and prospects. Ivanovo (Russia): Publisher Ivanovo State University.
- Weitz DA, Lin MY, Sandroff CJ (1985) Colloidal aggregation revisited: new insights based on fractal structure and surface-enhanced Raman scattering. Surf Sci 158: 147-164.
- Komarov PV, Zherenkova LV, Khalatur PG (2008) Computer simulation of the assembly of gold nanoparticles on DNA fragments via electrostatic interaction. J Chem Phys 128: 124909. [Crossref]
- Zherenkova LV, Komarov PV, Khalatur P G (2007) Simulation of the metallization of a fragment of a deoxyribonucleic acid molecule with gold nanoparticles. Colloid J 69: 706-717.
- Komarov PV, Zherenkova LV, Khalatur PG, Khokhlov AR (2007) The self-assembly of a metalloorganic nanoaggregates based on the electrostatic interaction between DNA molecules and gold nanoparticles polarized in its field. Nanotechnologies in Russia 2: 92-98.
- Yevdokimov YuM, Salyanov VI, Golo VL, Kats EI, Spener F (2000) Double-stranded right-handed nucleic acid molecules of B-family do not “recognize” double-stranded right handed molecules of A-family at formation of liquid-crystalline dispersions in PEG-containing solutions. Sensory Systems 14: 246-257.
- Livolant F (1984) Cholesteric organization of DNA in vivo and in vitro. Eur J Cell Biol 33: 300-311. [Crossref]
- Yevdokimov YuM, Skuridin SG, Salyanov VI (1988) Liquid-crystalline phases of double-stranded nucleic acids in vitro and in vivo. Liq Cryst 3: 1443-1459.
- Strey HH, Parsegian VA, Podgornik R (1997) Equation of state for DNA liquid crystals: fluctuation enhanced electrostatic double layer repulsion. Phys Rev Lett 78: 895-898.
- Podgornik R, Parsegian VA (1998) Charge-fluctuation forces between rodlike polyelectrolytes: pairwise summability reexamined. Phys Rev Lett 80: 1560-1563.
- Kanduc M, Dobnikar J, Podgornik R (2009) Counterion-mediated electrostatic interactions between helical molecules. Soft Matter 5: 868–877.
- Sastrya M, Kumar A, Datar S, Dharmadhikari CV (2001) DNA-mediated electrostatic assembly of gold nanoparticles into linear arrays by a simple drop-coating procedure. Appl Phys Lett 78: 2943-2945.
- Warner MG, Hutchison JE (2003) Linear assemblies of nanoparticles electrostatically organized on DNA scaffolds. Nature Mater 2: 272- 277.
- Kinge S, Crego-Calama M, Reinhoudt DN (2008) Self-assembling nanoparticles at surfaces and interfaces. Chemphyschem 9: 20-42. [Crossref]
- Imura Y, Morita C, Endo H, Kondo T, Kawai T (2010) Reversible phase transfer and fractionation of Au nanoparticles by pH change. Chem Commun (Camb) 46: 9206-9208. [Crossref]
- Constantin D, Davidson P (2014) Lamellar Lα mesophases doped with inorganic nanoparticles. Chemphyschem 15: 1270-1282. [Crossref]
- Yevdokimov YuM, Skuridin SG, Salyanov VI, Popenko VI, Shtykova EV, et al. (2014) A new nanobiomaterial: particles of liquid_crystalline DNA dispersions with embedded clusters of gold nanoparticles. Nanotechnologies in Russia 9: 194–202.
- Wiwanitkit V, Sereemaspun A, Rojanathanes R (2009) Effect of gold nanoparticles on spermatozoa: the first world report. Fertil Steril 91: e7-8. [Crossref]
- Kang B, Mackey MA, El-Sayed MA (2010) Nuclear targeting of gold nanoparticles in cancer cells induces DNA damage, causing cytokinesis arrest and apoptosis. J Am Chem Soc 132: 1517-1519. [Crossref]
- Khlebtsov N, Dykman L (2011) Biodistribution and toxicity of engineered gold nanoparticles: a review of in vitro and in vivo studies. Chem Soc Rev 40: 1647-1671. [Crossref]
- Dykman LA, Khlebtsov NG (2014) Uptake of engineered gold nanoparticles into mammalian cells. Chem Rev 114: 1258-1288. [Crossref]
- Zakhidov ST, Marshak TL, Malolina EA, Kulibin AYu, Zelenina IA, et al. (2010) Gold nanoparticles impair nuclear chromatin decondensation process in murine sperm cells in vitro. Biochemistry (Moscow) Suppl Series A: Membrane and Cell Biology 4: 285-288.
- Zakhidov ST, Pavliuchenkova SM, SamoÄlov AV, Mudzhiri NM, Marshak TL, et al. (2013) [Bovine sperm chromatin is not protected from the effects ultrasmall gold nanoparticles]. Izv Akad Nauk Ser Biol: 645-652. [Crossref]
Table 1. Structural characteristics of the DNA cholesteric phase
Sample |
smax, nm-1
(± 0.1 nm-1) |
đ, nm
(± 0.1 nm) |
L, nm
(± 3.0 nm) |
∆ / đ
(± 0.01) |
DNA
liquid-crystalline phase |
1.9 |
3.4 |
16.0 |
0.15 |
Note: smax – the wave vector (s = 4πSinθ/λ; 2θ - the scattering angle; λ - the X-ray
wavelength equal 0.1542 nm);
đ - the periodicity of the structure (the interhelical distance);
L - the crystallite size;
∆/đ - the degree of disorder (∆ - the mean square deviation of distances between
neighboring regularly packed structural elements; đ - the periodicity
of the structure (the interhelical distance)).
Figure 1. (a) The CD spectra of ds DNA in absence (curve 1) and presence (curves 2-3) of different concentrations of nano-Au.
1 – Cnano-Au = 0 (R = 0);
2 – Cnano-Au = 0.854×10¹⁴ particle ml-1 (R = 3.91);
3 – Cnano-Au = 1.667×10¹² particle ml-1 (R = 7.64).
СDNA = 29 μg ml-1; 0.3 NaCl M + 0.002 M sodium phosphate buffer.
(b) The CD spectra of synthetic ds poly(ribonucleotide) poly(I)×poly(C) in absence (curve 1) and presence (curves 2-5) of different concentrations of nano-Au.
1 – Cnano-Au = 0 (R = 0);
2 – Cnano-Au = 0.174×10¹⁴ particle ml-1 (R = 0.285);
3 – Cnano-Au = 0.517×10¹⁴ particle ml-1 (R = 0.848);
4 – Cnano-Au = 0.854×10¹⁴ particle ml-1 (R = 1.40);
5 – Cnano-Au = 1.667×10¹⁴ particle ml-1 (R = 2.732).
Сpoly(I)×poly(C) = 30.4 μg ml-1; 0.3 M NaCl + 0.002 M sodium phosphate buffer.
The average size of nano-Au is ~ 2 nm.
R is the ratio of the number of nano-Au to the number of DNA (or poly(I)×poly(C)) molecules in solution.
ΔА×10-6 optical units; l = 1 cm.
Figure 2. (a-I) The CD spectra of LCDs formed by ds DNA molecules pretreated in solution of moderate (∼0.3) ionic strength with different concentrations of nano-Au.
I-1 - R = 0; I-2 – R = 0.083; I-3 – R = 0.165; I-4 – R = 0.333; I-5 – R = 0.660.
СDNA = 10 μg ml-1; СPEG = 170 mg ml-1.
0.3 M NaCl + 0.002 M sodium phosphate buffer.
(a-II) The CD spectra of LCDs formed by ds molecules of synthetic poly(ribonucleotide) poly(I)×poly(C) pretreated in solution of moderate (∼0.3) ionic strength with different concentrations of nano-Au.
II-1 - R = 0; II-2 - R = 0.165; II-3 - R = 0.331;
II-4 - R = 0.826; II-5 - R = 1.645.
Сpoly(I)×poly(C) = 10.5 μg ml-1; СPEG = 190 mg ml-1.
0.3 M NaCl + 0.002 M sodium phosphate buffer.
The average size of nano-Au is ∼ 2 nm.
R – see Figure 1.
ΔА×10-6 optical units; l = 1 cm.
(b) The dependence of the relative amplitude band (λ = 270 nm) in the CD spectra of the LCDs formed by linear ds DNA molecules and synthetic polynucleotides pretreated in solutions of moderate (~0.3) ionic strength with nano-Au of different sizes versus R value.
1 – DNA + 2 nm nano-Au;
2 – poly(I)×poly(C) + 2 nm nano-Au;
3 - poly(A)×poly(U) + 2 nm nano-Au;
4 – DNA + 5 nm nano-Au;
5 – DNA + 15 nm nano-Au;
6 – DNA + 10 nm nano-Pd (produced by pulsed laser ablation in water).
СDNA = 10 µg ml-1; СPEG = 170 mg ml-1.
0.3 M NaCl + 0.002 M sodium phosphate buffer.
Сpoly(I)×poly(C) = 10.5 µg ml-1; СPEG = 190 mg ml-1;
0.3 M NaCl + 0.002 M sodium phosphate buffer.
Сpoly(A)×poly(U) = 10 µg ml-1; СPEG = 190 mg ml-1;
0.3 N NaCl + 0.002 M sodium phosphate buffer.
ΔАотн. = ΔА/ΔАmax.
Figure 3. Fluorescent ‘images’ of the free ds DNA CLCD particles (a) and the dispersion particles formed in the PEG-containing water-salt solution by the ds DNA molecules pretreated with nano-Au (c). Both types of the DNA particles were doped with intercalating compound – cyanine dye SG.
(b) and (d) – ‘images’ obtained after dilution with water of initial PEG solutions containing particles shown in Figs. (a) and (c).
The scale bar corresponds to 2 µm.
(a) СDNA = 15 µg ml-1; СPEG = 170 mg ml-1; 0.3 M NaCl + 0.002 M sodium phosphate buffer; Сt SG = 4.9×10⁻⁶ M.
(c) СДНК = 15 µg ml-1; СPEG = 170 mg ml-1; 0.3 M NaCl + 0.002 M sodium phosphate buffer; Сnano-Au = 2.5×10¹² particle ml-1; Сt SG = 4.9×10⁻⁶ M.
The average size of nano-Au is ∼ 15 nm.
Figure 4. Experimental SAXS curves of phase obtained from the CLCD formed by free, linear, ds DNA molecules in PEG-containing water-salt solution (curve 1, control) and of phase formed in the PEG-containing water-salt solution by ds DNA molecules pretreated with nano-Au (curve 2).
Arrow marks the first minimum on the scattering curve 2.
1 - СDNA = 15 µg ml-1; СPEG = 170 mg ml-1; 0.3 M NaCl + 0.002 M sodium phosphate buffer;
2- СДНК = 15 µg ml-1; СPEG = 170 mg ml-1; 0.3 M NaCl + 0.002 M sodium phosphate buffer; Сnano-Au = 2.5×10¹² particle ml-1 (the average size of nano-Au is ∼ 15 nm).
Figure 5. (a) The CD spectra of DNA (a-I) and poly(I)×poly(С) CLCDs (a-II), doped with different concentrations of nano-Au.
(a-I): 1 - R = 0; 2 –R = 2.39; 3 –R = 4.77; 4 – R = 9.42; 5 –R = 22.9.
СDNA = 10 µg ml-1; СPEG = 190 mg ml-1;
0.3 M NaCl + 0.002 M sodium phosphate buffer.
(a-II): 1 - R = 0; 2 –R = 0.72; 3 –R = 1.44; 4 – R = 2.85; 5 –R = 4.23; 6 –R = 6.93.
Сpoly(I)×poly(C) = 12 µg ml-1; СPEG = 190 mg ml-1;
0.3 M NaCl + 0.002 M sodium phosphate buffer.
The average size of nano-Au is ∼ 2 nm.
R – see Figure 1.
ΔА ×10-6 optical units; l = 1 cm.
The CD spectra of NA CLCDs were measured 2 hrs after of their doping with nano-Au.
(b) Dependences of the amplitude of band (λ = 270 nm) in the CD spectra of DNA CLCD (curve 1) and poly (I)×poly(C) CLCD (curve 2) doped with different concentrations of nano-Au on the R value.
СDNA = 10 µg ml-1; Сpoly(I)×poly(C) = 12 µg ml-1;
СPEG = 190 mg ml-1; 0.3 M NaCl + 0.002 M sodium phosphate buffer.
The average size of nano-Au is ∼ 2 nm.
R – see Figure 1.
ΔА270×10-6 optical units; l = 1 cm.
The CD spectra of NA CLCDs were measured 2 hrs after of their doping with nano-Au .
Figure 6. (a) The CD spectra of DNA (a-I) and poly(I)×poly(C) CLCDs (a-II) measured after different time of their doping with nano-Au.
(a-I): I-1 – 0 min; I-2 – 0.6 min; I-3 –3.5 min; I-4 – 17 min; I-5 – 120 min.
(a-II): II-1 – 0 min; II-2 –5 min; II-3 – 21 min; II-4 – 120 min.
(b) Time dependences of the amplitude of the abnormal bands (∆A270) in the CD spectra of DNA (curve 1) and poly(I)×poly(C) CLCDs (curve 2) doped with nano-Au.
СDNA = 10 µg ml-1; Сpoly(I)×poly(C) = 12 µg ml-1;
СPEG = 190 mg ml-1; 0.3 M NaCl + 0.002 M sodium phosphate buffer.
Сnano-Au = 1.67×10¹⁴ particle ml-1 (the average size of nano-Au is ∼ 2 nm).
ΔА×10-6 optical units; DА270×10-6 optical units; l = 1 cm.
Figure 7. Proposed structure of aggregate formed by a few ds DNA molecules fixed on crystal facets of one gold nanoparticle (15 nm).