Abstract
Infrared spectroscopy was applied in examination and comparative analysis of adhesive tapes. By providing information about the polymer composition, it enables classification of both backings and adhesives into defined chemical classes. It was found that samples of the same type and similar infrared spectra can be differentiated sometimes based only on the presence of peaks of very low intensity originating from minor components. The results demonstrated that infrared spectroscopy appears to be a valuable analytical technique for discriminating between samples of adhesive tapes for forensic purposes.
Key words
forensic identification, adhesive tapes, FTIR, discrimination
Introduction
Tape fragments are found at various crime scenes. Electrical tapes can be used in the process of wiring electronic devices to bombs, duct tapes to bind victims of violent crimes, and other tapes to wrap packages containing drugs, explosives or other threatening materials. Frequently, forensic scientists are requested to compare fragments of a tape encountered at a crime scene with fragments originated from a suspect in order to establish whether they could come from the same roll (have a common origin). Visual investigations performed currently provide information about physical fit, tape width, colour and morphology [1]. Infrared spectroscopy (FT-IR) and pyrolysis gas chromatography (Py-GC-MS) enable characterisation of organic compounds in the backing layer and adhesive layer of the tape [2-4] and Inductively Coupled Plasma Mass Spectrometry (ICP/MS) points to their elemental composition [5,6] as well as X-ray fluorescence spectroscopy (XRF) [7].
The discriminating power of these methods is limited, however. FT-IR is used mainly to determine the class of adhesive and backing material used [8-10]. More information about organic compounds like polymers and additives can be obtained using Py-GC/MS [11,12].
A combination of FT-IR with visual comparison and elemental analysis enables discrimination between different brands of tapes but generally cannot be used for further discrimination between different batches of one brand of tape [10].
Some authors have found that application of High Resolution Inductively Coupled Plasma Mass Spectrometry (HR ICP-MS) enables determination of profiles of trace elements present in the tapes and could help in differentiation between different batches of the same type of tape [5,6].
As a non-destructive method, infrared spectroscopy is routinely applied in forensic examination of different polymer samples. Being sensitive to molecular structure, it provides valuable information about the chemical composition of such materials as paints, plastics and glues [13-16]. The information obtained is in many cases sufficient for classification of these materials. Some authors recommend application of attenuated total reflection technique (ATR) in examination and comparison of polymer samples [8,9].
In this article, the focus will be on the potential of FT-IR in discrimination of adhesive types. Chemical functional group analysis of backing and adhesive, i.e. polymer components of tapes, carried out by infrared spectroscopy may help in distinguishing between different tapes. It will be demonstrated that this method offers a major step forward in forensic tape investigations by determining polymers and additives in both backings and adhesives of tapes.
Generally, tapes consist of a backing film and an adhesive layer. The backing film is primed with a primer layer for improved adherence of the adhesive layer to the backing film. A release coating is applied on the back side of the backing film. During unwinding of the tape roll, this coating assists in reducing unwind tension and preventing adhesives from the tape from sticking to the back side of the tape beneath it. So, the tape is usually structured as follows (starting at the back of the tape): release coating/backing film/primer layer/adhesive layer. In principle, all these separate layers can be investigated. In practice, however, it is difficult to isolate very thin primer layer as well as release coating. In this study, the tape was divided into two layers only, i.e. backing and adhesive (glue) and both layers were investigated separately.
Materials and methods
Both the glue and the backing of 50 adhesive tapes of various kinds (packaging tape, duct tape, insulation tape) (Table 1) were examined by the use of infrared spectrometry. All tapes were purchased from supermarkets and stores at different times.
No. |
Tape |
Colour |
|
No. |
Tape |
Colour |
1 |
Prefecta |
colourless |
26 |
Tesaflex 53947 |
black |
2 |
Painto |
grey |
27 |
Tesa perfect |
green |
3 |
Advance AT169 |
red |
28 |
Grand |
colourless |
4 |
Advance AT175 |
green |
29 |
Grand |
white |
5 |
Advance AT4 |
brown |
30 |
Scotch 508 |
colourless |
6 |
Advance AT6152 |
white |
31 |
Scotch magic 810 |
white |
7 |
Advance AT30 |
colourless |
32 |
Scotch 550 |
colourless |
8 |
Advance AT6102 |
black |
33 |
Scotch Crystal 600 |
colourless |
9 |
Advance AT272 |
silver |
34 |
Scotch Removable 811 |
white |
10 |
Advance AT202 |
yellow |
35 |
Stick’n |
white |
11 |
Bizon |
green |
36 |
Scotch |
colourless |
12 |
Global System |
colourless |
37 |
Scley 914 |
black-yellow |
13 |
Global System |
grey |
38 |
Goldtape |
grey |
14 |
Lobos |
colourless |
39 |
Goldtape |
brown |
15 |
Herlitz |
colourless |
40 |
Goldtape |
yellow |
16 |
Tesco |
brown |
41 |
Tape International |
yellow |
17 |
Tesco |
colourless |
42 |
Global point |
yellow |
18 |
Tesa- Fixing |
white |
43 |
Dalpo |
grey |
19 |
- |
red-white |
44 |
K2 |
grey |
20 |
Blue delphin tapes |
yellow |
45 |
Diall |
colourless |
21 |
Blue delphin tapes |
yellow |
46 |
Tape International |
yellow |
22 |
Blue delphin tapes |
grey |
47 |
Purs |
black |
23 |
Tesa signal |
red-white |
48 |
Euro-tape silent |
colourless |
24 |
Tesaflex 53947 |
blue |
49 |
Euro-tape silent |
brown |
25 |
Tesco |
colourless |
50 |
Euro-tape |
yellow |
Table 1. Examined tapes
Infrared measurements were performed using an FTS 40Pro Fourier-transform infrared spectrometer (BioRad/Digilab), which was equipped with a water-cooled high temperature ceramic source (MIR) and coupled with a UMA 500 microscope equipped with an MCT detector. IR spectra in the mid-infrared range were recorded at a resolution of 4 cm–1. Each spectrum represented a collection of 512 scans. The samples were placed on the microscope stage of the spectrometer and measured by the transmission technique in the infrared beam. Glues were scraped from the backing and put directly on the KBr plate. Backings, after removing the glue and cleaning with appropriate solvent, were cut into thin slices using a scalpel. There were collected from each tape 3 samples of both backing and glue and then examined three times in the same conditions.
Results and discussion
On the basis of obtained IR spectra, tapes were divided into several groups that differed in terms of backing and adhesive content (Table 2). Each group was named on the basis of the main polymer present in the sample. Spectra were compared visually, taking into account the number, location and intensity of particular absorption bands.
Backing |
Type |
Group |
Number of samples |
Differentiated samples |
A |
Polypropylene |
20 |
0 |
B |
Polyethylene |
17 |
6 |
C |
Polyester |
6 |
4 |
D |
Acetylated cellulose |
3 |
0 |
|
Single spectra |
3 |
3 |
Aluminum |
1 |
1 |
Glue |
K |
Rubber with styrene |
15 |
6 |
L |
Polyester |
4 |
2 |
M |
Butadiene-styrene |
4 |
2 |
N |
Acryl |
25 |
9 |
|
Non identified |
2 |
2 |
Table 2. Grouping of examined samples on the basis of their infrared spectra.
Backing
Backing materials were divided into 4 groups – namely, polypropylene, polyethylene, cellulose and polyester backings. The backings of 3 of the studied tapes could not be classified into any of the above groups on the basis of the obtained IR spectra. However, these spectra differed significantly from each other and from the remaining spectra. Furthermore, in one of the tapes the backing was aluminium foil.
The largest number of samples were classified into the group of polypropylene backings. In the IR spectra of polypropylene backings, only absorption bands originating from vibrations of C-H, CH2 and CH3 groups in the polymer chain were visible (Figure 1a). That is why backings from tapes belonging to this group could not be differentiated from each other on the basis of their IR spectra (Table 3).
Chemical compound |
Absorption band |
Assignment |
Numer of samples |
polypropylene |
 842 cm-1 842 cm-1
998 cm-1
1167 cm-1 |
vibrations characteristic for isotactic polypropylene |
20 |
1377 cm-1 |
C-H symmetric deformation vibrations |
1460 cm-1 |
C-H asymmetric deformation vibrations |
|
polyethylene |
720 cm-1 |
CH2 rocking vibration |
17 |
1460 cm-1 |
CH2 scissoring vibration |
2850 cm-1 |
C-H symmetrical stretching vibration |
2920 cm-1 |
C-H asymmetrical stretching vibration |
polyester
type C1 |
845 cm-1 |
CH2 wagging vibrations |
2 |
970 cm-1 |
C-O stretching vibrations |
1126 cm-1 |
C-O-C asymmetric stretching vibration |
1252 cm-1 |
=C-O-C, Ar-O-C asymmetric stretching vibration |
1340 cm-1 |
CH2 wagging vibrations |
1718 cm-1 |
C=O stretching vibrations |
polyester
type C2 |
745 cm-1 |
stretching vibrations from the aromatic ring |
4 |
1077 cm-1
|
stretching vibrations C-O in O-CH2 |
1125 cm-1
1285 cm-1 |
stretching vibrations C-O-C |
|
stretching vibrations C-O in –O-C=O |
1726 cm-1 |
stretching vibrations C=O |
acetylcellulose |
1050 cm-1 |
stretching vibrations C-O |
3 |
1237 cm-1 |
stretching vibrations C-O-C |
1370 cm-1- |
deformation vibrations CH2 |
1744 cm-1 |
stretching vibrations C=O |
~3400 cm-1 |
stretching vibrations O-H |
Table 3. Characteristic absorption bands of polymers visible in IR spectra of backings.
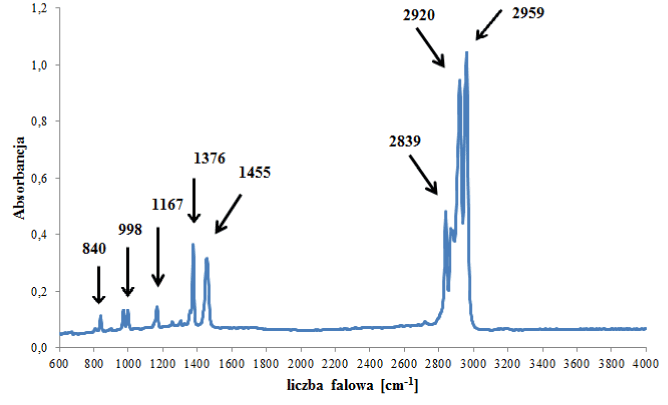
Figure 1a. Infrared spectrum of polypropylene backing.
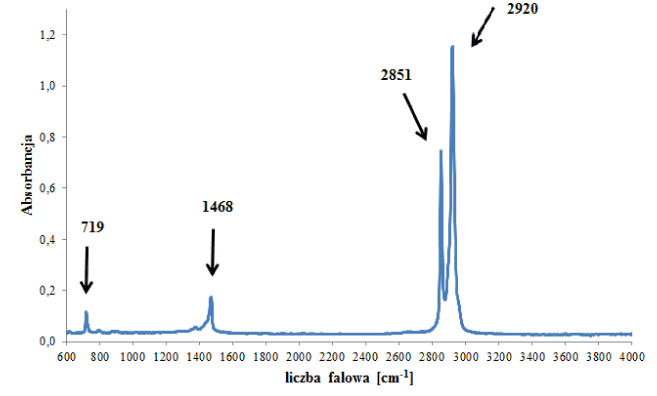
Figure 1b. Infrared spectrum of polyethylene backing.
However, spectra of polyethylene backings differed from each other significantly. Some of the obtained spectra contained – apart from bands originating from vibrations of C-H and CH2 functional groups in the polymer (Figure 1b) – bands originating from additives for improving the quality of the tape, such as carbonates, ionomers or vinyl acetate (Figure 2- labelled with arrows). On the basis of IR spectra, it was possible to distinguish 6 tapes with different spectra and thus (different) chemical composition from the remainder belonging to this group.
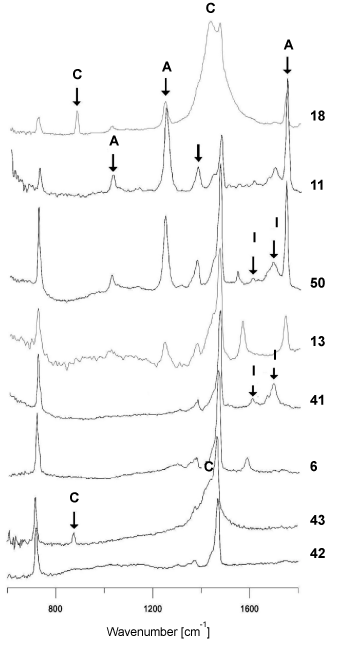
Figure 2. Comparison of infrared spectra of different polyethylene backings
C-carbonates, I-ionomers, A- polyvinyl acetate.
In the group of polyester backings, two subgroups were distinguished that differed in terms of the type of polyester forming the polymer network, i.e., a (sub)group of backings (C1) containing polyethylene terephthalate (Figure 3a), and a (sub)group of backings (C2) containing other esters (Figure 3b). In the spectra of backings in group C1 – apart from absorption bands originating from vibrations of C-O-C, C-O, C=O and C-H groups in esters – bands originating from vibrations of C-H groups in substituted aromatic rings were visible (Figure 3a), which were constituents of additives. Two tapes were classified into this group. Bands of the main polymer were visible in the spectra of the backings in group C2 (Figure 3b – indicated by arrows) as well as bands originating from carbonate type fillers: 875 and 1420 cm‑1. Small differences in obtained spectra were also observed, concerning the ratio of the intensity of band 875 (carbonates band) to band 1070 cm-1 (ester groups band). The observed differences in spectra allowed us to differentiate 4 out of the 6 samples belonging to this group.
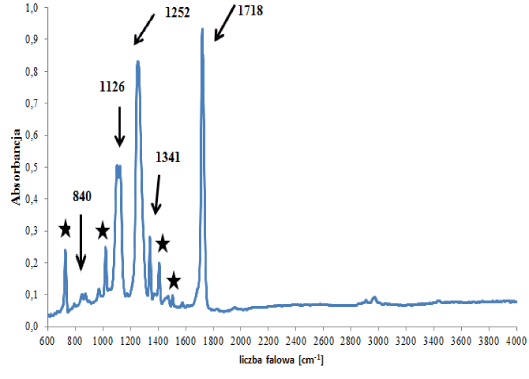
Figure 3a. Infrared spectrum of polyester backing type C1
★- ring compounds.
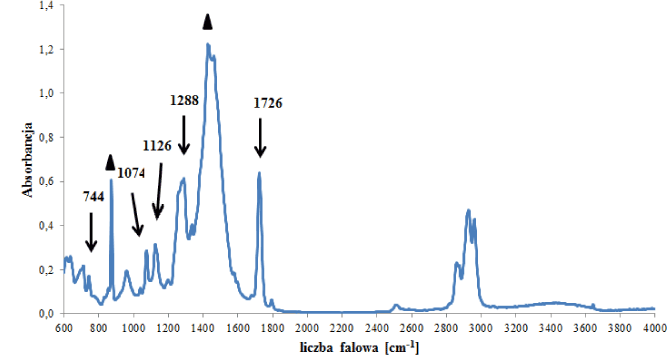
Figure 3b. Infrared spectrum of polyester backing type C2
- carbonates.
Cellulose backings were characterised by very similar infrared spectra dominated by bands originating from vibrations of groups C-O, C-O-C, C=O and O-H of cellulose (Figure 4).
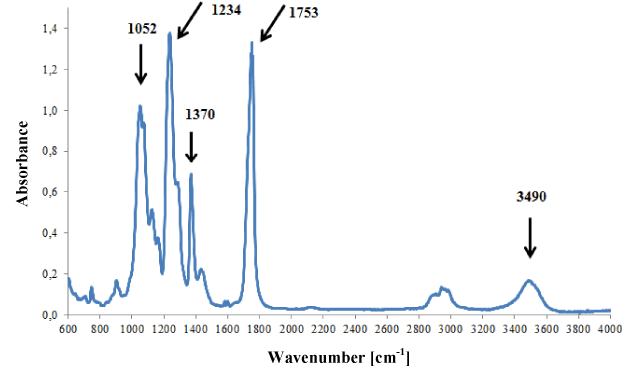
Figure 4. Infrared spectrum of acetocellulose backing.
Additionally, weak bands originating from plasticizers (o-phthalates) were present on spectra, i.e., bands at 748, 1580 and 1601 cm-1. Three tapes with infrared spectra that did not differ from each other were classified into this group.
Adhesives
Four main groups of adhesives were differentiated on the basis of the main polymer component – namely adhesives produced on the basis of natural isoprene rubber, styrene-butadiene rubber, esters and acrylates. Only IR spectra of two adhesives did not allow classification into the mentioned groups.
Most frequently, layers of adhesive present in studied tapes were produced on a base of isoprene rubber and acrylates (Table 4).
polyacrylate |
1165 cm-1 |
–C-O-C stretching symmetrical vibrations |
25 |
1240-1265 cm-1 |
–C-O-C stretching asymmetrical vibrations |
1380 cm-1 |
CH2 vibration |
1450 cm-1 |
CH3 vibration |
1730 cm-1 |
– C=O stretching vibration |
2240 cm-1 very weak |
– C N stretching vibration N stretching vibration |
natural rubber |
833 cm-1 |
=C-H deformation vibrations |
15 |
1379 cm-1 |
CH3 deformation vibrations |
-
|
CH2 deformation vibrations |
1667 cm-1 weak |
C=C stretching vibrations |
 2855 cm-1 2855 cm-1
2926 cm-1
2964 cm-1 |
C-H stretching vibrations |
butadiene styrene rubber |
 700 cm-1 700 cm-1
760 cm-1 |
C H deformation vibrations in ring |
4 |

912 cm-1 weak
968 cm-1
995 cm-1 weak |
=C-H deformation vibrations in butadiene |
 1380 cm-1 1380 cm-1
1450 cm-1 |
CH3 deformation vibrations |

-
|
ring vibrations |

2854 cm-1
2925 cm-1 |
drgania rozciągające C-H |
polyester |
745 cm-1 |
stretching vibrations from the aromatic ring |
4 |
1077 cm-1
|
stretching vibrations C-O in O-CH2 |
1125 cm-1 |
stretching vibrations C-O-C |
1285 cm-1 |
stretching vibrations C-O in –O-C=O |
1726 cm-1 |
stretching vibrations C=O |
Table 4. Characteristic absorption bands of polymers visible in IR spectra of glues.
In the group of adhesives containing rubber on the basis of isoprene (Figure 5a), strong absorption bands originating from cis-1,4-isoprene were visible, as well as weak additional bands, i.e. indicating styrene, carbonates, titanium dioxide, kaolin and compounds containing a carbonyl group (Figure 5b). These differences in chemical composition allowed four subgroups to be distinguished within this group of adhesives.
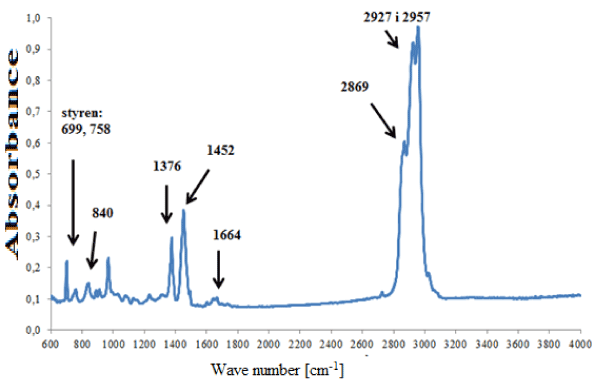
Figure 5a. Infrared spectrum of natural rubber glue modified with styrene.
Acrylic adhesives (Figure 6a) most frequently contained methyl, ethyl, butyl or 2-ethylhexyl polyacrylates. The adhesives of 25 tapes that were classified into the group of acrylic adhesives were characterised by spectra that differed insignificantly in terms of location and intensity of bands, which may indicate their different chemical composition (Figure 6b).
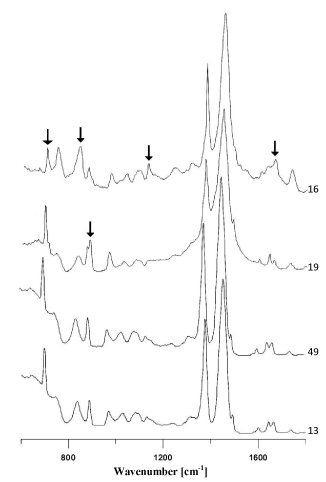
Figure 5b. Comparison of infrared spectra of different natural rubber glues (the main differences marked with arrows).
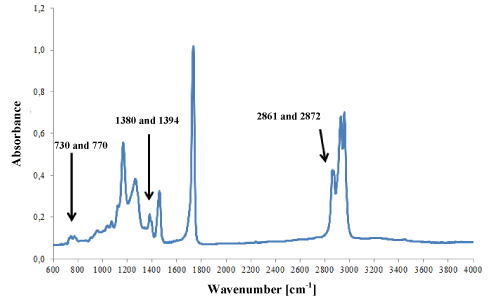
Figure 6a. Infrared spectrum of acrylic glue.
However, in ester (Figure 7) and styrene-butadiene adhesives (Figure 8), only small differences were observed in the intensity of absorption bands, which was probably the result of slight differences in their chemical composition. But it was not possible to identify such components of the adhesives that influenced the shape of the IR spectra.
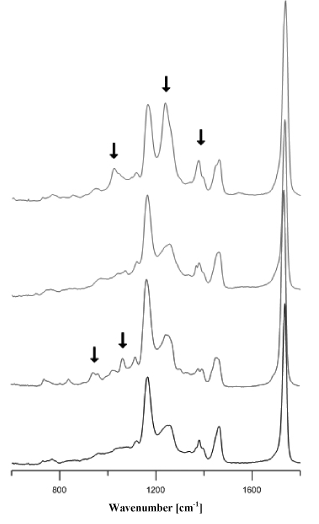
Figure 6b. Comparison of infrared spectra of different acrylic glues.
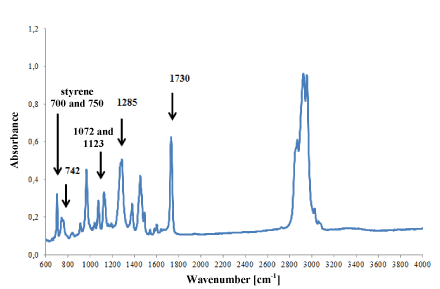
Figure 7. Infrared spectrum of polyester glue modified with styrene.
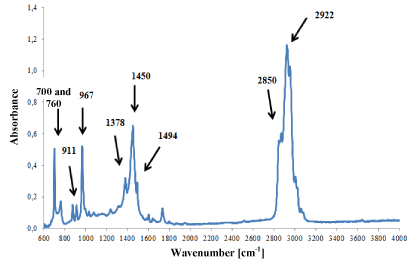
Figure 8. Infrared spectrum of synthetic rubber glue modified with styrene.
Comparing spectra of tape samples visually within the distinguished chemical classes separately for adhesives and for backings, it was ascertained that in most cases, the observed difference between spectra was sufficient to distinguish them. Furthermore, it is probable that differentiation of samples of very similar spectra would be possible with the application of a more sensitive analytical technique, i.e., gas chromatography of pyrolysis products of samples. For this method allows identification of components of low content in a studied sample.
Conclusions
The results of the research show that infrared spectrometry is a valuable analytical technique in differentiating samples of adhesive tapes for forensic purposes. By providing information on polymer composition, IR spectrometry enables classification both of backings and adhesives into defined chemical classes. In the group of studied tapes, polyethylene and polypropylene backings and adhesives produced on the basis of synthetic isoprene rubber and acrylates predominate. Small differences in the chemical composition observed within a given class are the result of the presence of additives, e.g., fillers (carbonates and silicates) or plasticizers (phthalates), and also the technological process. The influence of the thin separating layer and the primer present in the tape is negligible. As these layers were not visible under the microscope at a magnification of 150x, they were not initially separated from the backing and the adhesive but studied together with them. Due to their low content in the tape, the influence of these components is small. Taking into account the fact that a tape is composed both of a backing and an adhesive, it sometimes happens that compared tapes contain the same backing but different adhesives or the same adhesive, on different backings. Thus, there is greater possibility of differentiating tapes for forensic purposes. Additionally, application of another more sensitive analytical method, e.g., pyrolysis gas chromatography, enabling detections of subtle differences in chemical composition could help in further differentiation of adhesive tape samples belonging to the same chemical class of backings or glues.
The author declares that there is no conflict of interest regarding the publication of this paper.
Acknowledgement
The author would like to express her gratefulness to Mrs Sabina Nowińska for help with gathering a part of IR spectra of the studied material.
The research was financially supported by the Institute of Forensic Research, Poland, within the project no. II/K, 2009-2012.
2021 Copyright OAT. All rights reserv
References
- Goodpaster JV, Sturdevant AB, Andrews KL, Briley EM, Brun-Conti L (2007) Identification and comparison of electrical tapes using instrumental and statistical techniques: I Microscopic surface texture and elemental composition. J Forensic Sci 52: 610-629.
- Blackledge RD (1992) Application of Pyrolysis Gas Chromatography in Forensic Science. Forensic Sci Rev 4: 1-16. [Crossref]
- Kumooka Y (2006) Analysis of deteriorated rubber-based pressure sensitive adhesive by pyrolysis-gas chromatography/mass spectrometry and attenuated total reflectance Fourier transform infrared spectrometry. Forensic Sci Int 163: 132-137.
- Williams ER, Munson TO (1988) The comparison of black polyvinylchloride (PCV) tapes by pyrolysis gas chromatography. Journal of Forensic Sciences 33: 1163-1170.
- Dobney AM, Wiarda W, de Joode P, van der Peij GJ (2001) Elemental comparison of packing tapes using HR ICP/MS. Problems of Forensic Sciences XVII 275-287.
- Dobney AM, Wiarda W, de Joode P, van der Peijl GJ (2002) Sector field ICP-MS applied to the forensic analysis of commercially available adhesive packaging tapes. Journal of Analytical Atomic Spectrometry 17: 478-484.
- Ninomiya T, Nomura S, Taniguchi K, Ikeda S (1995) Applications of a glazing incidence X-ray fluorescence analysis to forensic samples. Analytical Sciences 11: 489-494.
- Kumooka Y (2009) Hierarchical cluster analysis as tool for preliminary discrimination of ATR-FT-IR spectra of OPP acrylic and rubber-based adhesives, Forensic Sci Int 189: 104-110.
- Merrill RA, Bartick EG (2000) Analysis of pressure sensitive adhesive tape: I. Evaluation of infrared ATR accessory advances J Forensic Sci 45: 93-98. [Crossref]
- Zieba-Palus J, Augustynek A (2011) Effective differentiation of adhesive tapes by the use of infrared spectroscopy and pyrolytic-gas chromatography for criminalistic purposes, Problems of Forensic Sciences 86: 103-113.
- Nakamura S, Takino M, Daishima S (2000) Analysis of pressure sensitive adhesives by GC/MS and GC/AED with temperature and programmable pyrolyser, Analytical Sciences 16: 627-631.
- Kumooka Y (2010) Classification of OPP adhesive tapes according to MALDI mass spectra of adhesives. Forensic Sci Int 197: 75-79. [Crossref]
- Sakayanagi M, Konda Y, Watanabe K, Harigaya Y (2003) Identification of pressure-sensitive adhesive polypropylene tape. J Forensic Sci 48: 68-76. [Crossref]
- Zieba-Palus J, Kowalski R, Nowinska S (2016) Aplication of infrared spectroscopy and pyrolysis gas chromatography for characterisation of adhesive tapes. J Molecular Struct 1126: 232-239.
- Pahl A (1996) Identification of adhesives in adhesive tapes. Kleben Dichten 41: 28-31.
- Mehltretter AH, Bradley MJ, Wright DM (2011) Analysis and discrimination of electrical tapes: Part I. Adhesives. J Forensic Sci 56: 82-94. [Crossref]


