Abstract
Objectives: While obesity is common in the US, disparities exist. Orthodontic samples are assumed to be more affluent than the general population and not in need of assistance in developing or maintaining healthy lifestyles. This paper evaluates the need of the orthodontic population for intervention by examining diet and weight status of an orthodontic patient sample and describes a role for dental clinicians in obesity prevention efforts.
Methods: 552 patients age 8-14 years, 54% female, 51% non-Hispanic white, 26% Hispanic were recruited from orthodontic practices in Southern California to participate in a randomized controlled trial of clinician-delivered health promotion. Height, weight, demographics, and diet were recorded. Chi-Square analyses were used to test for differences at baseline by gender, age, ethnicity, and income.
Results: 13% of the sample was overweight and 9% was obese. Males had a higher rate of obesity than females. Lower income youth had a higher rate than higher income youth. Hispanic youth had a higher rate than non-Hispanic white youth. Failure to meet national dietary guidelines was common, differing significantly by demographic group.
Conclusions: Within a sample not typically thought of as needing assistance, nearly 25% were overweight or obese and the majority failed to meet dietary recommendations. While most patients could benefit from intervention, male, Hispanic, and lower income groups were in greatest need of assistance. Dental providers, who see youth frequently and already discuss nutrition in the context of oral health, have the opportunity to contribute to obesity prevention.
Key words
prevention, obesity, weight status, dietary intake, health promotion
Background
Between the 1970s and 2012, obesity rates increased from 4% to 18% among children ages 6-11 years and from 6% to 21% among adolescents ages 12-19 years [1,2]. Although some evidence suggests that obesity levels may be plateauing or improving among subsets of the US population, [2] obesity continues to be a major health concern, contributing to increased morbidity, premature mortality, and economic costs, and to decreased quality of life.[i] Obese children are at greater risk of hypertension, dyslipidemia, impaired glucose tolerance, insulin-resistance, type-2 diabetes, sleep apnea and asthma [3]. Childhood obesity increases the risk of obesity in adulthood3 and is associated with reduced life expectancy [2].
While in the US obesity is now common across race, gender, socioeconomic status (SES), and age, disparities exist. In 2011-2012, non-Hispanic white youth had a higher rate of obesity than non-Hispanic Asian youth (14% versus 9%, respectively, p=.04), and a lower rate of obesity than non-Hispanic black and Hispanic youth (14% versus 20% and 22%, respectively, p<.001) [2]. National studies have shown that male youth are more likely than female youth to be obese, particularly among Hispanic youth, with a greater increase in obesity prevalence over time [2,3]. The most recent analyses of NHANES 2011-2012 data however, showed no statistically significant difference between genders when all racial/ethnic groups are combined [2]. Youth in lower income or less educated families have higher rates of obesity, although the strength of this relationship varies by race/ethnicity and gender [2]. The strongest association between SES and obesity exists among non-Hispanic white youth [7]. One study indicates that the gap in obesity rates for low income and higher income adolescents widened between 2001 and 2007. The lowest income group had an obesity rate nearly triple the rate of adolescents with family incomes of 300% or more of the federal poverty level [3]. These patterns of obesity rates across time and groups suggest that factors responsible for weight gain are so pervasive as to characterize all groups, with a greater impact on racial/ethnic minorities and those of lower SES.
Diet is an important contributor to weight. The department of Health and Human Services’ and US Department of Agriculture’s Dietary Guidelines recommend caloric balance, consuming nutrient-dense foods and beverages such as vegetables, fruits, whole grains, and low-fat or non-fat milk, and limiting sodium, solid fats, added sugars, and refined grains that contribute too many calories of little nutrient value [2]. Few individuals meet dietary guidelines [2,9]. Excess caloric consumption, [2] sugar-sweetened beverages (SSBs), [2] and fast food intake[ii] have been linked to increased obesity. Greater consumption of high fiber foods, fruits and vegetables have been linked to reduced obesity [9]. Disparities in the consumption of foods and beverages have been found among racial/ethnic and SES groups [3]. In general, lower income individuals and non-Hispanic black individuals have poorer dietary intake [14].
Clinician promotion of health behaviors can contribute importantly to reversing obesity trends and improving patient diets. Physician-based interventions can improve physical activity (PA), sedentary activity, and nutrition behaviors, and can result in weight loss and reduced waist circumference [3-5]. A tobacco prevention study with orthodontist-delivered health messages reduced tobacco initiation for susceptible youth [3]. Orthodontic and pediatric dental providers are ideal clinicians to target health behaviors of children and adolescents due to the proportion of patients who are youth [3] and the frequency with which patients are seen [3]. While healthy children might see a physician annually, they might see a pediatric dentist two or more times a year or an orthodontist six or more times a year, offering repeated opportunities for prevention efforts. Nutrition advice in the context of oral health and care for orthodontic appliances is often already provided and aligns with nutrition advice for optimal total body health [3,4,20]. The addition of general nutrition advice is encouraged by the American Academy of Pediatric Dentistry and the American Dental Association [3,21].
As the cost of orthodontic treatment is frequently paid out-of-pocket, with little insurance coverage for the majority of patients, [19] the inability of some individuals to pay raises the concern that the orthodontic population may have higher incomes than the general population, and do not represent a group in need of assistance. This paper questions this argument by examining weight status and dietary behaviors of an orthodontic patient sample.
Methods
Healthy Smiles: An Orthodontist Program, is an NIH-funded, randomized, controlled trial for 8-16 year old orthodontic patients. Orthodontic practices in San Diego, Orange and Riverside Counties in Southern California, US or in Baja California, Mexico were recruited to deliver either a physical activity and nutrition program or a tobacco use prevention program to their patients. This report uses baseline data solely from patients in US offices, who were 8-14 years old at recruitment. All study procedures were approved by the San Diego State University Institutional Review Board.
Geographically eligible orthodontists were identified from the American Association of Orthodontist membership listing and online searches. About 7% (n=24) of identified offices participated in the study. Reasons for not participating included unsuccessful contact; ineligibility due to retirement, practicing too few days a week or belonging to a shared practice; and refusals. Participating offices notified patients of the research study by letter. Patients allowing contact by the study were screened for study inclusion, and were excluded if they were not 8-14 years old, had less than 1 year remaining in treatment, had plans to move within a year, were unable to care for themselves, had been diagnosed with an eating disorder or severe depression, had been prohibited by a physician from engaging in regular PA, or participated in organized sports or PA 3 or more times per week for 9 or more months of the past year. Of 2,761 US families contacted, 1,913 (69%) were screened, 835 (30%) qualified, and 552 (20%) completed the study consent process and enrolled between 2010 and 2013.
Upon parent and child consent, research staff measured participants’ weight and height. The child’s parent/guardian completed a self-administered questionnaire of demographics. The child completed a self-administered 7-day dietary recall. Additional prior day dietary recalls were collected via computer-assisted telephone interviews. Only the first day of recalls at baseline was included in this analysis, guided by California Health Interview Survey (CHIS) methodology [3].
Demographic group comparisons were made between: females versus males; youth ages 8-11 years (children) versus 12-14 years (adolescents); non-Hispanic white versus Hispanic youth; and youth of lower versus higher income. Ethnic comparisons were made only between non-Hispanic white and Hispanic youth, since the small sample sizes for other groups afforded insufficient statistical power. Participants of other races/ethnicities were included in all other analyses. Family income was measured as less than $20,000 a year, $20,000-$69,999, $70,000-$134,999, and over $135,000. For these analyses, families with income less than $70,000 a year are described as lower income.
Weight and height were measured using a digital scale and portable stadiometer until 2 consecutive measures were within 0.1 kilograms and 0.5 centimeters of each other to improve reliability. The 2 weight and 2 height measures were averaged for Body Mass Index (BMI) computation. BMI was calculated and age and gender-specific percentiles determined. Participants were then assigned a weight category (obese, overweight, normal weight, underweight) as defined by the Centers for Disease Control and Prevention [3].
Dietary questions for the prior day and 7-day dietary recalls were taken from the 2005 and 2007 CHIS and assessed fruit, vegetable, milk, soda or other SSBs, and sweets consumption on the prior day, and fast food consumption during the prior week [24]. Prior day questions were formatted as: “Yesterday, how many servings (glasses/cartons/cans) of _____ did you eat (drink)?” Per CHIS methodology, interviewers described a serving as “whatever it means to you.” Fast food consumption was assessed by: “Last week, how many times did you eat fast food?” Children reported their own intake with parent/guardian confirmation of servings eaten. Variables were dichotomized according to dietary guidelines and publicly available CHIS summaries and also to constrain skewness [24].
Analyses were performed using SPSS version 22 (IBM, Inc, Armonk, NY). Chi-Square tests were used to test for statistical differences in weight categorizations and diet among demographic groups. Logistic regression was used to test independent effect of predictors of weight status.
Results
Mean age was 12.0 years (SD 1.7) and 44% of participants were classified as ‘children’. Fifty-four percent were female. Fifty-one percent were non-Hispanic white, 26% Hispanic, 7% Asian/Pacific Islander, 2% Black or African American, 7% multi-racial, 3% reported being non-Hispanic white without reporting ethnicity, and 4% were of unknown race or ethnicity. The family income distribution was 5% earning less than $20,000 a year, 25% between $20,000 and $69,999, 47% between $70,000 and $134,999, and 24% over $135,000.
About 13% of the sample was overweight and 9% was obese, for a total of 22% who were either overweight or obese. Table 1 shows that in the full, lower income, and child samples males had significantly higher rates of obesity than females (p<.05). Hispanic males were more overweight/obese compared with Hispanic females (p<.05). Lower income youth (both genders combined and males alone) had a higher rate of obesity and overweight/obesity than higher income youth (p<.05). Hispanic youth (both genders combined and males alone) had a higher rate of obesity and overweight/obesity than non-Hispanic white youth (p<.05).
Table 1. Weight status by income, age and ethnicity; and by gender within those categories.
|
Sample Size |
Obese |
Obese, 95% Confidence Intervals |
Overweight or Obese |
Overweight or obese, 95% Confidence Intervals |
|
|
% |
|
% |
|
Full Sample |
n=551 |
9.1 |
7.0-11.8 |
21.6 |
18.4-25.2 |
Male |
n=252 |
12.3* |
8.8-16.9 |
25.0 |
20.1-30.7 |
Female |
n=299 |
6.4 |
4.1-9.7 |
18.7 |
14.7-23.5 |
|
|
|
|
|
|
Higher Income |
n=326 |
6.7 |
4.5-10.0 |
18.7 |
14.9-23.3 |
Male |
n=145 |
9.0 |
5.3-14.7 |
21.4 |
15.5-28.8 |
Female |
n=181 |
5.0 |
2.6-9.2 |
16.6 |
11.9-22.7 |
|
|
|
|
|
|
Lower Income |
n=137 |
14.6** |
9.7-21.5 |
28.5** |
21.6-36.5 |
Male |
n=64 |
21.9 *,† |
13.5-33.4 |
35.9 † |
25.3-48.2 |
Female |
n=73 |
8.2 |
3.8-16.8 |
21.9 |
14.0-32.7 |
Child 8-11 |
n=240 |
10.8 |
7.5-15.4 |
20.8 |
16.2-26.4 |
Male |
n=117 |
14.5* |
9.3-22.0 |
23.1 |
16.4-31.5 |
Female |
n=123 |
7.3 |
3.9-13.3 |
18.7 |
12.8-26.5 |
|
|
|
|
|
|
Adolescent 12-14 |
n=311 |
7.7 |
5.2-11.2 |
22.2 |
17.9-27.1 |
Male |
n=135 |
10.4 |
6.3-16.7 |
26.7 |
19.9-34.7 |
Female |
n=176 |
5.7 |
3.1-10.1 |
18.8 |
13.7-25.2 |
Non-Hispanic white |
n=282 |
7.8 |
5.2-11.5 |
19.1 |
15.0-24.1 |
Male |
n=140 |
10.0 |
6.1-16.1 |
20.0 |
14.2-27.4 |
Female |
n=142 |
5.6 |
2.9-10.7 |
18.3 |
12.8-25.5 |
|
|
|
|
|
|
Hispanic |
n=142 |
16.2** |
11.0-23.1 |
31.0** |
24.0-39.0 |
Male |
n=67 |
22.4 † |
14.1-33.7 |
41.8*, † |
30.7-53.7 |
Female |
n=75 |
10.7 |
5.5-19.7 |
21.3 |
13.6-31.9 |
*Indicates significant difference between genders, p<.05
**Indicates significant difference between demographic groups, p<.05
† Indicates significant difference between demographic groups, separately by gender, p<.05
Figure 1 illustrates weight status by four race/ethnicity-income combinations. Figure 1 shows that obesity rates for the lower income group were nearly double the higher income group rates, for both non-Hispanic white (12% vs. 7%, respectively), and Hispanic participants (22% vs. 12%). Obesity rates for Hispanic participants were nearly double the non-Hispanic white participant rate, for both low-income (22% vs. 12%, respectively) and high-income participants (12% vs. 7%). The graph in Figure 1 shows similar relationships, though a bit less pronounced, for overweight/obese status.
Figure 1: Weight Status by Income and Ethnicity.
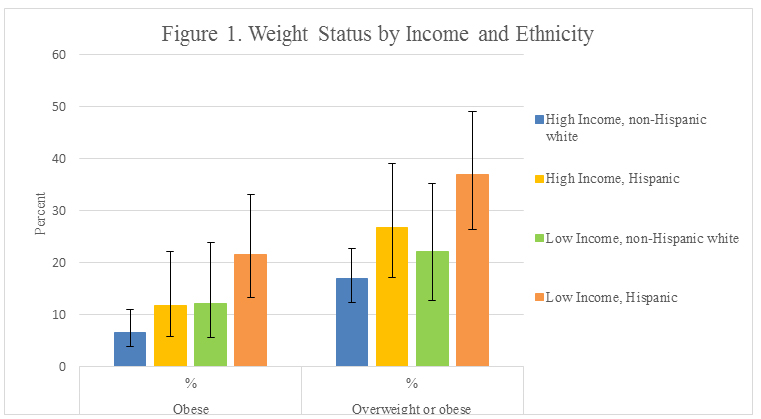
Error bars are 95% Confidence Intervals. High income, non-Hispanic white n=196. High income, Hispanic n=60. Low income, non-Hispanic white n=50. Low income, Hispanic n=65.
Given that lower income was moderately correlated with Hispanic race/ethnicity (r=.324, p<.001), we used logistic regression to investigate whether the effects of race/ethnicity and income on weight were independent. A model was run with weight status as the dependent variable and with race/ethnicity and income as predictors, and then run again adding their interaction term. Race/ethnicity and income demonstrated near-significant (p=.067 and .054, respectively) independent contributions to obesity, while for overweight/obese, race/ethnicity (p=.016) emerged as a significant predictor, controlling for income (p=.125). Being Hispanic increased the odds of overweight/obesity nearly twofold (odds ratio=1.92; 95% CI=1.13, 3.25). There was no significant race/ethnicity-income interaction for either measure of weight status.
Dietary intake at baseline is presented in (Table 2 and 3). There were significant gender differences for consumption of sweets, SSBs and milk. A larger proportion of females consumed more than 1 serving of sweets per day compared to males among the non-Hispanic white sample (p<.05). A larger proportion of males drank more than 1 SSB per day than females among the full and higher income samples (p<.05), a trend that repeated across all demographic groups except the lower income sample. A larger proportion of males drank 2 or more glasses of milk per day than females among the full, higher income and non-Hispanic white samples (p<.05). There were no significant differences between genders in consumption of fruits and vegetables, fruits only, or fast food.
Table 2. Dietary intake and behavior by income, age and ethnicity; and by gender within those categories.
|
Sample Size Range |
≥5 servings of F/V |
F/V, 95% Confidence Intervals |
≥2 servings of fruit |
Fruit, 95% Confidence Intervals |
≥2 glasses of milk |
Milk, 95% Confidence Intervals |
|
|
% |
|
% |
|
% |
|
Full Sample |
n=490-541 |
26.6 |
22.8-30.6 |
39.7 |
35.5-44.1 |
37.6 |
33.5-42.0 |
Male |
n=228-248 |
28.7 |
23.2-34.9 |
40.7 |
34.5-47.2 |
42.8 |
36.6-49.3 |
Female |
n=262-293 |
24.7 |
19.9-30.1 |
38.8 |
33.1-44.9 |
33.2* |
27.8-39.1 |
|
|
|
|
|
|
|
|
Higher Income |
n=299-320 |
27.9 |
23.1-33.1 |
44.9 |
39.4-50.6 |
38.9 |
33.6-44.5 |
Male |
n=135-143 |
32.1 |
24.9-40.3 |
46.6 |
38.4-55.1 |
46.7 |
38.6-55.0 |
Female |
n=164-177 |
24.4 |
18.4-31.3 |
43.6 |
36.2-51.2 |
32.5* |
25.9-39.9 |
|
|
|
|
|
|
|
|
Lower Income |
n=115-136 |
25.0 |
18.0-33.6 |
28.7** |
21.2-37.6 |
36.5 |
28.3-45.6 |
Male |
n=54-63 |
25.5 |
15.8-38.3 |
25.5 † |
15.8-38.3 |
35.2 |
23.8-48.5 |
Female |
n=60-73 |
24.6 |
15.5-36.7 |
31.7 |
21.3-44.2 |
37.7 |
26.6-50.3 |
|
|
|
|
|
|
|
|
Child |
n=224-236 |
28.4 |
22.9-34.5 |
38.5 |
32.3-45.0 |
43.9 |
37.6-50.4 |
Male |
n=109-114 |
28.2 |
20.6-37.2 |
38.3 |
29.7-47.8 |
50.5 |
41.2-59.7 |
Female |
n=115-122 |
28.6 |
21.2-37.3 |
38.6 |
30.2-47.8 |
37.8 |
29.6-46.8 |
|
|
|
|
|
|
|
|
Adolescent |
n=266-305 |
25.0 |
20.1-30.4 |
40.8 |
35.0-46.8 |
32.3** |
27.0-38.2 |
Male |
n=119-134 |
29.2 |
21.8-37.8 |
42.9 |
34.3-51.8 |
35.8 † |
27.8-44.7 |
Female |
n=147-171 |
21.6 |
15.6-28.7 |
39.0 |
31.5-47.1 |
29.5 |
22.8-37.3 |
|
|
|
|
|
|
|
|
Non-Hispanic white |
n=252-278 |
27.0 |
21.9-32.7 |
41.0 |
35.0-47.2 |
40.6 |
34.8-46.7 |
Male |
n=125-139 |
30.2 |
22.8-38.7 |
43.1 |
34.7-51.9 |
46.8 |
38.3-55.5 |
Female |
n=127-139 |
23.8 |
17.3-31.9 |
38.9 |
30.8-47.6 |
34.6* |
27.0-43.1 |
|
|
|
|
|
|
|
|
Hispanic |
n=120-138 |
19.8 |
13.6-27.6 |
37.0 |
28.8-45.9 |
33.9 |
26.1-42.7 |
Male |
n=59-64 |
23.3 |
14.4-35.4 |
37.3 |
26.1-50.1 |
39.0 |
27.6-51.7 |
Female |
n=60-74 |
16.4 |
9.0-27.21 |
36.7 |
25.6-49.3 |
29.0 |
19.2-41.3 |
*Indicates significant difference between genders, p<.05
**Indicates significant difference between demographic groups, p<.05
† Indicates significant difference between demographic groups, separately by gender, p<.05
Table 3. Dietary intake and behavior by income, age and ethnicity; and by gender within those categories.
|
Sample Size Range |
≤1 serving of sweets |
Sweets, 95% Confidence Intervals |
≤1 sugar-sweetened beverage |
SSB, 95% Confidence Intervals |
≤1 Fast Food in past week |
Fast food, 95% Confidence Intervals |
|
|
% |
|
% |
|
% |
|
Full Sample |
n=490-541 |
77.1 |
73.2-80.6 |
89.7 |
86.8-92.1 |
64.0 |
59.8-67.9 |
Male |
n=228-248 |
80.7 |
75.1-85.3 |
86.5 |
81.5-90.3 |
63.7 |
57.6-69.4 |
Female |
n=262-293 |
74.0 |
68.4-79.0 |
92.5* |
88.7-95.1 |
64.2 |
58.5-69.4 |
|
|
|
|
|
|
|
|
Higher Income |
n=299-320 |
75.9 |
70.8-80.4 |
91.1 |
87.4-93.8 |
66.6 |
61.2-71.5 |
Male |
n=135-143 |
79.3 |
71.7-85.2 |
86.1 |
79.4-90.9 |
63.6 |
55.5-71.1 |
Female |
n=164-177 |
73.2 |
65.9-79.4 |
95.2* |
90.9-97.6 |
68.9 |
61.8-75.3 |
|
|
|
|
|
|
|
|
Lower Income |
n=115-136 |
73.9 |
65.2-81.1 |
83.6** |
75.8-89.3 |
58.8 |
50.4-66.7 |
Male |
n=54-63 |
80.0 |
67.6-88.5 |
83.6 |
71.7-91.1 |
60.3 |
48.0-71.5 |
Female |
n=60-73 |
68.3 |
55.8-78.7 |
83.6 † |
72.4-90.8 |
57.5 |
46.1-68.2 |
|
|
|
|
|
|
|
|
Child |
n=224-236 |
78.1 |
72.3-83.0 |
92.5 |
88.4-95.3 |
67.8 |
61.6-73.4 |
Male |
n=109-114 |
80.7 |
72.3-87.0 |
89.1 |
81.9-93.7 |
72.8 |
64.0-80.1 |
Female |
n=115-122 |
75.7 |
67.1-82.6 |
95.8 |
90.5-98.2 |
63.1 |
54.3-71.2 |
|
|
|
|
|
|
|
|
Adolescent |
n=266-305 |
76.3 |
70.9-81.0 |
87.4 |
82.9-90.8 |
61.0 |
55.4-66.3 |
Male |
n=119-134 |
80.7 |
72.7-86.8 |
84.2 |
76.6-89.6 |
56.0 † |
47.5-64.1 |
Female |
n=147-171 |
72.8 |
65.1-79.3 |
89.9 |
84.1-93.8 |
64.9 |
57.5-71.7 |
|
|
|
|
|
|
|
|
Non-Hispanic white |
n=252-278 |
74.6 |
68.9-79.6 |
89.5 |
85.1-92.7 |
64.7 |
59.0-70.1 |
Male |
n=125-139 |
80.8 |
73.0-86.7 |
85.7 |
78.6-90.8 |
64.7 |
56.5-72.2 |
Female |
n=127-139 |
68.5* |
60.0-75.9 |
93.1 |
87.4-96.3 |
64.7 |
56.5-72.2 |
|
|
|
|
|
|
|
|
Hispanic |
n=120-138 |
80.0 |
72.0-86.2 |
90.1 |
83.5-94.2 |
63.0 |
54.7-70.6 |
Male |
n=59-64 |
85.0 |
73.9-91.9 |
86.7 |
75.8-93.1 |
62.5 |
50.3-73.3 |
Female |
n=60-74 |
75.0 |
62.8-84.2 |
93.4 |
84.3-97.4 |
63.5 |
52.1-73.6 |
*Indicates significant difference between genders, p<.05
**Indicates significan2021 Copyright OAT. All rights reservps, p<.05
† Indicates significant difference between demographic groups, separately by gender, p<.05
A larger proportion of children drank 2 or more glasses of milk per day compared to adolescents (p<.05). When analyzing genders separately, a larger proportion of male children drank 2 or more glasses of milk per day compared to adolescent males and a smaller proportion ate fast food more than once per week (p<.05). A larger proportion of lower income youth drank more than 1 SSB per day than higher income youth and a smaller proportion consumed 2 or more servings of fruit per day (p<.05). When analyzing genders separately, a smaller proportion of lower income males consumed 2 or more servings of fruit per day compared to higher income males and a higher proportion of lower income females drank more than 1 SSB per day compared to higher income females (p<.05). No other food or drink categories differed significantly between demographic groups.
Discussion
Although a larger proportion of the orthodontic sample were of a healthier weight status than US youth, almost a quarter were overweight or obese, putting them at increased risk of adult excess weight, morbidity and premature mortality, and indicating a need for intervention. Mirroring patterns across the state and nation,3,2,5,6,8 male, Hispanic, and low-income patients had higher rates of obesity. Moreover, our results suggest that even among child orthodontic patients—a group perceived as generally more privileged than average—disparities in risk of excess weight may persist for Hispanics and those of lower income.
Of the food categories evaluated, fruit and vegetable consumption was furthest from intake recommendations, indicating a specific dietary target for future interventions. A larger proportion consumed adequate fruits compared to fruits and vegetables combined, but still fell short of recommendations. Results also indicated fast food as a possible target of intervention. Fast food consumption has previously been linked to obesity [9,13]. Few youth consumed excessive SSBs; however, 42% drank at least 1 SSB per day, similar to what has been reported in the literature. As SSBs have been linked to both obesity [9,12] and oral health, [3] a better target might be only occasional consumption. A larger proportion of youth consumed sweets (such as cookies and candies) than SSBs. A small amount of “discretionary calories” are allowed per dietary guidelines, [9] and consumption of 1 small SSB or sweet might fall within those guidelines. However, youth must be cautious not to over-consume discretionary calories, a tendency that has been indicated in the literature, [9] making added sugars another target of intervention among orthodontic patients.
While few differences in dietary intake between demographic groups reached significance, the differences that did reach significance were in the expected direction and are supported by the literature among non-orthodontic samples. No ethnic dietary differences reached significance, due to smaller sample sizes when categorized by race/ethnicity. Results suggest that lower income youth would benefit from dietary intervention, and that adolescents may be more in need of intervention than younger children. These results also suggest that both genders would benefit from intervention, possibly with emphasis on different aspects of nutrition. The low consumption of milk by both genders raises concerns about adequate calcium consumption, needed during this critical period of bone and tooth development [3,4]. Calcium was likely consumed through other sources not assessed, but adequacy remains a concern as milk is one of the primary sources of calcium intake in children.[iii]
Ecological models of behavior suggest that intervention is needed at multiple levels to impact health behaviors and outcomes. Ideally, youth would hear health messages repeated at home, school, and in the community, and these messages would be supported by local, state, and federal policies. Supportive health messages and policies from multiple sources are required to counter negative influences from industries supporting sedentary behaviors and unhealthful eating. Clinicians have the opportunity to contribute to this health model at the community level. If health care professionals of all types repeated the same health messages, youth might hear the messages multiple times each year, from physicians, dentists, and other clinicians. For youth receiving orthodontic treatment, frequency of health messages could reach 10 or more repetitions a year, creating a supportive social environment for health. A past tobacco prevention trial, [18] where orthodontists delivered brief prevention messages to their patients, demonstrated a dose effect, supporting the notion that brief, frequent intervention can be an effective health promotion tool and that collectively, clinicians have the opportunity to improve patient risk profile and contribute to chronic disease prevention.
At baseline, all participants were undergoing orthodontic care. The diets of our orthodontic sample may not typify diets of the larger population. Dental appliances make consumption of hard, sticky, or chewy foods ill-advisable, and could partially explain the low consumption of fruits and vegetables. Our data include a relatively small group of the age cohort, but orthodontists represent a category of clinicians ideally suited to contribute to the obesity problem. The orthodontic sample was less ethnically/racially diverse and more affluent than the Californian population, so results may not be generalizable to the community population, but presumably are generalizable to the orthodontic population. Still, 22% of the sample was overweight or obese, and few consumed the recommended diet, suggesting, as the literature does, that the problems of obesity and poor nutrient intake span income and racial/ethnic categories.
Our adoption of the CHIS definition of a serving as “whatever it means to you” may have inconsistently classified participants into categories; however, children are often unable to accurately quantify portion size when asked [4]. The assessment omitted caloric and macro/micro-nutrient intake, precluding evaluation of other nutritional issues such as overconsumption of nutrients. Nonetheless, cruder measures are better than unreliable ones.
Future studies describing the orthodontic, dental and other populations should include a larger study sample to reveal statistical differences where for this study only trends were apparent. Twenty-four hour dietary recalls would provide a better description of diet, including caloric intake, macro- and micro-nutrients.
Conclusions
Contrary to the assumption that the orthodontic population is not a group in need of assistance, the majority of orthodontic patients could benefit from intervention. Similar to trends seen within the general population, the male, Hispanic, and lower income groups could benefit the most. Orthodontic and other dental providers, who already discuss nutrition in the context of oral health, have the opportunity to act with other members of the community, schools, and families to create a supportive social environment capable of improving the health of the nation’s youth.
Acknowledgements
Funding was provided by the National Institutes of Health, National Cancer Institute, grant #CA138192, awarded to Dr. Melbourne F. Hovell. NIH/NCI was not involved in the design, collection, analysis or interpretation of the data, the writing of this manuscript or in the decision to submit this manuscript for publication.
Author disclosure statement
No competing financial interests exist.
References
- Ogden CL, Flegal KM, Carroll MD, Johnson CL (2002) Prevalence and trends in overweight among US children and adolescents, 1999-2000. JAMA 288: 1728-1732. [Crossref]
- Ogden CL, Carroll MD, Kit BK, Flegal KM (2014) Prevalence of childhood and adult obesity in the United States, 2011-2012. JAMA 311: 806-814. [Crossref]
- Center for Disease Control and Prevention. Overweight and Obesity. Available at: http://www.cdc.gov/obesity/index.html. Accessed February 2, 2015.
- Must A, Jacques PF, Dallal GE, Bajema CJ, Dietz WH (1992) Long-term morbidity and mortality of overweight adolescents. A follow-up of the Harvard Growth Study of 1922 to 1935. N Engl J Med 327: 1350-1355. [Crossref]
- Singh GK, Kogan MD (2010) Childhood Obesity in the United States, 1976-2008: Trends and Current Racial/Ethnic, Socioeconomic, and Geographic Disparities. A 75th Anniversary Publication. Health Resources and Services Administration, Maternal and Child Health Bureau. Rockville, Maryland: U.S. Department of Health and Human Services.
- Wang Y, Beydoun MA (2007) The Obesity Epidemic in the United States—Gender, Age, Socioeconomic, Racial/Ethnic, and Geographic Characteristics: A Systematic Review and Meta-Regression Analysis. Epidemiol Rev 29: 6-28.
- Ogden CL, Lamb MM, Carroll MD, et al. Obesity and socioeconomic status in children: United States 1988–1994 and 2005–2008. NCHS data brief no 51. Hyattsville, MD: National Center for Health Statistics. 2010.
- Babey SH, Hastert TA, Wolstein J, Diamant AL (2010) Income disparities in obesity trends among California adolescents. Am J Public Health 100: 2149-2155. [Crossref]
- U.S. Department of Agriculture and U.S. Department of Health and Human Services. Dietary Guidelines for Americans, 2010. 7th Edition, Washington, DC: U.S. Government Printing Office, December 2010.
- Krebs-Smith SM, Guenther PM, Subar AF, Kirkpatrick SI, Dodd KW (2010) Americans do not meet federal dietary recommendations. J Nutr 140: 1832-1838. [Crossref]
- Albar SA, Alwan NA, Evans CE, Cade JE (2014) Is there an association between food portion size and BMI among British adolescents? Br J Nutr 112: 841-851. [Crossref]
- Woodward-Lopez G, Kao J, Ritchie L (2011) to what extent have sweetened beverages contributed to the obesity epidemic? Public Health Nutr 14: 499-509. [Crossref]
- A K Kant, M I Whitley, B I Graubard (2014) Away from home meals: associations with biomarkers of chronic disease and dietary intake in American adults, NHANES 2005-2010, Int J Obes .
- Kirkpatrick SI, Dodd KW, Reedy J, Krebs-Smith SM (2012) Income and race/ethnicity are associated with adherence to food-based dietary guidance among US adults and children. J Acad Nutr Diet 112: 624-635. [Crossref]
- Vine M, Hargreaves MB, Briefel RR, Orfield C (2013) Expanding the role of primary care in the prevention and treatment of childhood obesity: a review of clinic- and community-based recommendations and interventions. J Obes 2013: 172035. [Crossref]
- Orrow G, Kinmonth AL, Sanderson S, Sutton S (2012) Effectiveness of physical activity promotion based in primary care: systematic review and meta-analysis of randomised controlled trials. BMJ 344: e1389. [Crossref]
- Patrick K, Calfas KJ, Norman GJ, Zabinski MF, Sallis JF, et al. (2006) Randomized controlled trial of a primary care and home-based intervention for physical activity and nutrition behaviors: PACE+ for adolescents. Arch Pediatr Adolesc Med 160: 128-136. [Crossref]
- Hovell MF, Slymen DJ, Jones JA, Hofstetter CR, Burkham-Kreitner S, et al. (1996) An adolescent tobacco-use prevention trial in orthodontic offices. Am J Public Health 86: 1760-1766. [Crossref]
- Keim RG, Gottlieb EL, Nelson AH, Vogels DS 3rd (2013) 2013 JCO Orthodontic Practice Study. Part 1: trends. J Clin Orthod 47: 661-680. [Crossref]
- Vann WF Jr, Bouwens TJ, Braithwaite AS, Lee JY (2005) The childhood obesity epidemic: a role for pediatric dentists? Pediatr Dent 27: 271-276. [Crossref]
- American Academy of Pediatric Dentistry (2012) Policy on Dietary Recommendations for Infants, Children, and Adolescents. AAPD Reference Manual 36: 56-58.
- Huang JS, Becerra K, Walker E, Hovell MF (2006) Childhood overweight and orthodontists: results of a survey. J Public Health Dent 66: 292-294. [Crossref]
- American Dental Association. Preventive health statement on nutrition and oral health. Current Policies. Chicago, IL. 2014.
- UCLA Center for Health Policy Research. California Health Interview Survey.
- Center for Disease Control and Prevention. About BMI for children and teens. February 2, 2015. (Archived by WebCite at http://www.webcitation.org/6WYzYnM3s).
- Lim S, Tellez M, Ismail AI. Dental caries development among African American children: results from a 4-year longitudinal study. Community Dent Oral Epidemiol. 2014 Dec 2.
- Cromer B, Harel Z (2000) Adolescents: at increased risk for osteoporosis? Clin Pediatr (Phila) 39: 565-574. [Crossref]
- Krall EA (2006) Calcium and Oral Health. In: Weaver CM and Heaney RP, ed. Calcium in Human Health. Totowa, NJ: Humana Press 319-325.
- French SA, Lin BH, Guthrie JF (2003) National trends in soft drink consumption among children and adolescents age 6 to 17 years: prevalence, amounts, and sources, 1977/1978 to 1994/1998. J Am Diet Assoc 103: 1326-1331. [Crossref]
- Tabacchi G, Amodio E, Di Pasquale M, Bianco A, Jemni M, et al. (2014) Validation and reproducibility of dietary assessment methods in adolescents: a systematic literature review. Public Health Nutr 17: 2700-2714. [Crossref]