Objective
There are many factors influencing dental behavior. The relationship of smokers who smoked inside the home toward preventive care (measured as dental sealant placement) of the children living in their homes is examined in this study.
Methods
Data from the National Health and Nutrition Examination Surveys in 2001-2002 and in 2011-2012 were analyzed. Data included the variables of someone smoking inside the home, dental sealant placement in children ages 6-less than 20 years, and sociodemographic data. The data were obtained from a dental examination and a home interview.
Results
There were 3,352 eligible participants in 2001-2002 and 2,374 in 2011-2012. The unadjusted odds ratio for not having dental sealants when there was someone who smoked inside the home as compared with not having dental sealants when there was no one who smoked inside the home was 1.57 (95%CI: 1.17, 2.10) in 2001-2002. The unadjusted odds ratio was 1.56 (95% CI: 1.20, 2.03) in 2011-2012. When the data were adjusted for age, sex, race/ethnicity, insurance, and income to poverty ratio, the 2001-2002 adjusted odds ratio was 1.31 (95%CI: 0.97, 1.78). The adjusted odds ratio in 2011-2012 was 1.41 (95% CI:1.01, 1.95).
Conclusions
Children who lived in homes in which someone smoked inside the home were more likely to not have dental sealants compared with children who lived in homes in which no one smoked inside the home. These results are important for understanding the factors related to access to dental care issues for children.
dental sealants, tobacco use, NHANES
In 1979, the Department of Health and Human Services developed a 10-year public health goal for the people of the United States. Since then, 10-year goals and programs were developed in advance of the years 2000 (Healthy People 2000), 2010 (Healthy People 2010) and 2020 (Healthy People 2020). In addition to addressing the biological factors involved with health, the programs also included social, environmental, and behavioral factors. Major objectives in all of the programs were reductions in tobacco use and reductions in secondhand smoke exposure. The U.S. National Cancer Institute identified secondhand smoke as exposure to smoke from burning end of tobacco and/or exposure to the exhaled smoke of the smoker [1]. Tobacco use and secondhand smoke exposure are significant global public health problems. Secondhand smoke is a factor in heart disease, lung cancer, asthma attacks, respiratory and ear infections, sudden unintentional infant death syndrome [2-5] and early childhood caries [6,7]. There are over 7000 components in secondhand smoke and some are more concentrated than in firsthand smoke [1,8,9].
Specific examples of the Healthy People 2020 tobacco objectives include: an increase in tobacco screenings in dental care settings (from 52.9% in 2010 to a proposed 58.2% in 2020); a reduction in the use of cigarettes by adults (from 20.6% in 2008 to a proposed 12% in 2020); an increase in smoking cessation attempts by adults (from 48.3% in 2008 to a proposed 80% in 2020); and a reduction in the proportion of children ages 12-17 years exposed to secondhand tobacco smoke (from 45.5% in 2005-08 to a proposed 41% in 2020) [10]. The Surgeon General’s Report on Oral Health in America stressed that cultural/behavioral factors (such as tobacco use) affect how people care for themselves and seek and use health services [11].
Healthy People 2020 also addresses the provision of quality care (better health care, better preventive care), and having equitable care to reduce health disparities. One of the oral health objectives is to have more children receive dental sealants. Bisphenol-a glycidyl dimethacrylate (BIS-GMA) dental sealants were introduced in the 1970s to protect the occlusal surfaces of teeth from dental caries and they are an underutilized service. The 2020 proposed objective for children ages 6-9 years is to have 28.1% receive molar sealants (up from 25.5% in 1999-2004); and for children ages 13-15 years, the objective is to have 21.9% receive molar sealants (up from 19.9% in 1999-2004) [10].
Social and cultural/behavioral factors of oral health have been implicated in oral health disparities [12]. Income, race/ethnicity, and education are among the most studied social and cultural/behavioral factors. During the decade from 2001 to 2011, many social and cultural/behavioral changes have occurred. Considering income, between 2001 and 2011, many people in the United Sates have had financial hardships resulting from direct and indirect financial impact of the 9/11 Terrorist Act, the wars in Iraq and Afghanistan, the Great Recession, the economy’s slow recovery, and job and investment losses. In addition to the events having an impact on income, they also had public health consequences. In dentistry, dental treatment stagnated for children of age 0-20 years. In 2001, dental expenditures for individuals ages 0-20 years were $666 per patient, and in 2011, the dental expenditures were $649 per patient [13]. In terms of education for that time frame, the median U.S. education level in 2000 and 2013 was a high school education with 28.6% having a high school education in both 2000 [14] and 29.5% in 2013 [15].
Tobacco use is a cultural/behavioral factor of oral health which has changed in prevalence from 2001 to 2011. Social pressure to reduce smoking in public places and social awareness campaigns so that children are not exposed to tobacco smoke in the home have made progress in reducing tobacco use. In 2001, 22.8% of the adults in the U.S. smoked [16] and in 2011, 19.0% of adults in the U.S. smoked [17]. Tobacco use has the potential to synergistically influence the health of a child by not only exposing the child to secondhand smoke, but by also limiting monetary resources for nutritious food and healthcare through the expenditure of money on tobacco. A pack-year of cigarettes costs over $2000 [18]. Also, previous research has indicated that tobacco users were more likely to perceive a need for dental treatment in all categories except dental cleaning (prevention) services [19].
The purpose of this research is to:
- a) Describe the frequency of sealant placement in 2001-2002 and in 2011-2012 for children who live in homes with someone who smokes inside the home;
- b) Describe the association of sealant placement and someone smoking inside the home with sealant placement in children who do not have someone smoking inside the home;
- c) Compare the association of sealant placement and someone smoking inside the home in 2001-2002 with 2011-2012.
The rationale for this study is that someone who smokes inside a home may be more likely to not seek dental preventive services for the children in the home given his or her own less perceived need for dental cleaning (preventive services). The potential exists despite the public health efforts of Healthy People 2010. Dye, et al.
reported that the association of smoking and culture may guide decision-making and rationalizing the need for care/dental utilization [19]. This study furthers that research into the influence on the children in the home of someone who smokes inside the home. That is, the attitudes of someone smoking inside the home toward preventive dental services for the children may not have been influenced by social pressures and social awareness campaigns for the sealant objectives of Healthy People 2010. Previous researchers have not examined the association of tobacco use inside the home and its association with the preventive care of children as a cultural/behavioral factor of oral health care.
The null hypothesis is that the odds ratios for no sealant placement in children from homes with someone smoking inside the home and for children who do not have someone smoking inside the home is 1.00. The research hypothesis is that the odds for no sealant placement is greater than 1.00 for children from homes with someone smoking inside the home as compared with children who do not have someone smoking inside the home.
This study was acknowledged by the West Virginia University Institutional Review Board, proposal 1409429938. NHANES, the National Health and Nutrition Examination Survey, is a survey conducted by researchers from the Centers of Disease Control and Prevention (CDC). It includes interviews, examinations and laboratory tests on the health, and nutrition of noninstitutionalized civilians in the United States. It has a complex survey design with oversampling of subgroups to increase the reliability and precision of estimates. The NHANES researchers used a complex, multistage probability design with weighting schemes. All participants were provided with verbal and written consent. Each year of the NHANES had approximately 5,000 participants. Details of the NHANES studiesare provided at the NHANES website [20].
The data used in this study are from the public release of NHANES 2001-2002 and NHANES 2011-2012 data.
Inclusion criteria
The study design for this study was cross-sectional. Participants were selected from the NHANES 2001-2002 and NHANES 2011-2012 data sets. Inclusion criteria were that the participants were between the ages of 6 and 20 years, had oral evaluations including sealant placement data, and had yes/no data concerning the presence or absence of someone smoking in the home.
Variable of interest, sealant placement
The participating children had oral health examinations conducted by calibrated dentists who held a state dental license. The examinations were conducted in the NHANES mobile examination center. The examiners used surface reflecting mirrors and number 23 explorers. The teeth were air-dried before evaluation. In this study, a sealant was identified as being present when any sealant material was present on the surface of the occlusals of the premolars, primary molars, or first and second molars; however if the sealant appeared to be part of a restoration rather than a preventive service, the tooth was identified as having a restoration rather than a sealant [20].
Variable of interest, someone smoking in the home
The variable, presence or absence of someone smoking in the home, was determined by the response of one of the family members answering the question about the smoking behavior of all household members. The question was asked in the home as part of the Family Questionnaire. The question was: “Does anyone who lives here smoke cigarettes, cigars, or pipes anywhere inside this home?” [20].
Other variables
Other variables considered in the study were sex (male v. female); age (6 to less than 12 years v. 12 to less than 20 years); race/ethnicity (Non-Hispanic Black, Mexican-American, Other v. Non-Hispanic White); family income to poverty ratio (1 to less than 1.25, 1.25 to less than 2, 2 to less than 4.00 v. 4.00 and above); and insurance (no v. yes).
Data were analyzed for sample characteristics (frequency, weighted percentages, and standard errors), and frequency of sealant placement in all children and in children who lived in households in which someone smoked inside the home. Chi square analyses were conducted for children ages 6 to less than 12 years and 12 to less than 20 years who also lived in households in which someone smoked inside the home versus sealant placement in 2001-2002 and 2011-2012. Unadjusted and adjusted logistic regression on no sealant placement were conducted for children ages 6 to less than 20 years who lived in households in which someone smoked inside the home versus children ages 6 to less than 20 years who lived in households in which no one smoked inside the home. The significance level of 0.05 was used. All statistical analyses were conducted with SAS 9.3 (SAS Institute Inc., Cary, NC).
Sample characteristics
The sample in 2001-2002 and 2011-2012 had an equal distribution of male and female children: 48.7% females in 2001-2002 and 48.7% in 2011-2012. There were no significant differences in sample characteristics of agerace/ethnicity, family income to poverty ratio, or insurance coverage between 2001-2002 and 2011-2012. The samples had 43.9% ages 6 years to 12 years in 2001-2002, and 42.1% in 2011-2012. There were 59.9% Non-Hispanic whites in 2001-2002, and 54.4% in 2011-12. There were 29.8% (2001-2002) and 33.5% (2011-2012) who had a family to poverty ratio of 0 to less than 1.25. In 2001-2002, 84.5% had insurance coverage and in 2011-2012, 89.6% had insurance coverage. There was a significant increase in overall sealant placement in 2011-12 from 33.1% in 2001-2002 to 41.2% in 2011-12 (p=0.0063). There was a significant decrease in someone who smoked inside the home in 2012 from 22.6% in 2001-2002 to 10.9% in 2011-2012 (p<0.001) (Table 1).
Table 1. Sample Characteristics Children ages 6 to less than 20 years, NHANES 2001-02 and 2011-12
|
2001-02 |
2011-12 |
p-value |
|
N |
Weighted frequency |
Weighted column % (SE) |
N |
Weighted frequency |
Weighted column % (SE) |
|
Sample |
3352 |
|
|
2374 |
|
|
|
Sex |
|
|
|
|
|
|
0.9842 |
Male |
1691 |
27,706,116 |
51.3 (0.9) |
1214 |
28,492,615 |
51.3 (1.4) |
|
Female |
1711 |
26,314,258 |
48.7 (0.9) |
1160 |
27,025,902 |
48.7 (1.4) |
|
Age Group in Years |
|
|
|
|
|
|
0.3293 |
6 to less than 12 |
1152 |
23,709,978 |
43.9 (1.2) |
1204 |
23,365,136 |
42.1 (1.4) |
|
12 to less than 20 |
2250 |
30,310,396 |
56.1 (1.2) |
1170 |
32,153,382 |
57.9 (1.4) |
|
Race/ethnicity |
|
|
|
|
|
|
0.6782 |
Non-Hispanic White |
1011 |
32,359,376 |
59.9 (3.0) |
548 |
30,211,806 |
54.4 (4.4) |
|
Non-Hispanic Black |
1083 |
7,940,637 |
14.7 (2.4) |
705 |
8,377,572 |
15.1 93.0) |
|
Mexican American |
1015 |
6,176,756 |
11.4 (1.4) |
441 |
7,978,456 |
14.4 (2.8) |
|
Other |
293 |
7,543,604 |
13.9 (2.8) |
680 |
8,950684 |
16.0 (1.9) |
|
Family Income to poverty ratio |
|
|
|
|
|
|
0.6748 |
0 to less than 1.25 |
1264 |
15,524,580 |
29.8 (1.2) |
996 |
17,694,202 |
33.5 (3.8) |
|
1.25 to less than 2.00 |
583 |
8,284,066 |
15.9 (1.1) |
364 |
8,254,779 |
15.6 (1.7) |
|
2.00 to less than 4.00 |
847 |
15,771,928 |
30.3 (1.3) |
475 |
14,373,295 |
27.2 (2.8) |
|
4.00 and above |
554 |
12,498,461 |
24.0 (1.5) |
363 |
12,448,521 |
23.6 (2.7) |
|
Insurance |
|
|
|
|
|
|
0.0841 |
Yes |
2713 |
45,566,533 |
84.5 (1.6) |
2100 |
49,631,823 |
89.6 (2.2) |
|
No |
678 |
8,371,126 |
15.5 (1.6) |
266 |
5,759,394 |
10.4 (2.2) |
|
Sealants, overall |
|
|
|
|
|
|
0.0063 |
Yes |
963 |
18,000,937 |
33.1 (2.2) |
879 |
22,876,797 |
41.2 (1.9) |
|
No |
2439 |
36,019,436 |
66.9 (2.2) |
1495 |
32,641,721 |
58.8 (1.9) |
|
Sealants by age |
|
|
|
|
|
|
|
6 years to less than 12 years |
|
|
|
|
|
|
0.0085 |
Yes |
275 |
6,725,501 |
28.4 (3.6) |
431 |
9,228,363 |
39.5 (1.9) |
|
No |
877 |
16,984,477 |
71.6 (3.6) |
773 |
14,136,774 |
60.5 (1.9) |
|
12 years to less than 20 years |
|
|
|
|
|
|
0.1135 |
Yes |
688 |
11,275,436 |
37.2 (1.9) |
448 |
13,648,435 |
42.4 (2.8) |
|
No |
1562 |
19,034,959 |
62.8 (1.9) |
722 |
18,504,947 |
57.6 (2.8) |
|
Smoking inside the house |
|
|
|
|
|
|
<.0001 |
Yes |
734 |
12,194,338 |
22.6 (1.6) |
294 |
6,059,806 |
10.9 (1.1) |
|
No |
2668 |
41,826,035 |
77.4 (1.6) |
2080 |
49,458,711 |
89.1 (1.1) |
|
N=number; SE=standard error. p-value is based on the Rao-Scott Chi-Square test between the years 2001-2 and 2011-12.
Prevalence and Chi-Square analysis
Prevalence of sealant placement on molars and premolars is presented in Figure 1. In 2001 there were 19.8% participants who had 4 or more sealants; and in 2011, there were 22.0% who had 4 or more sealants. Prevalence of sealant placement on molars and premolars when there was someone who smoked inside the home is presented in Figure 2. In 2001-2002, there were 13.4% of children who had 4 or more sealants and had someone who smoked inside the home and in 2011-2012 there were 13.9% of children who had 4 or more sealants and someone who smoked inside the home.
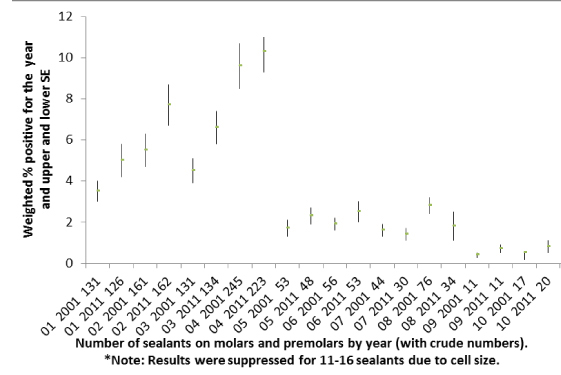
Figure 1. Prevalence of Sealant placement overall
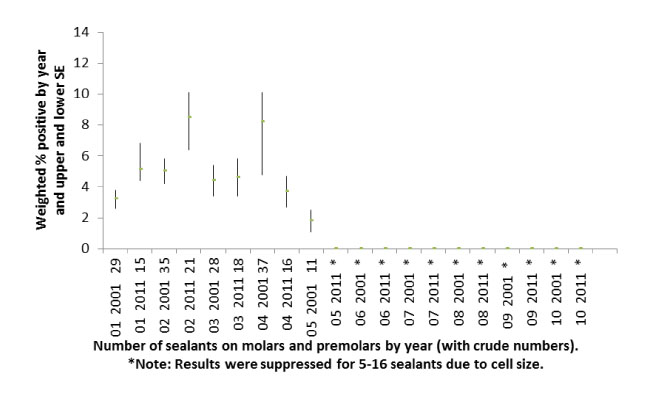
Figure 2. Prevalence of Sealant placement, & smoking inside the home.
Chi-Square analyses with respect to household smoking comparing 2001-2002 and 2011-2012 are presented in Tables 2 and 3. From 2001-2012, there was no significant difference in sealants in children ages 6 to less than 12 years, nor in children 12 to less than 20 years who had someone who smoked inside the home. In subgroup analysis considering sex, race/ethnicity, and family income to poverty ratio, the only significant relationship was for Non-Hispanic Black children ages 6 to less than 12 years in which there was an increase in sealants from 2001-2002 to 2011-2012. That is, in 2001-2002, there were 17.5% of Non-Hispanic black children ages 6 to less than 12 years living in a home in which someone smoked inside the home who had sealants. The weighted percentage was 31.4% in 2011-2012.
Table 2. Frequency of someone smoking inside the home and childhood experiences with sealants:
Children ages 6 to less than 12 years, NHANES 2001-02 and 2011-12
|
2001-02 |
2011-12 |
p-value |
|
N |
Weighted frequency |
Weighted column % (SE) |
N |
Weighted frequency |
Weighted column % (SE) |
% difference in receiving sealants
(2011-12)-(2001-2), and p-value |
Overall, 6 to less than 12, in homes where someone smoked inside the home |
|
|
|
|
|
|
+11.3, 0.2268 |
Yes, sealants |
49 |
1,273,863 |
21.8 (7.3) |
56 |
984,330 |
33.1 (3.9) |
|
No, sealants |
224 |
4,561,319 |
78.2 (7.3) |
108 |
1,985,621 |
66.9 (3.9) |
|
Sex |
|
|
|
|
|
|
|
Male |
|
|
|
|
|
|
-4.6, 0.6209 |
Yes, sealants |
26 |
733,168 |
35.9 (9.2) |
32 |
511,337 |
31.3 (4.4) |
|
No sealants |
97 |
2,094,108 |
74.1 (9.2) |
55 |
1,124,476 |
68.7 (4.4) |
|
Female |
|
|
|
|
|
|
+17.5, 0.1356 |
Yes, sealants |
23 |
540,695 |
18.0 (6.1) |
24 |
472,993 |
35.5 (9.7) |
|
No sealants |
127 |
2,467,211 |
82.0 (6.1) |
53 |
861,145 |
64.5 (9.7) |
|
Race/ethnicity |
|
|
|
|
|
|
|
Non-Hispanic White |
|
|
|
|
|
|
+8.6, 0.4642 |
Yes, sealants |
16 |
817,224 |
22.4 (8.1) |
16 |
503,518 |
31.0 (8.3) |
|
No sealants |
74 |
2,833,184 |
77.6 (8.1) |
30 |
1,22,697 |
69.0 (8.3) |
|
Non-Hispanic Black |
|
|
|
|
|
|
+13.9, 0.0080 |
Yes, sealants |
21 |
204,365 |
17.5 (4.3) |
25 |
250,180 |
31.4 (3.3) |
|
No sealants |
103 |
965,621 |
82.5 (4.2) |
56 |
546,730 |
68.6 (3.3) |
|
Mexican American |
|
|
|
|
|
|
|
Yes, sealants |
10 |
49,517 |
13.9 (4.6) |
* |
* |
* |
|
No sealants |
62 |
307,576 |
86.1 (4.6) |
* |
* |
* |
|
Other race/ethnicity |
|
|
|
|
|
|
|
Yes, sealants |
* |
* |
* |
14 |
215,849 |
59.1 (4.7) |
|
No sealants |
* |
* |
* |
21 |
149,566 |
40.9 (4.7) |
|
Income to poverty ratio |
|
|
|
|
|
|
+13.2, 0.4071 |
0 to less than 1.25 |
|
|
|
|
|
|
|
Yes, sealants |
20 |
613,094 |
21.0(11.3) |
39 |
628,865 |
34.2 (7.8) |
|
No, sealants |
132 |
2,312,137 |
79.0 (11.3) |
74 |
1,210,576 |
65.8 (7.8) |
|
1.25 to less than 2.00 |
* |
* |
* |
* |
* |
* |
|
2.00 to less than 4.00 |
|
|
|
|
|
|
+6.6, 0.4720 |
Yes, sealants |
15 |
384,087 |
33.3 (8.6) |
10 |
272,355 |
39.9 (2.2) |
|
No sealants |
28 |
768.082 |
66.7 (8.6) |
14 |
410,963 |
60.1 (2.2) |
|
4.00 and above |
* |
* |
* |
* |
* |
* |
|
*Results were suppressed due to cell size.
Abbreviations: N=number; Wt=weighted; F=frequency; SE=standard error.
p-value is based on the Rao-Scott Chi-Square test between the years 2001-2 and 2011-12.
Table 3. Someone smoking inside the home and childhood experience with sealants: Children ages 12 to less than 20 years NHANES 2001-02 and 2011-12
|
2001-02 |
2011-12 |
p-value |
|
N |
Weighted frequency |
Weighted column % (SE) |
N |
Weighted frequency |
Weighted column % (SE) |
% difference in receiving sealants
(2011-12)-(2001-2), and p-value |
Overall, 12 to less than 20, in homes where someone smoked inside the home |
|
|
|
|
|
|
+1.3, 0.8141 |
Yes, sealants |
177 |
1,889,362 |
29.7 (2.5) |
45 |
957,454 |
31.0 (4.8) |
|
No, sealants |
344 |
4,469,794 |
70.3 (2.5) |
85 |
2,132,401 |
69.0 (4.8) |
|
Sex |
|
|
|
|
|
|
|
Male |
|
|
|
|
|
|
+11.7, 0.0763 |
Yes, sealants |
52 |
920,791 |
28.8 (3.4) |
34 |
712,143 |
(5.9) |
|
No sealants |
174 |
2,275,109 |
71.2 (3.4) |
36 |
1,047,426 |
(5.9) |
|
Male |
|
|
|
|
|
|
-12.2, 0.0644 |
Yes, sealants |
65 |
986,571 |
30.6 (3.9) |
11 |
245,312 |
18.4 (5.0) |
|
No sealants |
170 |
2,194,686 |
69.4 (39) |
49 |
1,084,976 |
81.6 (5.0) |
|
Race/ethnicity |
|
|
|
|
|
|
|
Non-Hispanic White |
|
|
|
|
|
|
-10.6, 0.1192 |
Yes, sealants |
59 |
1,479,229 |
34.8 (3.3) |
11 |
407,459 |
24.2 (5.1) |
|
No sealants |
98 |
2,771,774 |
65.2 (3.3) |
28 |
1,276,250 |
75.8 (5.1) |
|
Non-Hispanic Black |
|
|
|
|
|
|
+6.9, 0.4409 |
Yes, sealants |
42 |
254,721 |
21.7 (6.0) |
17 |
225,000 |
28.6 (6.6) |
|
No sealants |
161 |
920,997 |
78.3 (6.0) |
40 |
563,062 |
71.4 (6.6) |
|
Mexican American |
|
|
|
|
|
|
|
Yes, sealants |
10 |
49,517 |
13.9 (4.6) |
* |
* |
* |
|
No sealants |
62 |
307,576 |
86.1 (4.6) |
* |
* |
* |
|
Other |
|
|
|
|
|
|
|
Yes, sealants |
* |
* |
* |
11 |
181,589 |
44.0 (9.4) |
|
No sealants |
* |
* |
* |
15 |
230,652 |
56.0 (9.4) |
|
Income to federal poverty index |
|
|
|
|
|
|
+11.9, 0.639 |
0 to less than 1.25 |
|
|
|
|
|
|
|
Yes, sealants |
44 |
514,576 |
20.3 (4.7) |
30 |
569,846 |
32.2 (4.5) |
|
No, sealants |
169 |
2,035,889 |
79.7 (4.7) |
56 |
1,197,584 |
67.8 (4.5) |
|
1.25 to less than 2.00 |
|
|
|
|
|
|
|
Yes, sealants |
16 |
298,214 |
26.3 (6.9) |
* |
* |
* |
|
No sealants |
65 |
835,270 |
73.7 (6.9) |
* |
* |
* |
|
2.00 to less than 4.00 |
|
|
|
|
|
|
|
Yes, sealants |
32 |
616,347 |
40.8 (5.5) |
* |
* |
* |
|
No sealants |
62 |
892,862 |
59.2 (5.5) |
* |
* |
* |
|
4.00 and above |
|
|
|
|
|
|
|
Yes, sealants |
16 |
318,819 |
39.5 (6.7) |
* |
* |
* |
|
No sealants |
28 |
489,173 |
60.5 (6.7) |
* |
* |
* |
|
*Results were suppressed due to cell size.
Abbreviations: N=number; Wt=weighted; F=frequency; SE=standard error.
p-value is based on the Rao-Scott Chi-Square test between the years 2001-2 and 2011-12.
Although not presented in tabular form, there were 30.5% (Standard Error, SE, 3.1) of children ages 6 to less than 12 years who lived in homes in which no one smoked inside the home who received sealants in 2001-2002, and there were 40.4% (SE=2.2) who received sealants in 2011-2012. There was a significant increase in sealant placement for the children ages 6 to less than 12 years who lived in homes in which no one smoked inside the home from 2001-2002 to 2011-2012 (p=.0104).
For the children ages 12 to less than 20 years who lived in homes in no one smoked inside the home, 39.2% (SE=1.9) received sealants in 2001-2002, and 43.7% (SE=3.1) received sealants in 2011-2012. There was no difference in sealant placement for the children ages 12 to less than 20 years who lived in homes in which no one smoked inside the home from 2001-2002 to 2011-2012 (p=.2117).
Logistic regressions
The unadjusted odds ratio for not having dental sealants when there was someone who smoked inside the home as compared with not having dental sealants when there was no one who smoked inside the home was 1.57 (95%CI: 1.17, 2.10) in 2001-2002. The unadjusted odds ratio was 1.56 (95% CI: 1.20, 2.03) in 2011-2012.
When the data were adjusted for age, sex, race/ethnicity, insurance, and income to poverty ratio, the 2001-2002 adjusted odds ratio was 1.31 (95%CI: 0.97, 1.78). The adjusted odds ratio in 2011-2012 was 1.41 (95% CI:1.01, 1.95). Results are presented in Table 4.
Table 4. Logistic regression on not having a dental sealant with someone who smokes inside the home, NHANES 2001-02 and 2011-12
|
2001-02 Odds Ratios (95% CI) |
2011-12 Odds Ratios (95% CI) |
Smoking in home, Unadjusted |
|
|
Yes |
1.57 (1.17, 2.10) |
1.56 (1.20, 2.03) |
No |
referent |
referent |
Smoking in home, Adjusted |
|
|
Yes |
1.31 (0.97, 1.78) |
1.41 (1.01, 1.95) |
No |
referent |
referent |
Family income to poverty ratio |
|
|
0 to less than 1.25 |
1.79 (1.22, 2.61) |
1.21 (0.80, 1.83) |
1.25 to less than 2.00 |
1.47 (1.08, 2.01) |
1.04 (0.70, 1.55) |
2.00 to less than 4.00 |
1.06 (0.72, 1.58) |
1.38 (0.90, 2.12) |
4.00 and above |
referent |
referent |
Race/ethnicity |
|
|
Non-Hispanic Black |
1.85 (1.21, 2.81) |
1.88 (1.38, 2.56) |
Mexican American |
1.50 (1.05, 2.14) |
1.04 (0.74, 1.47) |
Other |
1.85 (1.36, 2.51) |
1.25 (0.91, 1.71) |
Non-Hispanic White |
referent |
referent |
Sex |
|
|
Male |
1.00 (0.85, 1.19) |
1.11 (0.83, 1.48) |
Female |
referent |
referent |
Insurance |
|
|
No |
2.09 (1.41, 3.09) |
1.22 (0.71, 2.11) |
Yes |
referent |
referent |
Age groups |
|
|
6 to less than 12 years |
1.44 (1.04, 2.01) |
1.15 (0.87, 1.53) |
12 to less than 20 years |
referent |
referent |
Abbreviation: CI = confidence interval.
This study evaluated the trends in frequency of sealant placement for children who lived in homes with someone who smoked inside the home from cross-sectional NHANES data from 2001-2002 and 2011-2012. The results indicate that, except for a significant increase in sealant placement in Non-Hispanic Blacks, there was no significant change in sealant placement for children who lived in homes with someone who smoked inside the home over the 10 years. In 2011-12, 33.1% (SE=3.9) of children ages 6 to less than 12 years living in homes in which someone smoked inside the home received sealants; and31.0% (SE=4.8) of children ages 12 to less than 20 years living in homes in which someone smoked inside the home received sealants. When compared with children in whom no one smoked inside the home in logistic regression, children with someone who smoked inside the home were more likely to not have received sealants with both crude and adjusted odds ratios. The association remained as strong in the 2011-2012 analyses as it was in the 2001-2002 analyses even after controlling for sex, race/ethnicity, family income to poverty ratio, age, and insurance status.
This is the first study, to analyze the association of someone who smoked inside the home and sealant placement for the children who lived in the home. There have been significant cultural/behavioral changes in tobacco use and in smoking inside the home in the U.S. However, the remaining smokers are more likely to underutilize preventive dental care [19,21]. Bloom et al., reported that current smokers were twice as likely as former smokers/never smokers to not have had a dental visit in more than 5 years [21]. Iida et al., also reported that U.S. women of childbearing age who smoked were more likely to have untreated caries, an indicator of an individual’s lack of preventive/routine care [22]. Similarly, Drilea et al., reported that 32.9% of current smokers had dental visits within the year as compared with 45.0% of non-smokers [23] and Mucci and Brooks reported lower dental services among long term cigarette smokers [24].
Additionally, Yeung et al., reported that overall, the use of health preventive services in children is not optimal, and was especially low for dental preventive services in young children [25]. Dye et al., suggested targeting self-care messages to smokers [19]. The results of this study additionally suggest that targeted messages to smokers should also include the importance of sealants as dental preventive services for children. Smoking in the home was an influential factor in children not having sealants placed and should be considered in public health discussions concerning dental care as well as in dentist/dental hygienist and patient communications.
This study has limitations. The determination of someone smoking in the home was a reported answer on a questionnaire. The report could be subject to social desirability bias. However, such a bias would be to respond that no one smoked inside the home and would tend to lower the association in this study. It would increase the likelihood that the null hypothesis would not be rejected. Also, the presence of someone smoking in the home does not necessarily indicate that the smoker is responsible for the healthcare of the child. Additionally, the variable for parental/guardian education level was not available. Parental/guardian education could be a confounder with smoking inside the home and could be a limitation to the study. It should be noted that as a characteristic of cross-sectional study designs, causation and temporal relationships cannot be inferred.
The study also has strengths in that it used NHANES data which were collected from large and nationally representative samples by calibrated examiners in an oral health examination and by trained interviewers. The data are recognized as accurate and useful in producing epidemiological health statistics for the U.S. [20].
Children with someone who smokes inside the home are less likely to have dental sealants than children who do not have someone who smokes inside the home. The relationship has remained unchanged from 2001-2002 to 2011-2012.
Research reported in this publication was supported by the National Institute of General Medical Sciences of the National Institutes of Health under Award Number U54GM104942. The content is solely the responsibility of the author and does not necessarily represent the official views of the National Institutes of Health. The funders had no role in study design, data collection and analysis, decision to publish, or preparation of the manuscript.
This manuscript was the work of RCW who designed the study, analyzed the data and wrote the manuscript.
- Health and Human Services (HHH). Cancer progress report: Second hand smoke and cancer 2003. 2004.
- Joya X, Manzano C, Álvarez AT, Mercadal M, Torres F, et al. (2014) Transgenerational exposure to environmental tobacco smoke. Int J Environ Res Public Health 11: 7261-7274. [Crossref]
- Printz C (2014) Smoke signals: evidence grows in tobacco's effects on cancer patients. Cancer 120: 1443-1444. [Crossref]
- Messner B, Bernhard D (2014) Smoking and cardiovascular disease: mechanisms of endothelial dysfunction and early atherogenesis. Arterioscler Thromb Vasc Biol 34: 509-515. [Crossref]
- CDC (Centers for Disease Control and Prevention), National Center for Chronic Disease Prevention and Health Promotion, Office on Smoking and Health. The health consequences of involuntary exposure to tobacco smoke: A report of the Surgeon General. Atlanta: CDC; 2006.
- Hanioka T, Nakamura E, Ojima M, Tanaka K, Aoyama H (2008) Dental caries in 3-year-old children and smoking status of parents. Paediatr Perinat Epidemiol 22: 546-550. [Crossref]
- Aligne CA, Moss ME, Auinger P, Weitzman M (2003) Association of pediatric dental caries with passive smoking. JAMA 289: 1258-1264. [Crossref]
- Wong LS, Green HM, Feugate JE, Yadav M, Nothnagel EA, et al. (2004) Effects of "second-hand" smoke on structure and function of fibroblasts, cells that are critical for tissue repair and remodeling. BMC Cell Biol 5: 13. [Crossref]
- Yuan H, Wong LS, Bhattacharya M, Ma C, Zafarani M, et al. (2007) The effects of second-hand smoke on biological processes important in atherogenesis. BMC Cardiovasc Disord 7: 1. [Crossref]
- HealthyPeople.gov Department of Health and Human Services.
- Satcher D. Department of Health and Human Services, Public Health Service, Rockville, MD. Oral Health in America: a report of the Surgeon General.
- Dye BA, Thornton-Evans G (2010) Trends in oral health by poverty status as measured by Healthy People 2010 objectives. Public Health Rep 125: 817-830. [Crossref]
- Soderlund K (2014) Dental spending remains flat-lined: HPRC research shows little change between 2011 and 2012. ADA News: 14.
- Bauman KJ, Graf NL. Educational Attainment 2000: Census 2000 Brief. 2003 U.S. Census Bureau, Department of Commerce.
- Educational Attainment in the United States: 2013-Detailed tables. U. S. Census Bureau, Department of Commerce.
- Sokolow JD, editor. Cigarette Smoking Among Adults-United States, 2001. 2003; 52: 953-956.
- Moolenaar RL, editor. Current Cigarette Smoking Among Adults—United States, 2011. MMWR.2012; 61: 889-890.
- The United States Facts American Lung Association. 2014.
- Dye BA, Morin NM, Robison V (2006) The relationship between cigarette smoking and perceived dental treatment needs in the United States, 1988-1994. J Am Dent Assoc 137: 224-234. [Crossref]
- NHANES, National Health and Nutrition Survey, Centers for Disease Control and Prevention.
- Bloom B, Adams PF, Cohen RA, Simile C (2012) Smoking and oral health in dentate adults aged 18-64. NCHS Data Brief: 1-8. [Crossref]
- Iida H, Kumar JV, Kopycka-Kedzierawski DT, Billings RJ (2009) Effect of tobacco smoke on the oral health of U.S. women of childbearing age. J Public Health Dent 69: 231-241. [Crossref]
- Drilea SK, Reid BC, Li CH, Hyman JJ, Manski RJ (2005) Dental visits among smoking and nonsmoking US adults in 2000. Am J Health Behav 29: 462-471. [Crossref]
- Mucci LA, Brooks DR (2001) Lower use of dental services among long term cigarette smokers. J Epidemiol Community Health 55: 389-393. [Crossref]
- Yeung LF, Coates RJ, Seeff L, Monroe JA, Lu MC, Boyle CA (2014) Conclusions and Future Directions for Periodic Reporting on the Use of Selected Clinical Preventive Services to Improve the Health of Infants, Children, and Adolescents - United States. MMWR Surveill Summ 63: 99-107.