Abstract
Dexamethasone (Dex) is frequently used for induction of cellular mineralization in vitro. However, the underlying mechanism of its influence on mineralization remains incompletely characterized. Nephronectin (Npnt), a novel RGD-containing matrix protein, was reported to promote osteoblast differentiation and mineralization, moreover, its mRNA expression was found to be up-regulated by bone morphogenetic protein 2 (BMP2) and 1α- 25-dihydroxyvitamin D3 in concentration- and time-dependent manner. The present work seeks to uncover the effect of Dex in the regulation of Npnt mRNA expression and possible signaling pathways that involved in the Dex-mediated mineralization. The results conclude that Dex promotes cellular mineralization in MDPC-23 cell in a dose-dependent manner via Akt/mTOR signaling pathway, simultaneously, it up-regulated Npnt mRNA expression during the differentiation process of MDPC-23 cell.
Correspondence
Key words
Dexamethasone, Nephronectin, MDPC-23 cell, Akt/mTOR
Introduction
Dexamethasone (Dex) is a type of synthetic glucocorticoid (GC) analogue, which exhibits intensive GC activity without showing any mineralocorticoid activity. Its GC activity is 30 times as potent as cortisol [1], the natural adrenal steroid secreted by adrenal cortex. Dex and other GCs are widely used in anti-inflammatory (eg. rheumatoid arthritis) and immunosuppressive treatments following organ transplant. However, the dosage should be carefully fine-tuned to avoid unwanted side effects, as long-term use of GCs often results in osteoporosis [2].
In the in vitro experiments, Dex in combination with β-glycerophosphate (β-GP) and ascorbic acid (AA) are frequently used for induction of osteogenic commitment and differentiation [3]. Stem cell (eg. bone marrow mesenchymal stem cell) [4] and certain mineralizing cell lines (eg. MC3T3-E1 cell) [5] are promising candidates for the approaches. Efforts have been ongoing in elucidating the underlying molecular mechanism of Dex-related effects on osteoblast differentiation. Yamanouchi et al. reported a concentration-dependent (10nM, 100nM, 1µM) effect of Dex on alkaline phosphatase activity in human osteoblast cell [6]. Ogata et al. examined osteoblastic cell lines (UMR 106-6 and ROS 17/2.8 cell) after exposure to a single dose of Dex (10nM). The researchers found that there was a significantly sixfold increase of bone sialoprotein (BSP) expression.
Further, they identified a GC response element in BSP gene promoter [7]. Aside from BSP, secretion of alkaline phosphatase (ALP) and osteocalcin (OCN) were augmented by the same dosage of Dex as well in another group’s study using human iliac trabecular bone cells [8]. More recently, a detailed characterization of the effects of Dex on long-term culture of mesenchymal stromal cells revealed that, the Dex exerts biphasic effect on cells.
In the early stage, transcription factors including Runx2 and osterix (Osx) are up-regulated to promote osteogenic differentiation, when the cells enter the late stage of culture, protein expression of GC receptors (GR) decreases in a time and dose dependent manner, leading to weakened or even frigid response of Runx2 and Osx to Dex stimulation; moreover, Dex also promotes the expression of an inhibitory protein histone deacetylase 6 (HDAC6) and forms a complex with GR, which further compromises the chance of Dex binding to GR [9].
Nephronectin (Npnt) was identified to stimulate the differentiation and mineralization of MDPC-23 cell when coated to polystyrene [10]. Further, over-expression of Npnt in MC3T3-E1 cell accelerates the mineralization process in vitro [11]. Recently, Kamijo’s group reported Npnt can be up-regulated upon exposure to both bone morphogenetic protein 2 (BMP-2) [12], a well-established osteogenic molecule [13], and 1α-25-dihydroxyvitamin D3 [14], an essential calcium homeostasis regulator [15,16]. These clues suggest Npnt is positively involved in the process of cellular differentiation toward hard tissue forming direction. Based on the above-noted evidences in relation to the osteogenic capacity of Dex, it is thus of particular interest to investigate whether Dex plays some role in regulation of Npnt expression. The purpose of current work was therefore to examine the Npnt expression after treatment by Dex and explore possible signaling pathway that is involved in Dex-mediated mineralization in MDPC-23 cell.
Materials and methods
Cell culture
MDPC-23 cell, an immortalized rat odontoblast-like precursor cell line originally isolated from molar papillae [17], was precultured until they reached confluence in dulbecco’s modified eagle’s medium (DMEM, high glucose) (D5796, Sigma) supplemented with 5% fetal bovine serum (FBS) (10270-106, Gibco) (herein referred to as culture media: CM) at 37°C in a humidified atmosphere of 5% CO2 in air. Cells were subsequently digested by phenol red containing trypsin (12605-010, Invitrogen) and seeded into 24-well plate (for alizarin red staining) (353047, Falcon) or 12-well plate (for RNA isolation) (3815-012, Iwaki) as appropriate. Cells were maintained in CM until confluence, thereafter water-soluble Dex (D-2915, Sigma) with a series of concentrations (0.01, 0.1, 1, 10, 100 nM in PBS) was added to cells in the presence or absence of ascorbic acid (AA) (50 µg/mL, Wako) or β-glycerophosphate (b-GP) (10 mM, Wako).
Quantitative real time polymerase chain reaction (PCR)
RNA was isolated using Trizol reagent (Invitrogen). First strand cDNA was synthesized from 1 µg of total RNA in a 20-µL reaction system. One microliter of cDNA solution was mixed in 19 µL of PCR buffer containing 10 µL FastStart Essential DNA Green Master (Roche), 7 µL PCR grade water (Roche), 1µL sense primer and 1 µL anti-sense primer (final concentration: 500 nM). Real time RT-PCR was performed using a LightCycler nano (Roche) machine under the following conditions (50 cycles): denaturation for 15s at 95°C, annealing for 30s at 59.9°C (Npnt) or 53°C (β-actin), extension for 30s (Npnt) or 40s (β- actin) at 72°C. Sense and anti-sense primer sequences were used as follows: Npnt (XM_008761543.1) (forward: ctcaaagctgtgtgccaacc, backward: ttgtggcttgatgatccggg, product size: 178bp), β-actin (NM_031144.3) (forward: aaccctaaggccaacagtgaaaag, backward: tcatgaggtagtctgtgaggt, product size: 241bp). mRNA expression levels were normalized by internal control β-actin.
Protein kinase B (PKB or Akt)/mechanistic target of rapamycin (mTOR) signaling pathway inhibition
MDPC-23 cells were seeded into 24-well plate (For mineralization assay) or 12-well plate (For gene expression analysis) (seeding density: 1×10⁴/mL), maintained in CM for four or five days. Afterwards, the cells were exposed to Akt inhibitor (600 nM, 6 µM, 60 µM, dissolved in DMSO) (14870, Cayman) or mTOR inhibitor (1 µM, 10 µM, 100 µM, dissolved in DMSO) (KU0063794, Wako) in DMEM (FBS free) for two hours; in control and Dex groups cells were treated by the DMSO vehicle only. Following inhibition, the media containing inhibitors or DMSO vehicle were aspirated and changed according to the purpose of experiment. For the mineralization test, Dex was added in conjunction with β-GP and AA in DMEM (5%FBS). For the gene expression experiment, Dex alone was added. As the vehicle for Dex, PBS was added into the control group.
Cell viability assay
MDPC-23 cells were seeded into 96-well plate (tissue culture treated polystyrene, 3860- 096, Iwaki) at the density of 1×10³/well in CM. At day three, cells were treated with various concentrations of Akt and mTOR inhibitors dissolved in DMEM in the absence of FBS for two hours in incubator. Subsequently, inhibitors containing media were aspirated and replaced with CM in the presence of Dex (100 nM) or PBS vehicle (Control). Cell Counting Kit-8 (CCK-8) reagent (10 µL/ well) (347-07621, Dojindo, Japan) was added the next day (day four) and the cells were incubated for another 1h and 45min, absorbance was read at the wavelength of 450nm.
Alizarin red staining
Cells were maintained in CM until confluence, afterwards, various concentrations of Dex (0.01, 0.1, 1, 10, 100 nM in PBS) were added to cells in the presence or absence of AA or β-GP (10 mM, Wako). Staining was conducted on day eight. Detailed description of staining and CPC extraction is given out elsewhere [10].
Statistical analysis
Results were presented as means ± SD, and the difference was assessed by post hoc Tukey HSD test. Statistical differences were determined based on the p value lower than 0.05.
Results and discussion
Alizarin red staining
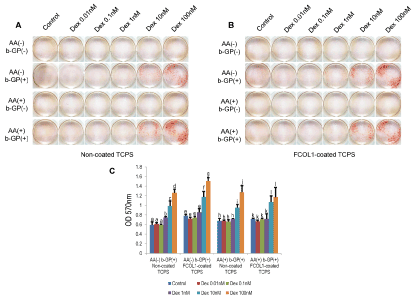
The alizarin red staining was used to identify the mineralization of MDPC-23 cell. Generally, cells start to mineralize after reaching confluence, the timing of adding Dex was accordingly selected at the day of cell achieving confluence. As Dex has dual roles on osteogenesis, the pharmacological concentration at 1 µM was inhibitory on alkaline phosphatase activity and mineralization of mesenchymal progenitor cells [18]. Therefore, to determine the optimum concentration of Dex in MDPC-23 cell, five different concentrations at the magnitude of nanomolar range were selected in the present experiment. To further testify whether the mineralization of cells could be enhanced synergistically by type I collagen, cells were seeded to non-coated tissue culture polystyrene or fish scale type I collagen (FCOL1)-coated polystyrene in the presence of osteogenic factors including AA, b-GP and Dex.
Type I collagen was an effective osteogenic factor [19]. Therefore, to investigate whether type I collagen could promote the mineralization of cells synergistically with Dex, cells were seeded into cultured plates coated with fish scale type I collagen (FCOL-1) or non- coated plates. The alizarin red staining, a method for evaluating calcific deposition in cells, revealed that, first, no mineralization was observed in groups without β-GP, highlighting β-GP is a pre-requisite for initiating mineralization. Indeed, as the source of phosphate for the formation of hydroxyapatite mineral (Ca10(PO4)6(OH)2) and inducer of osteogenic gene expression [20-22], β-GP is of critical importance to in vitro mineralization assay.
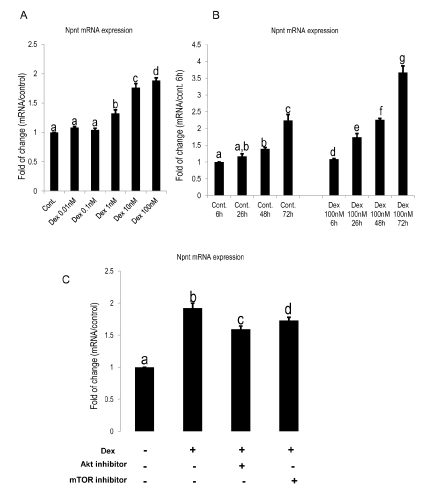
Nevertheless, one needs to be careful when interpreting the data, as acellular mineralization occurs when the cells are treated with β-GP at a concentration higher than 2.5 mM, and this could also be detected by alizarin red or von kossa staining [23]. In the current work, no mineralization was observed in cells treated by 10 mM β-GP in the absence of Dex or presence of Dex (0.01-0.1 nM), which indicated that although the concentration of β-GP was much higher than the threshold of acellular mineralization, the cells did not mineralize in groups without or with low concentration of Dex (0.01-0.1 nM). In groups without β-GP, cells did not mineralize even in the presence of the optimum concentration (100 nM) of Dex, indicating β-GP and Dex are mutually indispensable for eliciting early mineralization. Second, the staining intensity was in proportion to the concentration of Dex used, in other words, the mineralization adopts a concentration-dependent increase upon exposure to Dex. Based on the quantification data, it was suggested that a concentration of 100nM exhibited the strongest staining in the three groups (Figure 1A AA+ β-GP+ non-coated; Figure 1B AA- β- GP+ type I collagencoated; Figure 1A AA- β-GP+ non-coated), although the absolute value of absorbance in AA+ β-GP+ type I collagen-coated Dex (100 nM) was higher than Dex (10 nM), the difference (p>0.05) was not of statistical significance as analyzed by Tukey’s test. Interestingly, the quantification result of alizarin red staining ( Figure 1C) indicated a coating of FCOL1 does not exert remarkable synergistic effect with Dex in enhancing mineralization. However, in our previous work, FCOL1 was found to contribute to nearly two-fold enhancement of MDPC23 cell mineralization at day ten in osteogenic media containing AA and β-GP [19], but without Dex. A possible explanation may be that Dex was such a potent accelerator of mineralization that the potential long term effect of FCOL1 in promoting mineralization was yet to be detected as early as day eight. The present study showing the optimum concentration (100 nM) for Dex correlates well with a previous work demonstrating that 10-7/mL of Dex exerted the maximal effect on alkaline phosphatase activity in chick periostea cells [24]. Next, we demonstrated that Dex-induced stimulation of mineralization was accompanied by a concomitant dose- and time-dependent induction of Npnt (Figure 2 A&B), an adhesive matrix protein and strong promoter of osteo/odontogenic differentiation [10,11].

Figure 1: Mineralization of MDPC-23 initiated by Dex.
A: Cells were seeded into non-coated 24-well plate (tissue culture treated polystyrene, TCPS, Iwaki) at the concentration of 1×10⁴/well (culture media: 1mL/well) in CM. At day five, the experiment was divided into four separate groups, the combination of osteogenic factors (b-GP and AA) is shown in the figure. Various concentrations of Dex were added to each specific combinational group of β-GP and AA. Alizarin red staining was conducted at day eight.
B: The 24-well plates (TCPS, Iwaki) were pre-coated with fish scale type I collagen (coating concentration: 300µg/mL; coating volume: 200µL/well) (Cell campus, AQ-03LE, Taki chemical) (FCOL1-coated). MDPC-23 cells were inoculated in the same manner as described in (A). Alizarin red staining was conducted at the same day as (A).
C: Quantification of alizarin red staining for the groups which displayed apparent mineralization (non-coated TCPS: AA- β-GP+; AA+ β-GP+; FCOL1-coated: AA- β-GP+; AA+ β-GP+). Different symbols within each group represent significant differences, p<0.01 except for p<0.05 between Control and Dex 1nM in AA- β-GP+ Non-coated TCPS group, post hoc Tukey HSD test, n=4.

Figure 2: Dex augmented the mRNA expression of Npnt in dose and time-dependent manner.
A: Dose-dependent increase effect of Dex on expression of Npnt mRNA in MDPC-23 cells treated by 0.01, 0.1, 1, 10, 100nM for 48h. At concentrations lower or equal to 0.1nM, no differences were detected. At higher concentrations, Npnt mRNA was significantly promoted by Dex. Values are shown as mean±SD. Different symbols represent significant differences, p<0.01 except for p<0.05 between Dex 10nM group and Dex 100nM group (post hoc Tukey HSD test, n=3).
B: Time-dependent effects of Dex on mRNA expression of Npnt. After reaching confluence, cells were treated with 100nM of Dex, then harvested at 6h, 26h, 48h, and 72h. Different symbols represent significant differences in each section (Cont. 6h 26h 48h 72h; Dex 100nM 6h 26h 48h 72h), p<0.01 by post hoc Tukey HSD test (n=3).
C: The Akt and mTOR inhibitors attenuated Npnt mRNA expression. Preceded to Dex (100nM) treatment, cells were exposed to Akt (60nM) or mTOR (100nM) inhibitors for 2h. Real time RT-PCR was performed at day three after addition of Dex. Different symbols represent significant differences, p<0.01 except for p<0.05 between the third group and fourth group (post hoc Tukey HSD test, n=3).
Up-regulation of Npnt stimulated by Dex and the effect of Akt/mTOR inhibition on Npnt expression
Subsequently, since Akt/mTOR signaling pathway is essential in osteo/odontoblast differentiation and bone mass determination [2527]. We used Akt/mTOR inhibitors to elucidate the mechanism by which Dex regulates the Npnt expression in MDPC-23 cells. Figure 2C revealed up-regulation of Npnt was slightly inhibited by the Akt/ mTOR inhibitors, indicating other signaling pathways are involved in the regulation of its expression by Dex. Indeed, the ALK/SMAD4 [12] and Wnt/β-catenin [28] signaling pathways were noted to play major roles in the up-regulation of Npnt in an osteoblast-like cell. Whether these two signaling pathways identified elsewhere also affect the Dexmediated up-regulation of Npnt in MDPC-23 cell, requires further scrutinization.
The effects of Akt/mTOR inhibition on cell viability and mineralization
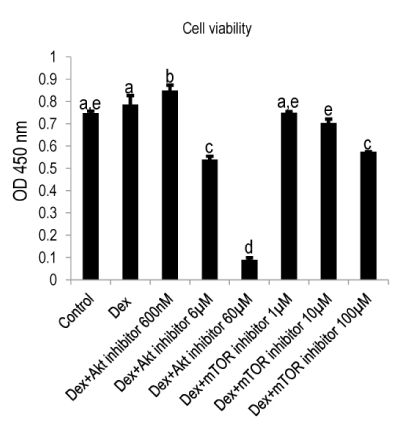
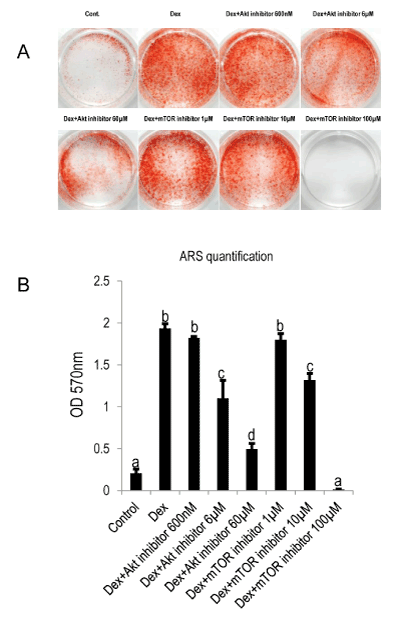
In contrast, we noted that the inhibition of Akt and mTOR significantly impaired the viability ( Figure 3), remarkably, 60 µM Akt inhibitor abrogated the viability to nearly zero; mTOR at its highest concentration (100 µM) exhibited but mild attenuation. The mineralization of MDPC-23 cell activated by Dex was impaired in a concentration-dependent manner by Akt/mTOR inhibition (Figure 4), specifically, a concentration of 6 µM and 60 µM of Akt inhibitor decreased the mineralization by 43% and 74%, respectively.

Figure 3:
Cell viability was abrogated by Akt and mTOR inhibitors. MDPC-23 cells were plated at a cell density of 1×10³/well and cultured until day three. Thereafter, the cells were treated with various concentrations of Akt inhibitor (600nM, 6µM, 60µM) and mTOR inhibitor (1µM, 10µM, 100µM) for 2hrs. The cell viability was analyzed using CCK-8 kit. A concentration-dependent decrease of cell viability was detected, especially, Akt inhibitor at the concentration of 60µM was found to be remarkably impair the cell survival. Different symbols represent significant differences, p<0.01 (except for the p value between Dex and Dex+Akt inhibitor 600nM, which was lower than 0.05) by post hoc Tukey HSD test (n=3).

Figure 4: Akt/mTOR is involved in Dex-mediated mineralization of MDPC-23 cells.
A: Cells were plated at the concentration of 1×10⁴/well in 24-well plate (TCPS). Inhibitors were added at day five and incubated for 2h. Thereafter, the inhibitors containing media were discarded and replaced by mineralization reagents including β-GP, AA and Dex (100nM). Staining was carried out at day eight of culture.
B: Quantification of alizarin red staining. Different symbols represent significant differences, p<0.01 (except for the p value between Control and Dex+Akt inhibitor 60µM, which was lower than 0.05) by post hoc Tukey HSD test (n=3).
Similarly, in the groups treated by mTOR inhibitor, the initial concentration of 1 µM did not appear to affect the mineralization, when the concentration was increase to 10µM, the mineralization was abrogated by 32%. Importantly, 100 µM of mTOR inhibitor completely blocked the mineralization while it only moderately hampers the viability of cells. Taken together, the results verified that Dex stimulates mineralization and simultaneously induces the expression of Npnt mRNA. The blocking of Akt/mTOR signaling pathway significantly attenuates the mineralization of MDPC-23 cell treated by Dex, albeit only slightly down-regulated Npnt expression.
Acknowledgments
The work was supported by Grants-in-Aid for scientific research from the Japan Society for the Promotion of Science (No. 15H05024).
Conflict of interest
None to declare.
References
- Hall JE, “Guyton and Hall Textbook of Medical Physiology,” 12th ed, Unit XIV, pp. 924, 2009.
- Walsh S, Jordan GR, Jefferiss C, Stewart K, Beresford JN (2001) “High concentrations of dexamethasone suppress the proliferation but not the differentiation or further maturation of human osteoblast precursors in vitro: relevance to glucocorticoidinduced osteoporosis,” Rheumatology (Oxford)., 40, 74-83.. [Crossref]
- Yuasa M, Yamada T, Taniyama T, Masaoka T, Wei XT et al (2015), “Dexamethasone enhances osteogenic differentiation of bone marrow- and muscle-derived stromal cells and augments ectopic bone formation induced by bone morphogenetic protein-2,” PLoS One. 10, e0116462. [Crossref]
- Akahane M, Shimizu T, Kira T, Onishi T, Uchihara Y et al (2016) Culturing bone marrow cells with dexamethasone and ascorbic acid improves osteogenic cell sheet structure. Bone Joint Res, 5, 569-576. [Crossref]
- Yan XZ, Yang W, Yang F, Kersten-Niessen M, Jansen JA et al (2014) Effects of continuous passaging on mineralization of MC3T3-E1 cells with improved osteogenic culture protocol. Tissue Eng Part C Methods 20: 198-204. [Crossref]
- Yamanouchi K, Gotoh2021 Copyright OAT. All rights reservasone enhances differentiation of human osteoblastic cells in vitro,” J Bone Miner Metab15, 23-29.
- Ogata Y, Yamauchi M, Kim RH, Li JJ, Freedman LP (1995) “Glucocorticoid regulation of bone sialoprotein (BSP) gene expression: identification of a glucocorticoid response element in the bone sialoprotein gene promoter,” Eur J Biochem, 230, 183-90. [Crossref]
- Yang L, Tao T, Wang X, Du N, Chen W et al (2003) Effects of dexamethasone on proliferation, differentiation and apoptosis of adult human osteoblasts in vitro. Chin Med J (Engl) 116: 1357-1360. [Crossref]
- Rimando MG, Wu HH, Liu YA, Lee CW, Kuo SW et al (2016) “Glucocorticoid receptor and histone deacetylase 6 mediate the differential effect of dexamethasone during osteogenesis of mesenchymal stromal cells (MSCs),” Sci Rep., 6, Article number 37371. [Crossref]
- Tang J, Saito T (2017) Nephronectin Stimulates the Differentiation of MDPC-23 Cells into an Odontoblast-like Phenotype. J Endod 43: 263-271. [crossref]
- Kahai S, Lee SC, Seth A, Yang BB (2010) “Nephronectin promotes osteoblast differentiation via the epidermal growth factor-like repeats,” FEBS Letters, 584, 233238. [Crossref]
- Kurosawa T, Yamada A, Suzuki D, Morimura N, Sasagane Y et al (2016) “Nephronectin expression is up-regulated by BMP-2,” Biol Pharm Bull, 39, 1211-1215. [Crossref]
- Chen GQ, Deng CX, Li YP (2012) “TGF-ß and BMP signaling in osteoblast differentiation and bone formation,” Int J Biol Sci, 8, 272-288.
- Hiranuma K, Yamada A, Kurosawa T, Aizawa R, Suzuki D et al (2016) Expression of nephronectin is enhanced by 1α,25-dihydroxyvitamin D3. FEBS Open Bio 6: 914-918. [Crossref]
- Deluca HF (1988) “The vitamin D story: a collaborative effort of basic science and clinical medicine,” The FASEB Journal, 2, 224-236. [Crossref]
- Woeckel VJ, van der Eerden BC, Schreuders-Koedam M, Eijken M, Van Leeuwen JP (2013) “1a-25-dihydroxyvitamin D3 stimulates activing A production to fine-tube osteoblast- induced mineralization,” J Cell Physiol, 228, 2167-74. Hanks CT, Fang D, Sun Z, Edwards CA, Butler WT (1998) Dentin-specific proteins in MDPC-23 cell line. Eur J Oral Sci 106 Suppl 1: 260-266. [Crossref]
- Hanks CT, Fang D, Sun Z, Edwards CA, Butler WT (1998) Dentin-specific proteins in MDPC-23 cell line. Eur J Oral Sci 106 Suppl 1: 260-266. [Crossref]
- Jin S, Xu XY, Li GS, Zhang W, Qi J et al (2009) “Inhibitory effects of pharmacological doses of dexamethasone on mineralization of mesenchymal progenitor cells in vitro,” Pharmazie, 64, 674-679. [Crossref]
- Tang J, Saito T (2015) “Biocompatiblity of novel type I collagen purified from tilapia fish scale: an in vitro comparative study,” Biomed Res Int, 2015, Article ID 139476, 2015. [Crossref]
- Foster BL, Nociti FH Jr, Swanson Ec, Matsa-Dunn D, Berry JE et al (2006) Somerman MJ, “Regulation of cementoblast gene expression by inorganic phosphate in vitro,” Calcif Tissue Int, 78, 103-112.
- Fatherazi S, Matsa-Dunn D, Foster BL, Rutherford RB, Somerman MJ, et al. (2009) Phosphate regulates osteopontin gene transcription. J Dent Res 88: 39-44. [Crossref]
- Tada H, Nemoto E, Foster BL, Somerman MJ, Shimauchi H (2011) “Phosphate increases bone morphogenetic protein-2 expression through cAMP-dependent protein kinase and ERK1/2 pathways in human dental pulp cells,” Bone, 48, 1409-1416. [Crossref]
- Bonewald LF, Harris SE, Rosser J, Dallas MR, Dallas SL et al (2003) “Von Kossa staining alone is not sufficient to confirm that mineralization in vitro represents bone formation,” Calcif Tissue Int, 72, 537-547.
- Tenenbaum HC, Heersche JNM (1985) “Dexamethasone stimulates osteogenesis in chick periosteum in vitro,” Endocrinology, 117, 2211-2217. [Crossref]
- Eapen A, George A (2015) “Dentin phosphophoryn in the matrix activates AKT and mTOR signaling pathway to promote preodontoblast survival and differentiation,” Front Physiol, 6, 221. [Crossref]
- Mukherjee A1, Rotwein P (2009) Akt promotes BMP2-mediated osteoblast differentiation and bone development. J Cell Sci 122: 716-726. [Crossref]
- Xian L, Wu X, Pang L, Lou M, Rosen CJ et al (2012) Matrix IGF-1 maintains bone mass by activation of mTOR in mesenchymal stem cells. Nat Med 18: 1095-1101. [crossref]
- Ikehata M, Yamada A, Morimura N, Itose M, Suzawa T et al (2017) “Wnt/ß-catenin signaling activates nephronectin expression in osteoblasts,” Biochem Biophys Res Commun 2: 231-234


