We previously reported the direct reprogramming of dental pulp cells to insulin-producing cells. Hence, the potential for transdifferentiation of dental pulp cells to cells of a developmentally unrelated lineage was verified. In the current study, we evaluated the multipotential plasticity of cells during the reprogramming process by examining the expression of the pluripotent stem cell markers Oct3/4, Sox2, and Nanog. The expression of Oct3/4 was markedly induced approximately 5-fold at 10 days after induction, while Sox2 levels decreased by approximately 25% of those observed in pre-induction cells, suggesting that the cells might have acquired pluripotency as a consequence of direct reprogramming. In conclusion, the induction and ectopic expression of transcriptional factors in dental pulp cells during direct reprogramming is a result of the activation of Oct3/4.
dental pulp, differentiation, direct reprogramming, Oct3/4
We previously reported that dental pulp cells are able to be directly reprogrammed to insulin-producing cells. This reprogramming was proposed to be regulated by miRNAs [1]. We further proposed that dental pulp cells possess the necessary characteristics of multipotential plasticity in the terminal state of differentiation. The multipotency of the cells may contribute to the appearance of transdifferentiation to the developmentally unrelated lineage. We have also shown that dental pulp cells can differentiate into osteogenic, neurogenic, myogenic, and adipogenic cells by applying in vitro induction conditions similar to those used for human bone marrow cells [2-5]. Stem cell markers such as STRO-1, SSEA-1, Nanog, and Oct3/4 were slightly expressed in rat dental pulp cells [2], and the down-regulation of these markers was observed during lineage differentiation [5]. Several genetic markers for pluripotent stem cells have been identified, including Nanog, Sox2, and Oct3/4 (also known as Pou5f1) [6,7]. Induced, pluripotent stem (iPS) cells are transformed into fibroblasts by four defined genes, including Sox2 and Oct3/4 [8]. We hypothesized that the pluripotent state is manifest during the direct reprogramming of dental pulp cells and to address this question, we examined the expression of pluripotent stem cell markers during the process.
Cell culture
Five-week old, male Wistar rats were used in this study (SHIMIZU Laboratory Supply, Kyoto, Japan). Primary culture was performed as previously described [4]. Briefly, the pulp tissue of the incisors was gently separated using reamers (25 mm #10; Morita Corporation, Osaka, Japan) away from the distal site of the molars to excise the apical bud, approaching from the central side of the mandible. The tissue was then minced and incubated in phosphate-buffered saline containing 3 mg/mL type I collagenase (Invitrogen, Carlsbad, CA, USA) and 4 mg/mL dispase (Invitrogen) for 50 min at 37°C. The cells were cultured in a basic medium of MF start (TOYOBO, Osaka, Japan) supplemented with 10% (v/v) fetal calf serum (FCS; Invitrogen) at 37°C in a humidified atmosphere containing 5% CO2. Animal experiments were carried out in accordance with the Osaka Dental University guidelines for the care and use of laboratory animals.
RNA extraction
Total RNA was isolated from the cells by acid guanidinium thiocyanate-phenol-chloroform extraction with Isogen (Nippon Gene Co. Ltd., Tokyo, Japan) in accordance with the manufacturer’s instructions. Cells were homogenized in Isogen (5 × 10⁶ cells/mL of Isogen) followed by extraction with 200 µL of chloroform and a further 650 µL of chloroform, precipitation with 1 mL of isopropanol, and washing of the precipitated RNA with 1 mL of 70% ethanol. All centrifugations were performed at 12,000 g at 4°C. The RNA obtained was dissolved in UltraPureTM DNase/RNase-free distilled water (Life Technologies, Carlsbad, CA, USA), and its concentration was measured by a NanoDrop (Thermo Fisher Scientific Inc., Waltham, MA, USA) at 260 nm.
RT-PCR
First-strand cDNAs were synthesized from total RNA derived by a High Capacity cDNA Reverse Transcription Kit (Applied Biosystems, Foster City, CA, USA) in accordance with the manufacturer’s instructions. PCR amplification was performed using Ex Taq (Takara Bio Inc., Ohtsu, Japan) using the cDNA as a template. The specific PCR primer sets were designed using the Perfect Real Time Support System (Takara Bio Inc.). PCR amplification was performed with an initial incubation at 94°C for 3 min, followed by 30 cycles at 98°C for 10 s, 61°C for 30 s, and 72°C for 30 s for Ngn3; 35 cycles at 98°C for 10 s, 60°C for 30 s, and 72°C for 30 s for Ins1 and Ins2; and ultimately a final extension step at 72°C for 5 min. The products were electrophoresed on 15% (w/v) acrylamide gel and stained with ethidium bromide. The intensity of amplified bands was calculated by ImageJ software (https://imagej.nih.gov/ij/). Rps18 was used as an internal control to correct for differences among the samples.
Induction procedure
The procedure for direct reprogramming of dental pulp cells to insulin-producing cells was previously described [1]. Briefly, the rat dental pulp cells were inoculated into basic medium for 2 days. To induce the conversion to an endocrine cell lineage, the cells were initially transfected with the expression vector for Pdx1 on day 1, followed by cotransfection of the Pdx1 and Ngn3 expression vectors on days 4, 7, and 10. The transfections were carried out using the FuGENE HD Transfection Reagent (Roche Diagnostics, Indianapolis, IN, USA) in accordance with the manufacturer’s instructions.
Quantitative real-time RT-PCR
Specific PCR primer sets were designed using the Perfect Real Time Support System (Takara Bio Inc.). Real-time RT-PCR was performed using Fast SYBR Green PCR Master Mix (Applied Biosystems) to examine the expression levels of each marker. PCR amplification was performed using a StepOne PlusTM System (Applied Biosystems) with an initial denaturation step of 20 s at 95°C, followed by 40 cycles each of 95°C for 3 s and 60°C for 30 s, and concluded with an automatic melting curve stage. Rps18 was used as an internal control to correct the quantitative analysis. The expression levels are presented as the fold-change after induction compared to pre-induction values and were calculated using the ∆∆Ct method. Differences were statistically analyzed with the Mann-Whitney U test using SPSS software.
Expression of endogenous genes after ectopic expression of Pdx1
Following transfection of Pdx1, the expression level of endogenous Ngn3 was transiently increased 1.8-fold at 4 days after induction (Figures 1a and 1b). In contrast, expression of endogenous Insulin (Ins1 and Ins2) was increased 2.3-fold and 1.9-fold, respectively, at 4 days, and induced levels were maintained from 4 to 10 days after induction (Figures 1a and 1b).
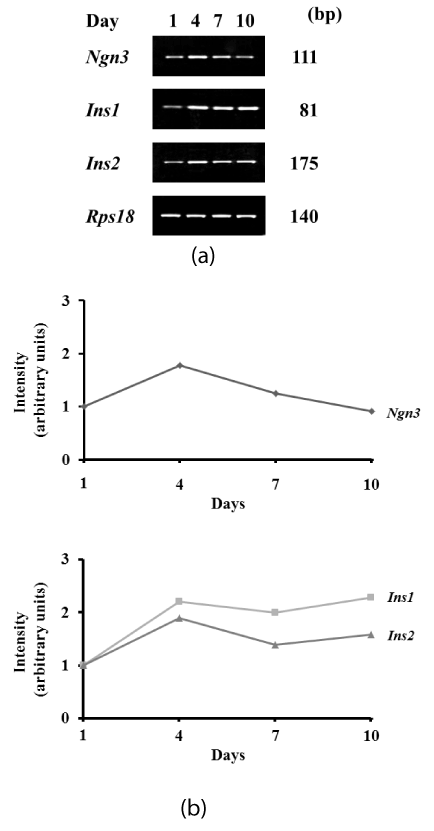
Figure 1. Expression of transcription markers associated with the endocrine lineage after induction. Expression was determined by RT-PCR. (a) Pre-induction (day 1) and days 4, 7, and 10 after transfection of Pdx1. Endogenous Ngn3, Ins1, and Ins2 are shown. (b) Intensity of targeted bands was calculated using ImageJ software.
Endocrine lineage markers after induction
The expressions of Neurod1 and Pax4 were significantly increased more than 4-fold and 3-fold, respectively (p<0.05). The expression of the specific marker for pancreatic beta cells, MafA, was also significantly increased approximately 2-fold after induction (p<0.05) (Figure 2).
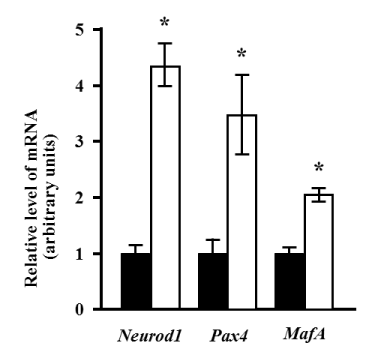
Figure 2. Changes in the expression of endocrine lineage markers after induction. Quantitative analysis was performed using real-time RT-PCR. The expression levels of Neurod1, Pax4, and MafA mRNA relative to the reference gene (Rps18), before (black bars), and 10 days after induction (white bars) are presented. The relative levels of mRNA expression are presented as the fold change after induction. Values represent the mean of four assay results for each sample. Values were calculated using relative quantity (RQ) study software (Applied Biosystems) and represent the statistical variability in the calculations of each sample’s RQ value. The RQmin/RQmax values are graphically represented as error bars. The asterisk denotes a statistically significant difference (p<0.05).
Change in expression of stem cell markers after induction
Notably, 10 days after induction, the expression of Oct3/4 was significantly increased approximately 5-fold (p<0.05). Sox2 levels significantly decreased by approximately 25% of those observed pre-induction (p<0.05). In contrast, the Nanog level did not change after induction (Figure 3).
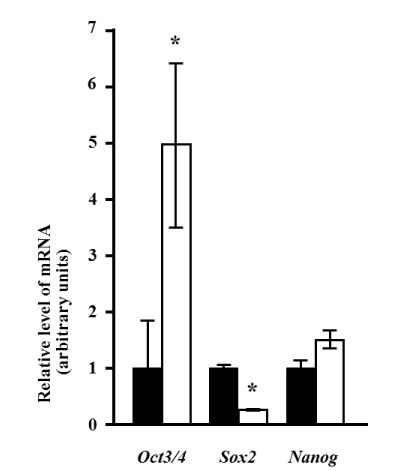
Figure 3. Changes in the expression of stem cell markers after induction. Quantitative analysis was performed using real-time RT-PCR. The expression levels of Oct3/4, Sox2, and Nanog mRNA relative to the reference gene (Rps18) are presented before (black bars) and 10 days after (white bars) induction. The relative level of mRNA expression is presented as the fold-change after induction. Values represent the mean of four assay results for each sample. Values were calculated using relative quantity (RQ) study software (Applied Biosystems) and represent the statistical variability in the calculations of each sample’s RQ value. The asterisk denotes a statistically significant difference (p<0.05).
Organogenesis in higher organisms, initiated by extracellular signals, occurs by the systematic differentiation of stem or progenitor cells into mature cells. This is regulated by gene expression, which is determined by specific transcription factors that direct cell differentiation into a particular lineage. Since the expression of Pdx1 is observed at the stage of pancreatic bud formation, activation of Pdx1 is thought to be an important first step in the differentiation of the pancreas. There is a relatively wide range of Pdx1-positive regions in the endoderm, and Pdx1 is essential for the proliferation and differentiation of the most immature pancreatic progenitor cells [9]. It is notably expressed in insulin-producing cells after passing through an Ngn3-positive stage, and is, subsequently, maintained at a high level of expression in mature β cells [9]. Ngn3, a bHLH-type transcription factor, is considered to be the most important transcription factor that distinguishes pancreatic endocrine progenitor cells from pancreatic progenitor cells [10]. In this study, when Pdx1 was ectopically expressed in dental pulp cells, expression of endogenous Ngn3 was transiently expressed at day 4 after induction. In contrast, the expression of Ins1 and Ins2 increased at day 4 after induction, and maintained relatively high expression until gradually declining by day 10 after induction. Interestingly, this sequence of gene expression seems to reproduce the changes in gene expression that take place during organogenesis of the pancreas. By investigating the expression of endogenous, defined transcription factors triggered by the gene transfer of transcription factors, we predicted that the introduction of Pdx1 and Ngn3 into dental pulp cells might induce differentiation to the endocrine lineage. In fact, we reported that reprogramming of dental pulp cells by introducing the specific transcription factors Pdx1 and Ngn3 could successfully induce differentiation to insulin-producing cells [1]. In this study, the same experimental system was used. In the course of reprogramming of the dental pulp cells, the expression of MafA increased by approximately 2-fold. When Pdx1, Ngn3, and the endocrine cell marker MafA are introduced into undifferentiated pancreatic progenitor cells or pancreatic exocrine cells, β cells can be induced. Hence, three transcription factors can induce reprogramming to β cells [11,12]. The observation in this study implies that these three transcription factors work cooperatively to bring about endocrine cell differentiation.
During differentiation to the endocrine lineage, Neurod1 and Pax4 are sequentially activated in pancreatic progenitor cells and, subsequently, MafA activation is an indication of pancreatic β-cell differentiation. In the current study, the expressions of Neurod1, Pax4, and MafA were elevated. We previously reported the induction of insulin using this experimental procedure. Taken together, MafA activation is thought to contribute to the conversion of dental pulp cells into pancreatic β cells. Ectopic expression of Pdx1 induces the direct reprogramming of human keratinocytes to pancreatic insulin-producing cells [12]. Direct reprogramming of mouse fibroblasts to hepatocyte-like cells by defined factors was also reported [13,14].
Although we previously demonstrated that ectopic expression of Pdx1 and Ngn3 induces the direct reprogramming of dental pulp cells to insulin-producing cells [1], it has not been shown whether the mechanisms of pluripotency are involved in the direct reprogramming process. The changes in expression of pluripotent stem cell markers Oct3/4, Sox2, and Nanog following induction of dental pulp cells were examined in this work in order to test the hypothesis of pluripotent state involvement. Oct3/4 is considered an essential component in all reprograming procedures and activation of endogenous Oct3/4 is a crucial step to obtain fully reprogrammed cells [13,14]. The main function of Sox2 in maintaining pluripotency is by controlling the expression of transcription factors such as Nr5a2 that indirectly causes a decrease in the expression of the Oct3/4 gene [6,15]. Sox2 is not, however, required for activating the Oct-Sox enhancer, which can be controlled by Oct3/4 alone [16]. The Oct-Sox enhancer-dependent genes include Nanog, Fgf4, and Fbx15. Nanog has an Oct-Sox enhancer region, and its expression is controlled by Oct3/4. Nanog is known as a pluripotent factor but because it is not expressed in pluripotent P19EC stem cells and mature gonads like Oct3/4 and Sox2, the contribution of Nanog to the pluripotency maintenance mechanism is dispensable [7,17]. In transcription factor-induced molecular reprogramming, Nanog is initially dispensable but becomes essential for dedifferentiated intermediate states to transit to ground state pluripotency [18]. In this study, the expression of Oct3/4 by induction increased by approximately 5-fold while the expression of Sox2 was decreased, but it is probable that the decrease in Sox2 was caused indirectly by the induced expression of Oct3/4.
To summarize, the direct reprogramming of dental pulp cells to endocrine lineage cells led to an increased expression of Oct3/4, a pluripotent stem cell marker. This suggests that, during differentiation to genealogically distinct cells, pluripotency factors are induced at the genetic level, and that cell plasticity is a consequence. Thus, the multiplasticity of dental pulp may arise as a result of the induction of pluripotent stem cell genes. Consequently, the acquisition of plasticity by dental pulp cells will make them attractive and promising materials for multiple regenerative medical applications. The present study has provided the evidence needed to expand the number of potential cell sources suitable for regenerative medicine applications.
Acknowledgments
This study was performed, in part, at the Institute of Dental Research, Osaka Dental University.
Funding information
This study was supported, in part, by a Grant-in-Aid for Scientific Research (21592547, 24593020, 15K11283) from the Japan Society for the Promotion of Science (T. Nozaki).
Competing interests
The authors have declared that no conflict of interest.
- Nozaki T, Ohura K (2014) Regulation of miRNA during direct reprogramming of dental pulp cells to insulin-producing cells. Biochem Biophys Res Commun 444: 195-198. [Crossref]
- Nozaki T, Takeyasu T, Hirao A, Shinohara M, Daito M, et al. (2005) Differentiation of rat dental pulp-derived cells into an osteoblastic lineage. Oral Sci Int 2: 118-125.
- Takeyasu M, Nozaki T, Daito M (2006) Differentiation of dental pulp stem cells into a neural lineage. Pediatric Dent J 16: 154-162.
- Nakatsuka R, Nozaki T, Uemura Y, Matsuoka Y, Sasaki Y, et al. (2010) 5-Aza-2'-deoxycytidine treatment induces skeletal myogenic differentiation of mouse dental pulp stem cells. Arch Oral Biol 55: 350-357. [Crossref]
- Nozaki T, Ohura K (2011) Gene expression profile of dental pulp cells during differentiation into an adipocyte lineage. J Pharmacol Sci 115: 354-363. [Crossref]
- Mitsui K, Tokuzawa Y, Itoh H, Segawa K, Murakami M, et al. (2003) The homeoprotein Nanog is required for maintenance of pluripotency in mouse epiblast and ES cells. Cell 113: 631-642. [Crossref]
- Chambers I, Colby D, Robertson M, Nichols J, Lee S, et al. (2003) Functional expression cloning of Nanog, a pluripotency sustaining factor in embryonic stem cells. Cell 113: 643-655. [Crossref]
- Takahashi K, Yamanaka S (2006) Induction of pluripotent stem cells from mouse embryonic and adult fibroblast cultures by defined factors. Cell 126: 663-676. [Crossref]
- Kawaguchi Y, Cooper B, Gannon M, Ray M, MacDonald RJ, et al. (2002) The role of the transcriptional regulator Ptf1a in converting intestinal to pancreatic progenitors. Nat Genet 32: 128-134. [Crossref]
- Gradwohl G, Dierich A, LeMeur M, Guillemot F (2000) Neurogenin3 is required for the development of the four endocrine cell lineages of the pancreas. Proc Natl Acad Sci U S A 97: 1607-1611. [Crossref]
- Zhou Q, Brown J, Kanarek A, Rajagopal J, Melton DA (2008) In vivo reprogramming of adult pancreatic exocrine cells to beta-cells. Nature 455: 627-632. [Crossref]
- Mauda-Havakuk M, Litichever N, Chernichovski E, Nakar O, Winkler E, et al. (2011) Ectopic PDX-1 expression directly reprograms human keratinocytes along pancreatic insulin-producing cells fate. PLoS One 6: e26298. [Crossref]
- Okamoto K, Okazawa H, Okuda A, Sakai M, Muramatsu M, et al. (1990) A novel octamer binding transcription factor is differentially expressed in mouse embryonic cells. Cell 60: 461-472. [Crossref]
- Polo JM, Anderssen E, Walsh RM, Schwarz BA, Nefzger CM, et al. (2012) A molecular roadmap of reprogramming somatic cells into iPS cells. Cell 151: 1617-1632. [Crossref]
- Niwa H, Toyooka Y, Shimosato D, Strumpf D, Takahashi K, et al. (2005) Interaction between Oct3/4 and Cdx2 determines trophectoderm differentiation. Cell 123: 917-929. [Crossref]
- Ivanova N, Dobrin R, Lu R, Kotenko I, Levorse J, et al. (2006) Dissecting self-renewal in stem cells with RNA interference. Nature 442: 533-538. [Crossref]
- Maruyama M, Ichisaka T, Nakagawa M, Yamanaka S (2005) Differential roles for Sox15 and Sox2 in transcriptional control in mouse embryonic stem cells. J Biol Chem 280: 24371-24379. [Crossref]
- Silva J, Nichols J, Theunissen TW, Guo G, van Oosten AL, et al. (2009) Nanog is the gateway to the pluripotent ground state. Cell 138: 722-737. [Crossref]