Abstract
The purpose of this study was to investigate anthropometric factors for the patients with Type 2 Diabetes Mellitus (T2DM). Subjects were 80 T2DM patients with 67.7 ± 12.9 years old. Methods included basal blood test including HbA1c and measured height, body weight, waist circumference (WC) and thigh circumference (TC). Several factors were calculated and investigated the correlation among Body Mass Index (BMI), HbA1c. WC, TC, Waist to Height ratio (WHtR), Thigh to Height ratio (THtR) and Thigh to Waist ratio (TWaR). Results were as follows: 1) Average BMI was 25.1 kg/m2 and average HbA1c was 7.2%, 2). There was significant correlation between WC and TC (p<0.01). 3) Significant correlations were revealed between BMI and WC, WHtR, THtR. 4)Similarly, between HbA1c and WC and WHtR. 5) Negative significant correlation was shown between HbA1c and TWaR with the Coefficient -0.25 and p=0.26. WC and TC might indicate central adiposity and muscle volume, respectively, suggesting that TWaR could become the fundamental data and the possible utilization of TWaR on the clinical research in the future.
Key words
waist circumference, waist-to-height ratio thigh-to-waist ratio, type 2 diabetes mellitus
Abbreviation: WC: Waist Circumference; WHtR: Waist-To-Height Ratio; TWaR: Thigh-To-Waist Ratio; T2DM: Type 2 Diabetes Mellitus; WHR: Waist-Hip Ratio; BMI: Body Mass Index; BAI: Body Adiposity Index; AI: atherogenic index; CVA: Cerebral Vascular Accident; CVD: Cardiovascular Disease; PVD: Peripheral Vascular Disease; RCT: Randomized Controlled Trial
Introduction
Metabolic Syndrome (Met-S) has been the serious health problem for long years, and central adiposity do exist for the fundamental cause. The prevalence of obesity has been increasing worldwide and also in Japan [1-4]. The excess adiposity would induce cardiovascular disease (CVD), then simple and effective way of estimating adiposity is necessary for risk assessment [5,6].
Body Mass Index (BMI) has been widely used for clinical research, but it has several problems for definition, age, gender and ethnicity [1,6,7]. Consequently, other measurements such as waist circumference (WC), waist-to-height ratio (WHtR) have been proposed for abdominal imaging and risk factors [6,8,9]. There have been still controversy about the predominance [10,11], and WHtR could be an alternative to WC, due to evaluating risk for tall and short individuals [12-14].
Authors and colleagues have treated thousands of patients with T2DM, investigated clinical studies concerning low carbohydrate diet (LCD) and developed LCD medically and socially in Japan [15-18]. Furthermore, we reported the significance of ketone bodies and Morbus (M) value [18-20]. Consequently, we have accumulated anthropometric data for T2DM such as BMI and WHtR.
Combining with these situations, we investigated the correlations among HbA1c, BMI and WHtR. Moreover, we tried and proposed a new marker for Thigh to Height ratio (THtR) and Thigh to Waist ratio (TWtR) with some speculation in this study.
Subjects and methods
Subjects included 80 patients (males: 45, females: 35) with type 2 diabetes mellitus (T2DM) who are 67.7 ± 12.9 years old (mean ± SD) and 69 years old in median. They were outpatients that authors have treated for nutritional and exercise therapy, and enrolled in this research program.
Methods are summarized as follows: 1) When these patients visited the clinic on first contact, we measured basal blood test including HbA1c and measured height, body weight, waist circumference (WC) and thigh circumference (TC). 2) WC were measured at the level of navel in the upright position with relaxed respiration. 3) TC were measured at the position of 10 cm upward from the upper margin of right patella. 4) Several factors were calculated and investigated the correlation among these markers. They were, Body Mass Index, HbA1c. WC, WHtR (Waist to Height ratio), THtR (Thigh to Height ratio) and TWaR (Thigh to Waist ratio).
Statistical analyses
In current study, data was represented as the mean +/- standard deviation, and also represented median, quartile of 25% and 75% in biomarkers. For statistical analyses, correlation coefficients were calculated using the Microsoft Excel analytical tool, which is Four steps Excel Statistics 3rd edition by Yanai H, Seiun-sha Publishing Co. Ltd, 2014.
Ethical considerations
Current study was conducted in compliance with the ethical principles of the Declaration of Helsinki and Japan’s Act on the Protection of Personal Information along with the Ministerial Ordinance on Good Clinical Practice (GCP) for Drug (Ordinance of Ministry of Health and Welfare No. 28 of March 27, 1997). No ethical committee meeting was held.
Results
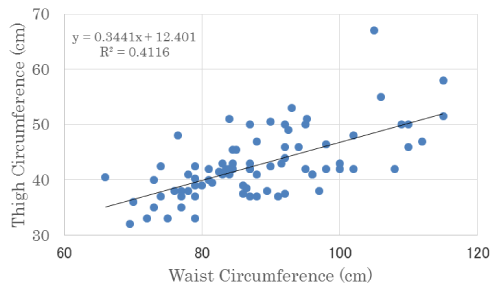
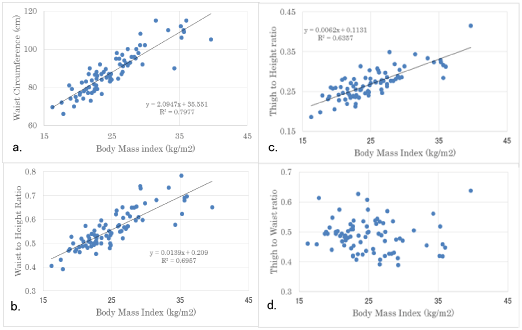
Basal data of subjects enrolled were shown in Table 1. Average BMI was 25.1 kg/m2 and average HbA1c was 7.2 %. There was significant correlation between Waist Circumference (WC) and Thigh Circumference (TC) (p<0.01) (Figure 1). Correlations between BMI and 4 markers were shown in Figure 2, which are WC, WHtR, THtR and TWaR. Former three factors showed significant correlations (p<0.01), and the last one did not show significant correlation.

Figure 1. Correlation between Waist Circumference (WC) and Thigh Circumference (TC) There was significant correlation between both markers (p<0.01).
Table 1. Basal data of the subjects.
| |
Average ± SD |
median |
[25% - 75%] |
age (years old) |
67.7 ± 12.9 |
69.0 |
[63.8 - 77.0] |
height (cm) |
158.6 ± 8.6 |
158.0 |
[153 - 165] |
body weight (kg) |
63.2 ± 13.3 |
60.5 |
[55.0 - 70.3] |
BMI (kg/m2) |
25.1 ± 4.8 |
24.4 |
[21.8 - 27.4] |
Waist circumference (cm) |
88.1 ± 11.2 |
87.0 |
[79.0 - 95.0] |
Thigh circumference (cm) |
42.7 ± 6.0 |
42.0 |
[38.4 - 46.0] |
Waist to Height ratio |
0.56 ± 0.08 |
0.54 |
[0.50 - 0.61] |
Thigh to Height ratio |
0.27 ± 0.02 |
0.27 |
[0.24 - 0.29] |
Thigh to Waist ratio |
0.48 ± 0.05 |
0.49 |
[0.45 - 0.52] |
HbA1c (%) |
7.2 ± 1.2 |
6.9 |
[6.4 - 7.7] |
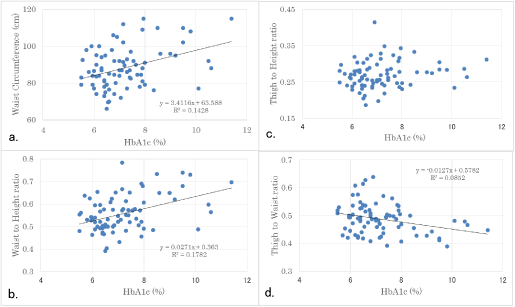
Correlations between HbA1c value and 4 markers were shown in Figure 3. WC and WHtR showed positive significant correlations (p<0.01), and THtR show no significant correlation. TWaR and HbA1c showed negative significant correlation, in which the Coefficient was -0.25 with p=0.26 (p<0.05).

Figure 2. Correlation between BMI and 4 markers (WC, WHtR, THtR and TWaR). Significant Correlations were shown in WC (p<0.01), WHtR (p<0.01), THtR (p<0.01), and was not shown in TWaR(n.s.). a. WC (Waist Circumference) b. WHtR (Waist to Height ratio) c. THtR (Thigh to Height ratio) d. TWaR (Thigh to Waist ratio).

Figure 3. Correlation between HbA1c value and 4 markers (WC, WHtR, THtR and TWaR) Significant Correlations were shown in WC (p<0.01), WHtR (p<0.01), TWaR (p<0.05), and was not shown in THtR (n.s.). a. WC (Waist Circumference) b. WHtR (Waist to Height ratio) c. THtR (Thigh to Height ratio) d. TWaR (Thigh to Waist ratio).
Discussion
In this study, anthropometric markers such as WC and WHtR were discussed. Systematic review was reported as a screening tool for the prediction of cardiovascular disease and diabetes [12]. WHtR is simple index for central fatness and useful as an additional or alternative measure to BMI in children and adults [21]. From different countries and races, mean boundary values for WHtR would be 0.50 for men and women [12], 0.50 in men and 0.52 in women [22], 0.54 in both [23], 0.58 for discriminating individuals with metabolic syndrome [24]. Standard range of WHtR would be from 0.41 to 0.52 for men and from 0.38 to 0.50 for women [25]. Use of a simple boundary value for WHtR (0.5) identifies more people at ‘early health risk’ than BMI and WC [26]. As social health slogan, ‘Keep your waist circumference to less than half your height’ would be impressive [21].
Compared to these, our results of WHtR in 80 subjects showed that 57 (71.3%) were more than 0.5 and 40 (50%) were more than 0.54, with 33(41.2%) of elevated BMI. Stronger associations were revealed in WC and WHtR than BMI and weight, reflecting abdominal obesity and incident T2DM [27]. On contrast, some reports stressed the importance of BMI [10,28], and WC was more associated with CVD risk factors than WHtR by systematic review and meta-analysis [29]. Further investigation would be necessary to clarify the relationship between WHtR and various biomarkers and presence of complication.
Recently, other indices have been introduced. Well-being of the Singapore Elderly (WiSE) investigated BMI, waist circumference, hip circumference for Chinese, Indians and Malays, and showed Waist-Hip Ratio (WHR) predominance for various factors [30]. WC, WHtR, and WHR were the best discriminators among white females, whereas WHR was the best discriminator among black females [31]. Furthermore, Body Adiposity Index (BAI) was proposed, which is composite index based on hip circumference and height (BAI = hip circumference (cm) divided by (height (m))1.5 minus 18) [32]. BAI was intended to provide a direct estimate of percentage (%) body adiposity, especially from a population study of Mexican Americans [11,32].
In current study, we proposed a trial of Thigh to Waist ratio (TWaR). One of the impressive result was the negative significant correlation between HbA1c and TWaR, in which the Coefficient was -0.25 with p=0.26. Thigh Circumference (TC) might indicate the muscle volume, whereas Waist Circumference (WC) indicates the adipose tissue volume, suggesting the possible utilization of TWaR on the clinical research in the future.
This study has important limitation. Firstly, several factors such as population, sample size, ethnicity, age, gender, smoking and physical activity status would be necessary for precise research. Secondly, basal biomarkers such as lipids, atherogenic index (AI) [25], creatinine, uric acid and other data would be desirable to be included. Thirdly, diabetic micro- and macro-angiopathy including cerebral vascular accident (CVA) [33], cardiovascular disease (CVD) and peripheral vascular disease (PVD) as well as hypertension [30] and hyperlipidemia would be investigated together with the anthropometric measurement [34-36]. Moreover, higher level of research method such as cross-sectional study or Randomized Controlled Trial (RCT) would be preferred.
The result of this study would become the fundamental data for the anthropometric research in metabolic syndrome leading to CVD. Further studies of a prospective nature will be required for the research in this field.
Acknowledgement
The part of the content of this article was presented at the 89th and 90th Scientific Meeting of Japan Endocrine Society (JES) Annual Congress, Kyoto, 2016 and 2017. The authors would like to thank the patients and staffs for their cooperation and support.
Conflicts of interest
The authors declare th2021 Copyright OAT. All rights reserv.
References
- WHO Expert Consultation (2004) Appropriate body-mass index for Asian populations and its implications for policy and intervention strategies. Lancet 363: 157-163. [Crossref]
- World Health Organization (2017) Global Health Observatory (GHO) data.
- Nishi N (2015) Monitoring Obesity Trends in Health Japan 21. J Nutr Sci Vitaminol (Tokyo) 61 Suppl: S17-19. [Crossref]
- Tanaka H, Imai S, Nakade M, Imai E, Takimoto H (2016) The physical examination content of the Japanese National Health and Nutrition Survey: temporal changes. Asia Pac J Clin Nutr 25: 898-910. [Crossref]
- Guh DP, Zhang W, Bansback N, Amarsi Z, Birmingham CL, et al. (2009) The incidence of co-morbidities related to obesity and overweight: a systematic review and meta-analysis. BMC Public Health 9: 88. [Crossref]
- Cornier MA, Despres JP, Davis N, Grossniklaus DA, Klein S, et al. (2011) Assessing adiposity: a scientific statement from the American Heart Association. Circulation 124: 1996-2019. [Crossref]
- Jackson AS, Stanforth PR, Gagnon J, Rankinen T, Leon AS, et al. (2002) The effect of sex, age and race on estimating percentage body fat from body mass index: The Heritage Family Study. Int J Obes Relat Metab Disord 26: 789-796. [Crossref]
- Nyamdorj R, Qiao Q, Lam TH, Tuomilehto J, Ho SY, et al. (2008) BMI compared with central obesity indicators in relation to diabetes and hypertension in Asians. Obesity (Silver Spring) 16: 1622-1635. [Crossref]
- InterAct Consortium, Langenberg C, Sharp SJ, Schulze MB, Rolandsson O, et al. (2012) Long-term risk of incident type 2 diabetes and measures of overall and regional obesity: the EPIC-InterAct case-cohort study. PLoS Med 9: e1001230. [Crossref]
- Huerta JM, Tormo MJ, Chirlaque MD, Gavrila D, Amiano P, Arriola L, et al. (2013) Risk of type 2 diabetes according to traditional and emerging anthropometric indices in Spain, a Mediterranean country with high prevalence of obesity: results from a large-scale prospective cohort study. BMC Endocr Disord 13: 7. [Crossref]
- Lam BCC, Koh GCH, Chen C, Wong MTK, Fallows SJ (2015) Comparison of Body Mass Index (BMI), Body Adiposity Index (BAI), Waist Circumference (WC), Waist-To-Hip Ratio (WHR) and Waist-To-Height Ratio (WHtR) as Predictors of Cardiovascular Disease Risk Factors in an Adult Population in Singapore. PLoS ONE 10: e0122985. [Crossref]
- Browning LM, Hsieh SD, Ashwell M (2010) A systematic review of waist-to-height ratio as a screening tool for the prediction of cardiovascular disease and diabetes: 0·5 could be a suitable global boundary value. Nutr Res Rev 23: 247-269. [Crossref]
- Ashwell M, Gunn P, Gibson S (2012) Waist-to-height ratio is a better screening tool than waist circumference and BMI for adult cardiometabolic risk factors: systematic review and meta-analysis. Obes Rev 13: 275-286. [Crossref]
- Savva SC, Lamnisos D, Kafatos AG (2013) Predicting cardiometabolic risk: waist-to-height ratio or BMI. A meta-analysis. Diabetes Metab Syndr Obes 6: 403-419. [Crossref]
- Ebe K, Ebe Y, Yokota S, Matsumoto T, Hashimoto M, et al. (2004) Low Carbohydrate diet (LCD) treated for three cases as diabetic diet therapy. Kyoto Medical Association Journal 51: 125-129.
- Bando H, Nakamura T (2008) Carbo-count therapy and low carbohydrate diet (LCD). The Journal of the Therapy 90: 3105-3111.
- Bando H, Ebe K, Muneta T, Bando M, Yonei Y (2017) Clinical Effect of Low Carbohydrate Diet (LCD): Case Report. Diabetes Case Rep 2: 124.
- Bando H, Ebe K, Nakamura T, Bando M, Yonei Y (2016) Low Carbohydrate Diet (LCD): Long and short-term effects and hyperketonemia. Glycative Stress Research 3: 193-204. [Crossref]
- Muneta T, Kawaguchi E, Nagai Y, Matsumoto M, Ebe K, et al. (2016) Ketone body elevation in placenta, umbilical cord, newborn and mother in normal delivery. Glycative Stress Research 3: 133-140.
- Bando H, Ebe K, Muneta T, Bando M, Yonei Y (2017) Effect of low carbohydrate diet on type 2 diabetic patients and usefulness of M-value. Diabetes Res Open J 3: 9-16.
- McCarthy HD, Ashwell M (2016) A study of central fatness using waist-to-height ratios in UK children and adolescents over two decades supports the simple message - 'keep your waist circumference to less than half your height'. Int J Obes 30: 988-992. [Crossref]
- Guan X, Sun G, Zheng L, Hu W, Li W, Sun Y. (2016) Associations between metabolic risk factors and body mass index, waist circumference, waist-to-height ratio and waist-to-hip ratio in a Chinese rural population. J Diabetes Investig 7: 601-6. [Crossref]
- Caminha TC, Ferreira HS, Costa NS, Nakano RP, Carvalho RE, et al. (2017) Waist-to-height ratio is the best anthropometric predictor of hypertension: A population-based study with women from a state of northeast of Brazil. Medicine (Baltimore) 96: e5874. [Crossref]
- Bohr AD, Laurson K, McQueen MB (2016) A novel cutoff for the waist-to-height ratio predicting metabolic syndrome in young American adults. BMC Public Health 16: 295. [Crossref]
- Hertelyová Z, Vašková J, Vaško L (2016) Waist Circumference-to-Height Ratio Detected in a Convenient Sample of Young Slovak People with Increased Cardio-Metabolic Risk. Cent Eur J Public Health 24: 95-102. [Crossref]
- Ashwell M, Gibson S (2016) Waist-to-height ratio as an indicator of 'early health risk': simpler and more predictive than using a 'matrix' based on BMI and waist circumference. BMJ Open 6: e010159.
- Hartwig S, Kluttig A, Tiller D, Fricke J, Müller G, et al. (2016) Anthropometric markers and their association with incident type 2 diabetes mellitus: which marker is best for prediction? Pooled analysis of four German population-based cohort studies and comparison with a nationwide cohort study. BMJ Open 6: e009266. [Crossref]
- Schneider HJ, Glaesmer H, Klotsche J, Bohler S, Lehnert H, et al. (2007) Accuracy of anthropometric indicators of obesity to predict cardiovascular risk. J Clin Endocrinol Metab 92: 589-594. [Crossref]
- van Dijk SB, Takken T, Prinsen EC, Wittink H (2012) Different anthropometric adiposity measures and their association with cardiovascular disease risk factors: a meta-analysis. Neth Heart J 20: 208-218. [Crossref]
- Fauziana R, Jeyagurunathan A, Abdin E, Vaingankar J, Sagayadevan V, et al. (2016) Body mass index, waist-hip ratio and risk of chronic medical condition in the elderly population: results from the Well-being of the Singapore Elderly (WiSE) Study. BMC Geriatr 16: 125. [Crossref]
- Hardy DS, Stallings DT, Garvin JT, Gachupin FC, Xu H, et al. (2017) Anthropometric discriminators of type 2 diabetes among White and Black American adults. J Diabetes 9: 296-307. [Crossref]
- Bergman RN, Stefanovski D, Buchanan TA, Sumner AE, Reynolds JC, et al. (2011) A better index of body adiposity. Obesity (Silver Spring) 19: 1083-1089. [Crossref]
- Yu P, Pan Y, Zheng H, Wang X, Yan H, Tong X, et al. (2016) Association of high waist-to-height ratio with functional outcomes in patients with acute ischemic stroke: A report from the ACROSS-China study. Medicine (Baltimore) 96: e6520. [Crossref]
- Park SH, Choi SJ, Lee KS, Park HY (2009) Waist circumference and waist-to-height ratio as predictors of cardiovascular disease risk in Korean adults. Circ J 73: 1643-1650. [Crossref]
- Hou X, Lu J, Weng J, Ji L, Shan Z, et al. (2013) Impact of waist circumference and body mass index on risk of cardiometabolic disorder and cardiovascular disease in Chinese adults: a national diabetes and metabolic disorders survey. PLoS One 8: e57319. [Crossref]
- Albarwani S, Al-Siyabi S, Tanira MO (2014) Prehypertension: Underlying pathology and therapeutic options. World J Cardiol 6: 728-743. [Crossref]


