Abstract
Eating is an instinctive behavior and a fundamental oral function for energy intake. However, the changes in the variables involved in intake volume and time-dependent changes during a meal have yet to be sufficiently clarified. This study aimed to elucidate the changes in normal food intake behavior during a meal. We recruited 20 healthy females with normal body mass index. Food intake behavior and intake volume were recorded using a three-dimensional motion capture system and electric weighing instrument. We applied multilevel model analysis to describe fitting curves of the variables related to food intake. Correlations of these variables were also estimated. We described time-dependent statistically significant polynomial curves of variables during a meal. The mouthful weight and intake interval were not constant throughout the meal. The mouthful weight was larger at the beginning of the meal than at the end; the intake interval was the shortest at the start of a meal; it gradually increased until the 80% point. Most of the variables were statistically and strongly correlated with one another. The total intake time had a significantly high positive correlation with the number of mouthfuls, mouthful weight, intake interval, total chewing number, and mouthful chewing number; the total intake time had a significantly negative correlation with mouthful weight. We established that in the healthy subjects, food intake behavior changed according to the consumed volume and with time. A small mouthful weight leads to a large number of mouthfuls, thereby extending the mealtime. These findings may be helpful in assessing eating behaviors toward proposing a behavioral strategy to control meal durations and eating rates.
Key words
eating time, intake interval, mouthful weight, natural food intake, number of chews
Introduction
Feeding is an instinctive behavior for energy intake; it is necessary to maintain homeostasis and confers psychological and mental benefits, such as relaxation and satisfaction, to most mammals. The control of feeding behavior involves the metabolic controls of internal energy balance regulation as well as cognitive and emotional controls. The metabolic regulation system is controlled by the neural network surrounding the hypothalamus [1-3]. The cognitive control system includes the memorial representation of foods (including emotional and rewarding properties), and sensory information (such as visual sensory information and olfactory sensory information) [4]. In addition, interaction between the two systems has been suggested [5].
The control of food intake related to starting and finishing individual meals in humans is considered short-term regulation; it is distinguished from long-term regulation, which is involved in maintaining internal energy storage, normally on a weekly basis [6,7]. Short-term regulation is closely involved with the intake volume and timing of meals. This regulation can be examined using the parameters of cumulative food intake curves during a meal, and it reflects underlying physiological or cognitive processes. Cumulative food intake curves, which register eating rate across time, are used as a tool for examining food intake behavior—especially when analyzing dietary and clinical interventions on meal size [8,9]. Cumulative food intake curves have been shown to be stable and consistent within individuals [10-12], and they show a clear relationship with subjective characteristics of dietary restraint and obesity [8,11,13-18]. Feeding behaviors, particularly the eating rate, have long been of interest as a contributing factor in the development of obesity, which is a major contributor to a range of metabolic disorders. Several studies have reported the potential associations in this regard, such as relationship between body mass index (BMI) and mealtimes [19-21]. However, other investigations have identified no connection between mealtimes and obesity [22-26]. Thus, the findings in this area are disputable.
Eating is one of the most essential stomatognathic functions. The entire eating sequence consists of several steps: food cognition; mouth opening and food ingestion; and mouth closing and mastication and swallowing. Multiple stomatognathic organs are involved in this complex process. In previous studies, various approaches have been used to evaluate feeding behavior in terms of stomatognathic functions: surface electromyography [27,28]; videofluoroscopy [29-31]; videoendoscopy [32,33]; ultrasonography [34,35]; and two- and three-dimensional motion analysis systems [36]. However, only some steps in this activity have been analyzed, and investigations did not include all the steps in eating. Okada et al. [37] analyzed oral behavior from food intake until terminal swallow for mastication and swallowing under a freely eating condition with one bite of food. The authors showed that the weight of one bite of food varied among individuals. Okada et al. also found that swallows during a complete feeding sequence differ from the command swallow because of differences in food volume. These results underline the importance of analyzing oral behavior during food intake throughout the feeding sequence. Spiegel et al. [38,39] studied the effect of bite size on ingestion rate, satiation, and meal size with respect to a whole meal involving three bite conditions. In their study, solid food units (small spirals of bread with different fillings) were used as the meal. The authors showed that decreasing the bite size significantly lowered the ingestion rate for the whole meal; they also found that bite size affected the extent to which the food was chewed and the local rate of ingestion.
The present study aimed to determine which parameters of oral behavior in food intake are related to eating time and rate when freely consuming curry with rice. This study also examined how oral behavior and eating rate change over time.
Material and methods
Subjects
The study participants were 20 healthy, adult female volunteers: mean age, 26.9 (22–40) years; mean BMI, 19.8 (17.0–25.5). None of the subjects had any problems with mastication or swallowing; there were no abnormalities in the number or position of teeth (except for the third molar) or in occlusion; there were no histories of eating disorders. We obtained informed consent from each subject after explaining the aim and methodology of the study. This study was approved by the Ethics Committee of the Faculty of Dentistry, Niigata University Faculty of Dentistry (25 - R21 - 10 - 2).
Measurement system and procedure
We used the Vicon motion analysis system (Vicon Motion Systems, Oxford, UK) to collect three-dimensional kinematic data at a frequency of 100 Hz. We attached several light-reflective markers to each participant to track motion of the markers; motion was tracked using six charge-coupled device cameras placed 1 m away from each subject and visualized on a computer display (Figure 1).
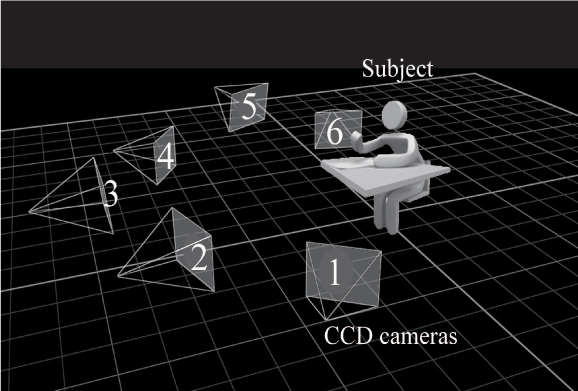
Figure 1. Camera setup for the study
Six charge-coupled device cameras were used to record the feeding behavior of each subject.
We attached the spherical low-weight reflective markers (4 mm in diameter) to the lower facial surface to record mouth movement. The other markers (10 mm in diameter) were attached to the rim and right and left temple of an eyeglass frame to configure the reference coordinate system (Figure 2). We set the center of gravity of three points—the nasion and the orbitale equivalent markers on the eyeglass frame—as the origin. As shown in Figure 2, we defined the reference coordinate system by the origin and the four points of the eyeglass frame and rim markers. We extracted the chin marker point for three-dimensional mouth movement.
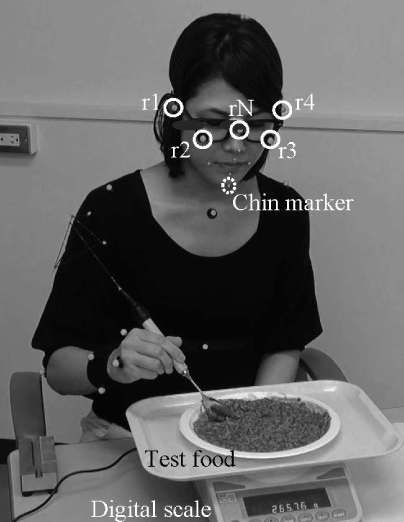
Figure 2. View of a subject recorded during a meal
There were five reference markers: r1 and r4 in the temple region of the eyeglass rim; r2 and r3 on the eyeglass frame as orbitale equivalent markers; and rN on the eyeglass frame as nasion equivalent markers. In this study, the chin marker coordinate was extracted to represent a three-dimensional jaw movement. The weight of the plate was recorded using a digital scale to calculate the food intake weight.
We used two digital video cameras (Handycam HDR-CX550V, Sony, Tokyo, Japan) to observe meal intake volume and confirm feeding behavior. We directed one camera toward a digital scale, which measured the weight of the plate for the meal; the other camera was directed toward the subject. The sampling rate of the recordings was 30 Hz.
The test food was one meal of curry with rice. It consisted of 150 g curry roux made using a freeze-drying method (Curry Pot, Ezaki Glico, Osaka, Japan) and 150 g rice made using a retort production method (Sato no Gohan, Sato Foods, Niigata, Japan). The “curry rice” was served as a homogenous mix on a flat plate, 22 cm in diameter. The subjects were requested to sit upright, with their back supported by a backrest while adopting a natural head position. Each participant was asked to eat the curry rice freely and at their own pace after receiving a start signal; they could continue eating until satiety. Though the subjects were allowed to stop eating when they reached satiety, all of them did in fact consume all the curry rice provided. During the meal, the subjects were free to drink water whenever they wished. A recording session began when the subject moved their hand to scoop up the curry rice with a spoon to bring it to their oral cavity, which we defined as food intake. The recording session ended when the participant finished swallowing the final bite. Participants were asked to raise their hands when they had finished. We performed the recordings at the same time of day (before lunch) after the subjects had adapted to the measuring environment.
Data analysis
We measured total intake time, number of mouthfuls, mouthful weight, intake interval, and number of chews throughout the meal. A representative chin marker movement during a meal appears in Figure 3. That is the change over time of the three-dimensional coordinate distance of the chin marker from start to finish of food intake. The three-dimensional coordinate distance was a series of repeated cyclic movements associated with the mainly vertical movement of the mouth opening and closing. A series of the cyclic movements began with the beginning of the mouth opening from the intercuspal position; it ended with the final swallowing of the last mouthful with free chewing and swallowing. We defined a chewing cycle as the period from one maximum jaw opening to the next. We used a custom-written code in IgorPro (WaveMetrics, Portland, OR, USA) to determine the maximum value (peak) and minimum value (negative peak) of the chin marker movements in the three-dimensional coordinate distance. The data point identified with this code was visually checked and verified.
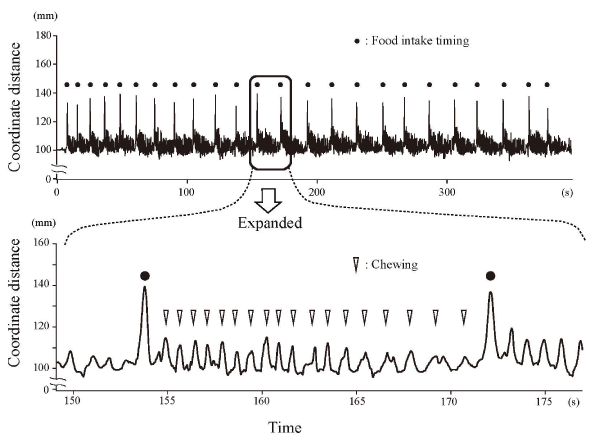
Figure 3. Representative chin marker three-dimensional movement during a meal
The upper figure shows the movement during the whole meal, and the lower figure shows an expanded section between food intake timings. Food intake timing: maximum jaw opening for food intake. Chewing: maximum jaw opening during the chewing cycle between food intake timings.
We defined the start of food intake as the first maximum jaw opening and the end as the jaw closing with the final swallowing of the last mouthful. The total intake time was the time interval from the start of food intake to the end. We defined the number of mouthfuls as the number of intakes from the start of food intake to the end. The intake interval was the time interval of maximum jaw opening between one intake and the next. We defined the total chewing number as the number of chews from the start of food intake to the end; the mouthful chewing number was the number of chews per mouthful. Intake efficiency was the mouthful weight divided by the intake interval.
It was difficult to normalize raw values to obtain time-dependent changes of each parameter: those values did not necessarily change constantly with time, and the total intake time varied among individuals. To evaluate the time-dependent change of the cumulative intake weight, mouthful weight, intake interval, and intake efficiency, we transformed the time scale to percentage values (start point = 0%, finish point = 100%); we then recalculated the intake time. With this time scale, each value was expressed as a statistically significant polynomial graph.
Statistics
We performed descriptive statistics, including Pearson’s correlation coefficient, using SPSS 10.0 software (IBM Japan, Tokyo, Japan). All the data were expressed as means ± standard deviation. A P value <0.05 was considered statistically significant. To evaluate the time-dependent change, we used multilevel model analysis (MLwiN, University of Bristol, UK) [40,41]. The multilevel approach estimates mathematical models consisting of fixed and random parts. The model’s fixed part estimated each parameter related to food intake; the random part estimated variation. We used iterative generalized least-squares procedures to estimate the model’s parameters. Plotting those polynomials calculated using the MLwiN software produced a graphic representation of each parameter’s best fit for the time-dependent change. Multilevel analysis indicated where each term of the best-fit curve could be considered statistically significant (P value <0.05).
Results
Parameters related to food intake
Table 1 shows the mean values and correlations of each parameter related to food intake. The total intake time was 367.1 ± 132.1 s (149–704 s), and the number of mouthfuls was 23.5 ± 5.0 (17–36). The mouthful weight was 12.1 ± 2.4 g (7.5–16.2 g), and the intake interval was 15.1 ± 5.1 s (7.8–25.7 s). The total chewing number was 389.3 ± 140.5 (166–626), and the chew number per mouthful was 17.9 ± 6.7 (8.3–29.8). The total intake time had a significantly high positive correlation with the number of mouthfuls, mouthful weight, intake interval, total chewing number, and mouthful chewing number. However, there was a negative correlation between the total intake time and mouthful weight. The intake interval had a significantly high positive correlation with the mouthful chewing number and total chewing number. There was no significant correlation between the mouthful chewing number and mouthful weight. The BMI of the study subjects did not have a significant correlation with any of the parameters related to food intake.
Table 1. Mean values and correlations of each parameter related to food intake.
|
Mean ± S.D. |
Correlation coefficient |
BMI |
Total intake time |
Mouthful number |
Mouthful weight |
Intake interval |
Total chew number |
BMI |
19.8 ± 2.1 |
|
|
|
|
|
|
Total intake time
(s) |
367.1 ± 132.1 |
-0.055 |
|
|
|
|
|
Mouthful number |
23.5 ± 5.0 |
-0.131 |
0.637** |
|
|
|
|
Mouthful weight
(g) |
12.1 ± 2.4 |
0.087 |
-0.720** |
-0.939** |
|
|
|
Intake interval
(s) |
15.1 ± 5.1 |
-0.126 |
0.828** |
-0.010 |
-0.158 |
|
|
Total chew number |
389.3 ± 140.5 |
-0.056 |
0.899** |
0.240 |
-0.443 |
0.902** |
|
Mouthful chew number |
17.9 ± 6.7 |
-0.206 |
0.789** |
0.006 |
-0.197 |
0.916** |
0.947** |
Values are means ± S.D. (S.D.: standard deviation of the mean)
Correlations were tested using Pearson’s correlation.
Significance level: **P <0.01
Time-dependent changes of parameters related to food intake
Figures 4–7 show polynomial curves of, respectively, the cumulative intake weight, time-dependent change in mouthful weight, intake duration, and intake efficiency. All the curves are described as statistically significant polynomial function curves (Table 2). The cumulative intake weight was the integrated value of the mouthful weight; the curve of the cumulative intake weight was considered a significant fourth-order polynomial curve (Figure 4). The mouthful weight slightly increased with each food intake from the start and peaked at the 20%–30% point; thereafter, it decreased continuously until the end of the meal (Figure 5). The mean intake interval was about 10 s at the start of meal; it then increased immediately until the 20%–30% point (Figure 6). Subsequently, it slowly increased and peaked at the 80% point; it then decreased until the end of the meal. The intake efficiency per mouthful showed a maximum value at the start; thereafter, it continued to decline until the end of the meal (Figure 7). The change in the decrease of the curve for intake efficiency per mouthful was not constant. That curve showed a steep slope from the start to the 20% point and also from the 90% point to the end of a meal; from 20% to 90%, the curve presented a slow, gradual decline.

Figure 4. Polynomial curve of cumulative intake weight over time
The cumulative intake weight was the reduction in the weight of the plate measured using a digital scale. Cumulative intake weight increased immediately after the start of meal. The curve is a statistically significant fourth-order polynomial function curve (Table 2).
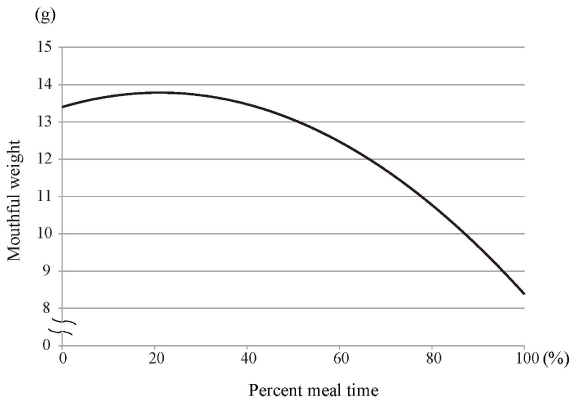
Figure 5. Polynomial curve of mouthful weight over time
The mouthful weight slightly increased with every food intake from the start and peaked at the 20% to 30% point; thereafter, it decreased until the end of the meal. It is described as a statistically significant third-order polynomial function curve (Table 2).
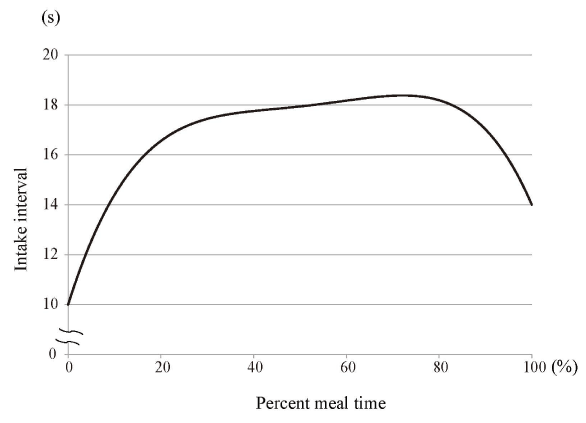
Figure 6. Polynomial curve of intake interval over time
The intake interval increased immediately from the start until the 20%–30% point; thereafter, it slowly increased and peaked at the 80% stage; it then decreased until the end of the meal. The curve is drawn with a statistically significant fourth-order polynomial function curve (Table 2).
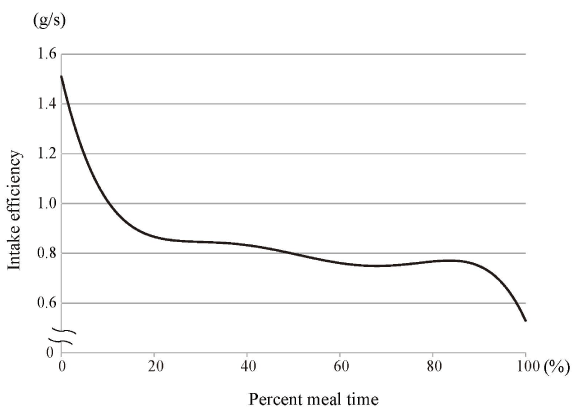
Figure 7. Polynomial curve of intake efficiency over time
The intake efficiency per mouthful showed a maximum value at the start; it then continued to decrease until the end of the meal. The curve is fitted with a statistically significant fifth-order polynomial function curve (Table 2).
Table 2. Estimates of values of the parameters related to food intake as a percentage of the mealtime (PMT).
Explanatory variables |
Intake weight |
Mouthful weight |
Intake interval |
Intake efficiency |
Estimate |
S.E. |
Estimate |
S.E. |
Estimate |
S.E. |
Estimate |
S.E. |
Constant
PMT1
PMT2
PMT3
PMT4
PMT5 |
1.56E+1
3.67E+0
-2.93E-2
3.26E-4
-1.42E-6
|
3.08E+0
2.35E-1
9.20E-3
1.34E-4
6.43E-7 |
1.34E+1
3.66E-2
-8.68E-4
5.25E-6 |
8.90E-1
2.64E-2
2.46E-4
1.95E-6 |
1.00E+1
5.90E-1
-1.72E-2
2.26E-4
-1.09E-6 |
1.47E+0
1.48E-1
5.80E-3
8.43E-5
4.05E-7 |
1.51E+0
-7.98E-2
3.70E-3
-8.12E-5
8.25E-7
-3.13E-9 |
1.12E-1
1.69E-2
9.97E-4
2.43E-5
2.60E-7
1.00E-9 |
The parameters related to food intake (intake weight, mouthful weight, intake interval, and intake efficiency) are described as polynomials (constant, PMT1–PMT5). S.E.: standard error of the mean.
Discussion
To determine the factors that promote excess energy intake, many studies have examined how the way people eat affects appetite and food intake. Among such studies, a number have investigated meal duration and eating rate to elucidate an association with food intake amount [19-21,38,39,42-45]. The purpose of the present study was to analyze the factors of oral behavior that influence the duration of a naturally eaten meal and to examine changes in those factors during the meal. Accordingly, as a test food, we used a plate of homogeneous curry rice, which would be easy for the subjects to consume in single natural bites in the course of the meal.
We found that the total intake time had a significant positive correlation with the number of mouthfuls, intake interval, total chewing number, and mouthful chewing number; the total intake time had a significant negative correlation only with the mouthful weight (Table 1). We requested the subjects to consume the meals ad libitum; thus, individual mouthful weight was largely dependent on the usual eating habits of participants. The mouthful weight had no significant correlation with the intake interval or the total or mouthful chewing number. This suggests that even when the food size per mouthful was large, a substantial number of chews could not always be observed. The larger the food size per mouthful, the shorter was the mealtime; subjects that ate with large mouthfuls tended to eat fast. As expected, the number of chews showed a significant positive correlation with the total intake time; that time increased with the increase in chewing number. The chewing number did not show a significant correlation with the mouthful weight. It is possible that the factor that determines the character of individual habitual mastication in free feeding may be related to something other than mouthful size.
By contrast, it has been reported in both normal-weight and overweight and obese adults that an increased number of chews before swallowing reduced the meal size [46-50]. Shiozawa et al. [51] found that the number of chews per bite weight decreased gradually with increase in test food size. However, there are some critical differences between the above studies and ours. In those studies, the subjects were asked to count and report the number of chews made before swallowing, which is different from completely free feeding; in addition, the number of chews was assessed through portions of food rather than with a complete meal. The number of chews and chewing time could increase through an awareness of chewing and food portion size.
In the present study, each subject was requested to eat freely at their own pace and was allowed to stop eating when they reached satiety; however, all the participants ate all the test food. Thus, we cannot evaluate the influence of oral behavior factors on total intake weight. But our data clearly show that the mouthful size reflected individual habits that are closely involved in the total mealtime. Our results are not inconsistent with those of previous reports [42,43].
Food intake and chewing behavior seem to change over time owing to physiological changes in the body. Those changes are a result of energy intake and adaptability change of motion control by repeated food intake behavior during a complete meal. Accordingly, we examined the changes with time of each parameter related to food intake. The graph of the change in cumulative intake over time shows a fourth-order polynomial curve rising to the right. Although slight, the cumulative intake increase rate in the latter half of the meal is lower than in the first half (Figure 4). This finding is consistent with that of a previous study [9].
The mouthful weight increased slightly from the start of meal; it peaked at around the 25% point of the total time, and it continued to decrease until the end (Figure 5). We found that the mouthful weight was not constant throughout the meal: it was larger at the beginning than at the end. However, as evident in Figure 6, the intake interval was shortest at the start of a meal; it then gradually increased, though there was a slight change in the middle of the meal. Thus, a relatively large mouthful weight was consumed over a short interval at the beginning of the meal; thereafter, even though the mouthful weight gradually decreased, the intake interval was not reduced.
The graph of intake efficiency (obtained by dividing the mouthful weight by the intake interval) shows a similar trend (Figure 7). The eating rate and intake efficiency were slow at the 20% point of the meal. When humans start to feel full, their eating rate slows down, and they eventually stop eating. The short-term satiety signal that controls the intake of food includes a feedback signal from the gastrointestinal tract. However, it is unlikely that information about digestion and absorption of nutrients exerts an influence after consuming only a few bites.
It has been reported that cephalic-phase responses are involved in eating regulation, being triggered by visual, olfactory, and taste stimulation of food even before digestion and absorption of nutrients occurs [52-54]. This finding may be related to changes in intake duration and intake efficiency in early stage of meals, as observed in the present study. It is possible that increasing the number of intakes by decreasing the mouthful weight and thereby prolonging the total mealtime leads to a decrease in food intake. Our results suggest that consciousness of a small mouthful weight would be especially effective immediately after the start of a meal: at that stage, large mouthfuls tend to be taken and the eating rate tends to be fast.
The present study has several limitations. First, we did not count the number of swallows. Okada et al. [37] suggested that when ingesting food freely, humans may need at least two swallows—even with one bite of food. The number of ingestions into the mouth of one bite of food is not the same as the number of swallows. It is necessary to determine the number of swallows under conditions that are as free as possible. A second limitation is that the subjects were able to drink water with the meal so as to reflect normal meal conditions. The participants drank different amounts of water; even though the amount was small, that could have influenced the results. Third, our participants were healthy women, which did not permit a comparison among the subjects. One study found a significant gender effect in young adults [55], and a difference among normal-weight, overweight, and obese subjects has also been observed [46]. Despite these limitations, the present study clearly produced new findings in a complete feeding sequence under free conditions about mouthful weight and chewing behavior being related to the eating rate.
Conclusions
We examined the changes over time of such parameters as total intake time, mouthful weight, number of mouthfuls, and chewing number during a whole meal. Our results support the following conclusions.
- The total intake time showed significantly high correlations with the number of mouthfuls, mouthful weight, intake duration, total chewing number, and mouthful chewing number. There was a negative correlation between total time and mouthful weight; this suggests that a small mouthful weight leads to large number of mouthfuls, thereby encouraging extension of the mealtime.
- The mouthful weight and intake duration changed with time, and the intake efficiency per mouthful was not constant throughout the meal. Immediately after the start of a meal, large mouthfuls tend to be consumed quickly; but after a while, the intake interval increases and reaches a plateau. Accordingly, the intake efficiency also entered a stable period sometime after the beginning of a meal.
Declaration of interest
The authors declare that they have no conflicts of interest.
Funding information
This study was supported by KAKENHI from the Japan Society for the Promotion of Science (nos. 25463174 to H. Hayasaki, 16K11802 to H. Hayasaki).
References
- Chan JL, Mantzoros CS (2001) Leptin and the hypothalamic-pituitary regulation of the gonadotropin-gonadal axis. Pituitary 4: 87-92. [Crossref]
- Mantzoros CS (2001) The role of leptin and hypothalamic neuropeptides in energy homeostasis: update on leptin in obesity. Growth Horm IGF Res 11: S85-S89. [Crossref]
- Stieg MR, Sievers C, Farr O, Stalla GK, Mantzoros CS (2015) Leptin: A hormone linking activation of neuroendocrine axes with neuropathology. Psychoneuroendocrino 51: 47-57. [Crossref]
- Castonguay TW, Applegate EA, Upton DE, Stern JS (1983) Hunger and appetite: old concepts/new distinctions. Nutr Rev 41: 101-110. [Crossref]
- Berthoud HR (2007) Interactions between the "cognitive" and "metabolic" brain in the control of food intake. Physiol Behav 91: 486-498. [Crossref]
- Spiegelman BM, Flier JS (1996) Adipogenesis and obesity: rounding out the big picture. Cell 87: 377-389. [Crossref]
- Friedman JM, Halaas JL (1998) Leptin and the regulation of body weight in mammals. Nature 395: 763-770. [Crossref]
- Meyer JE, Pudel V (1972) Experimental studies on food-intake in obese and normal weight subjects. J Psychosom Res 16: 305-308. [Crossref]
- Westerterp-Plantenga MS (2000) Eating behavior in humans, characterized by cumulative food intake curves--a review. Neurosci Biobehav Rev 24: 239-248. [Crossref]
- Barkeling B, Rossner S, Sjoberg A (1995) Methodological studies on single meal food-intake characteristics in normal-weight and obese men and women. Int J Obes Relat Metab Disord 19: 284-290. [Crossref]
- Westerterp-Plantenga MS, Westerterp KR, Nicolson NA, Mordant A, Schoffelen PF, et al. (1990) The shape of the cumulative food intake curve in humans, during basic and manipulated meals. Physiol Behav 47: 569-576. [Crossref]
- Yeomans MR (1996) Palatability and the micro-structure of feeding in humans: the appetizer effect. Appetite 27: 119-133. [Crossref]
- Adams N, Ferguson J, Stunkard AJ, Agras S (1978) The eating behavior of obese and nonobese women. Behav Res Ther 16: 225-232. [Crossref]
- Westerterp KR, Nicolson NA, Boots JM, Mordant A, Westerterp MS (1988) Obesity, restrained eating and the cumulative intake curve. Appetite 11: 119-128. [Crossref]
- Westerterp-Plantenga MS, Wouters L, ten Hoor F (1990) Deceleration in cumulative food intake curves, changes in body temperature and diet-induced thermogenesis. Physiol Behav 48: 831-836. [Crossref]
- Westerterp-Plantenga MS, Wouters L, ten Hoor F (1991) Restrained eating, obesity, and cumulative food intake curves during four-course meals. Appetite 16: 149-158. [Crossref]
- Westerterp-Plantenga MS, Van den Heuvel E, Wouters L, Ten Hoor F (1992) Diet-induced thermogenesis and cumulative food intake curves as a function of familiarity with food and dietary restraint in humans. Physiol Behav 51: 457-465. [Crossref]
- Westerterp-Plantenga MS, Van den Heuvel E, Wouters L, ten Hoor F (1992) Accuracy of estimates of forthcoming ingestion as a function of menu familiarity and dietary restraint. Appetite 18: 101-109. [Crossref]
- Bellisle F, Le Magnen J (1981) The structure of meals in humans: eating and drinking patterns in lean and obese subjects. Physiol Behav 27: 649-658. [Crossref]
- Hill SW, McCutcheon NB (1984) Contributions of obesity, gender, hunger, food preference, and body size to bite size, bite speed, and rate of eating. Appetite 5: 73-83.
- Otsuka R, Tamakoshi K, Yatsuya H, Murata C, Sekiya A, et al. (2006) Eating fast leads to obesity: findings based on self-administered questionnaires among middle-aged Japanese men and women. J Epidemiol 16: 117-124. [Crossref]
- Takayama S, Akamine Y, Okabe T, Koya Y, Haraguchi M, et al. (2002) Rate of eating and body weight in patients with type 2 diabetes or hyperlipidaemia. J Int Med Res 30: 442-444. [Crossref]
- Barkeling B, Ekman S, Rössner S (1992) Eating behaviour in obese and normal weight 11-year-old children. Int J Obes Relat Metab Disord 16: 355-360. [Crossref]
- Hammer LD (1992) The development of eating behavior in childhood. Pediatr Clin North Am 39: 379-394. [Crossref]
- Sasaki S, Katagiri A, Tsuji T, Shimoda T, Amano K (2003) Self-reported rate of eating correlates with body mass index in 18-y-old Japanese women. Int J Obes Relat Metab Disord 27: 1405-1410. [Crossref]
- Kral JG, Buckley MC, Kissileff HR, Schaffner F (2001) Metabolic correlates of eating behavior in severe obesity. Int J Obes Relat Metab Disord 25: 258-264. [Crossref]
- Lindauer SJ, Gay T, Rendell J (1993) Effect of jaw opening on masticatory muscle EMG-force characteristics. J Dent Res 72: 51-55. [Crossref]
- Mioche L, Bourdiol P, Martin JF, Noel Y (1999) Variations in human masseter and temporalis muscle activity related to food texture during free and side-imposed mastication. Arch Oral Biol 44: 1005-1012. [Crossref]
- Palmer JB, Rudin NJ, Lara G, Crompton AW (1992) Coordination of mastication and swallowing. Dysphagia 7: 187-200. [Crossref]
- Leopold NA, Kagel MC (1996) Prepharyngeal dysphagia in Parkinson's disease. Dysphagia 11: 14-22. [Crossref]
- Hiiemae KM, Palmer JB (1999) Food transport and bolus formation during complete feeding sequences on foods of different initial consistency. Dysphagia 14: 31-42. [Crossref]
- Susa C, Kagaya H, Saitoh E, Baba M, Kanamori D, et al. (2015) Classification of sequential swallowing types using videoendoscopy with high reproducibility and reliability. Am J Phys Med Rehab 94: 38-43. [Crossref]
- Hayashi H, Hori K, Taniguchi H, Nakamura Y, Tsujimura T, et al. (2013) Biomechanics of human tongue movement during bolus compression and swallowing. J Oral Sci 55: 191-198. [Crossref]
- Casas MJ, Kenny DJ, McPherson KA (1994) Swallowing/ventilation interactions during oral swallow in normal children and children with cerebral palsy. Dysphagia 9: 40-46. [Crossref]
- Miller JL, Kang SM (2007) Preliminary ultrasound observation of lingual movement patterns during nutritive versus non-nutritive sucking in a premature infant. Dysphagia 22: 150-160. [Crossref]
- Inada E, Saitoh I, Nakakura-Ohshima K, Maruyama T, Iwasaki T, et al. (2012) Association between mouth opening and upper body movement with intake of different-size food pieces during eating. Arch Oral Biol 57: 307-313. [Crossref]
- Okada A, Honma M, Nomura S, Yamada Y (2007) Oral behavior from food intake until terminal swallow. Physiol Behav 90: 172-179. [Crossref]
- Spiegel TA (2000) Rate of intake, bites, and chews-the interpretation of lean-obese differences. Neurosci Biobehav Rev 24: 229-237. [Crossref]
- Spiegel TA, Kaplan JM, Tomassini A, Stellar E (1993) Bite size, ingestion rate, and meal size in lean and obese women. Appetite 21: 131-145. [Crossref]
- Throckmorton GS, Ellis E 3rd, Hayasaki H (2003) Jaw kinematics during mastication after unilateral fractures of the mandibular condylar process. Am J Orthod Dentofac 124: 695-707.
- Buschang PH, Hayasaki H, Throckmorton GS (2000) Quantification of human chewing-cycle kinematics. Arch Oral Biol 45: 461-474. [Crossref]
- Andrade AM, Greene GW, Melanson KJ (2008) Eating slowly led to decreases in energy intake within meals in healthy women. J Am Diet Assoc 108: 1186-1191. [Crossref]
- Zandian M, Ioakimidis I, Bergh C, Brodin U, Södersten P (2009) Decelerated and linear eaters: effect of eating rate on food intake and satiety. Physiol Behav 96: 270-275. [Crossref]
- Zhu Y, Hsu WH, Hollis JH (2013) The impact of food viscosity on eating rate, subjective appetite, glycemic response and gastric emptying rate. PLoS One 8: e67482. [Crossref]
- Kokkinos A, le Roux CW, Alexiadou K, Tentolouris N, Vincent RP, et al. (2010) Eating slowly increases the postprandial response of the anorexigenic gut hormones, peptide YY and glucagon-like peptide-1. J Clin Endocr Metab 95: 333-337. [Crossref]
- Zhu Y, Hollis JH (2014) Increasing the number of chews before swallowing reduces meal size in normal-weight, overweight, and obese adults. J Acad Nutr Diet 114: 926-931. [Crossref]
- Zhu Y, Hollis JH (2014) Chewing thoroughly reduces eating rate and postprandial food palatability but does not influence meal size in older adults. Physiol Behav 123: 62-66. [Crossref]
- Cassady BA, Hollis JH, Fulford AD, Considine RV, Mattes RD (2009) Mastication of almonds: effects of lipid bioaccessibility, appetite, and hormone response. Am J Clin Nutr 89: 794-800. [Crossref]
- Smit HJ, Kemsley EK, Tapp HS, Henry CJ (2011) Does prolonged chewing reduce food intake? Fletcherism revisited. Appetite 57: 295-298. [Crossref]
- Higgs S, Jones A2 (2017) Corrigendum to "Prolonged chewing at lunch decreases later snack intake" [Appetite 62 (1 March 2013) 91-95]. Appetite 116: 616. [Crossref]
- Shiozawa K, Ohnuki Y, Mototani Y, Umeki D, Ito A, et al. (2016) Effects of food diameter on bite size per mouthful and chewing behavior. J Physiol Sci 66: 93-98. [Crossref]
- Cecil JE, Francis J, Read NW (1998) Relative contributions of intestinal, gastric, oro-sensory influences and information to changes in appetite induced by the same liquid meal. Appetite 31: 377-390. [Crossref]
- Cecil JE, Castiglione K, French S, Francis J, Read NW (1998) Effects of intragastric infusions of fat and carbohydrate on appetite ratings and food intake from a test meal. Appetite 30: 65-77. [Crossref]
- Smeets PA, Erkner A, de Graaf C (2010) Cephalic phase responses and appetite. Nutr Rev 68: 643-655. [Crossref]
- Martin CK, Anton SD, Walden H, Arnett C, Greenway FL, Williamson DA (2007) Slower eating rate reduces the food intake of men, but not women: implications for behavioral weight control. Behav Res Ther 45: 2349-2359. [Crossref]