Abstract
Background: Alcohol consumption is a major global public health issue and is known to have significant effects on an individual’s psychological well-being. Alcohol acts on the central nervous system and can alter mood, cognition, and emotional functioning. Regular or heavy alcohol use is associated with increased levels of stress, anxiety, depression, irritability, emotional instability, and reduced coping skills. Over time, alcohol interferes with normal brain functioning, leading to difficulties in concentration, decision-making, and interpersonal relationships. Many individuals use alcohol as a coping mechanism for emotional distress, which may temporarily reduce tension but ultimately worsens psychological health. Therefore, assessing psychological health among alcohol consumers is essential for early detection, prevention, and intervention efforts.
Objectives: To assess level of psychological health in people with Alcoholics. To determine relationship between Psychological health and demographics variables of alcoholics.
Materials and methods: A descriptive cross-sectional study was conducted to assess the psychological health among 108 alcohol consumers from de-addiction centers, rehabilitation facilities, and psychiatric OPD hospitals in Belagavi district using a convenience sampling technique. Data were collected using the standardized Psychological Health Scale, which measures overall mental wellbeing, emotional stability, and coping ability. Data was entered and analyzed using SPSS Software, Descriptive data was analyzed using percentage and inferential data by chi- square test.
Result: The study finding showed that majority of alcohol consumers, around 77.78% fall under extremely poor health, very poor health and poor health categories.
Conclusion: The study concludes that most alcohol consumers experience poor to extremely poor psychological health, highlighting a significant need for psychological assessment, counselling, and mental health support among this population. No demographics characteristics showed a significant association.
Keywords
psychological health, alcohol consumers, psychological distress, mental well-being
Introduction
Health is a fundamental aspect of an individual’s life as it shapes physical, psychological, and social functioning [1]. Among these, psychological health plays a crucial role in determining how a person thinks, feels, behaves, and copes with everyday challenges. When psychological health is disturbed, it affects overall well-being, reduces the ability to handle stress, disrupts relationships, and impacts daily activities and decision-making [2].
One of the major lifestyle-related factors known to influence psychological health is alcohol consumption. Alcohol is a psychoactive substance that acts as a central nervous system depressant [3] and is widely consumed across different age groups and cultures. Long-term or excessive alcohol intake can continue for several years, often leading to emotional instability, impaired judgement, and poor mental resilience [4]. Alcohol consumption is commonly defined as the intake of alcoholic beverages such as beer, wine, and spirits, resulting in temporary changes in mood and behavior.
Alcohol directly affects brain functioning by altering the balance of neurotransmitters responsible for mood regulation and cognitive processes [5]. These changes can lead to symptoms such as anxiety, depression, irritability, decreased motivation, low self-esteem, and reduced coping abilities. Individuals may initially use alcohol to relieve emotional discomfort or stress, but repeated consumption can intensify psychological distress and contribute to dependency [6].
Clinically, alcohol use is also associated with a variety of psychological concerns including emotional dysregulation, poor concentration, memory difficulties, reduced impulse control, and disturbances in sleep patterns [7]. In many individuals, alcohol dependence or long-term drinking behavior becomes a major risk factor for declining psychological health [8].
Research suggests that psychological well-being among alcohol consumers is significantly influenced by lifestyle factors, health-related behavior, and social functioning Dawson, et al [9]. Health-compromising behavior such as irregular sleep, poor stress management, reduced physical activity, and social withdrawal may worsen psychological distress. Conversely, health-enhancing behavior—such as adequate rest, counselling support, regular exercise, and strong social connections—can improve mental well-being and overall psychological functioning [10].
Understanding the effects of alcohol consumption on psychological health is critical for planning effective mental health services, counselling programs, and preventive interventions. It also helps identify vulnerable individuals who may require early psychological support to prevent further deterioration [11].
Therefore, the present study was undertaken to assess the psychological health of alcohol consumers in the Belagavi area, with the aim of contributing valuable insights for improving their mental well-being and quality of life.
Materials and methods
Study design, sample size & technique: A descriptive cross-sectional study was conducted to study Psychological health among 108 alcohol consumers from de-addiction centers and psychiatric OPD hospitals in Belagavi district. The sample was selected using convenience sampling technique, where participants who were admitted and willing to participate during the period of data collection were recruited.
Tool for data collection: Psychological health scale developed by S.k. Verma (Chandigarh)
Measure used: Psychological health scale developed by S.k. Verma (Chandigarh)
Procedure: The study was conducted among alcohol consumers selected from de-addiction centers, rehabilitation facilities, and psychiatric OPD Hospitals in Belagavi. Ethical clearance was obtained from the institutional ethics committee, and permission was taken from the concerned authorities.
After explaining the purpose of the study, informed consent was obtained from each participant. Confidentiality and anonymity were assured. The Psychological Health Scale was administered individually with clear instructions. Assistance was provided to participants who had difficulty reading or understanding the items. The completed questionnaires were collected, scored, and prepared for statistical analysis.
Analysis of results: Percentage method was used to measure the levels of psychological health among alcohol consumers, and Chi-square test was used to find the association between psychological health and selected demographic variables.
Results and discussion
Health is a multidimensional concept that goes beyond the mere absence of disease. It enables individuals to participate actively in daily life, maintain meaningful relationships and work towards personal and social goals. When health is stable, individuals can cope well with challenges and enjoy a better quality of life; however, when health deteriorates, even achievements and opportunities lose their meaning because one cannot fully experience them [1].
Overall well-being depends on a balance among physical, psychological and social factors. When this balance is disturbed, the individual’s functioning is affected [2].
However, when individuals engage in chronic alcohol use, their psychological stability begins to weaken. Alcohol affects emotional regulation, increases irritability and reduces cognitive clarity. As psychological resources decline, individuals may find it harder to cope with stress, manage emotions or maintain healthy social interactions. Over time, this emotional strain can result in anxiety, depression and interpersonal conflicts, gradually deteriorating psychological health.
Evidence shows that chronic alcohol use can significantly disrupt emotional stability, leading to mood fluctuations, increased stress sensitivity, and reduced psychological resilience. Over time, these effects weaken mental well-being and make individuals more prone to developing depressive and anxiety-related symptoms [12].
In this context, the present study was carried out to assess the psychological health among individuals who consume alcohol.
Table 1, shows that the majority of the sample belonged to the 31–40 years age group (43.52%), indicating that alcohol dependence is more common during early to middle adulthood. The next largest groups were individuals aged 21–30 years (28.70%) and those 41 years and above (27.78%), which suggests that alcohol use is prevalent among both younger and older adults.
Table 1. Showing distribution of alcoholic patients according to their demographics characteristics
Characteristics |
Number |
Percentage |
Age groups |
|
|
21-30 yrs |
31 |
28.70 |
31-40 yrs |
47 |
43.52 |
>=41 yrs |
30 |
27.78 |
Religion |
|
|
Hindu |
87 |
80.56 |
Muslim |
14 |
12.96 |
Christian |
7 |
6.48 |
Occupation |
|
|
Employed |
19 |
17.59 |
Self employed |
57 |
52.78 |
Farmer |
13 |
12.04 |
Driver |
12 |
11.11 |
Student |
3 |
2.78 |
Business |
4 |
3.70 |
Education |
|
|
Primary |
19 |
17.59 |
Secondary |
49 |
45.37 |
PUC |
21 |
19.44 |
Graduate & higher |
19 |
17.59 |
Total |
108 |
100.00 |
As seen in Table 1, most participants in the study were Hindu (80.56%), followed by Muslims (12.96%) and Christians (6.48%).
More than half of the participants were self-employed (52.78%), including shop owners, plumbers and carpenters. these occupations often involve irregular working hours or financial stress, which may influence alcohol use. Other occupational groups included salaried employees (17.59%), farmers (12.04%), drivers (11.11%), students (2.78%) and small business owners (3.70%).
In terms of education, the highest proportion of participants had completed secondary education (45.37%), followed by those who studied up to PUC (19.44%). Primary education, graduation and higher degrees together accounted for 17.59% of the sample.
Overall, the results indicate that alcohol dependence occurs across different age groups, religions and occupational categories. However, it appears to be slightly more common among middle-aged, self-employed individuals with moderate education levels.
The results of objective 1 are presented and discussed as follow.
In reference with Table 2, it is observed that majority of the participants (50.93%) experienced extremely poor psychological health, (15.74%) reported very PH and (11.11%) reported poor PH Only a small proportion of the sample demonstrated positive PH, (5.56%) with extremely good, (3.70%) very good, and (5.56%) with good psychological health (Figure 1). These results indicate that more than three-fourths of the participants exhibited poor to extremely poor psychological health, suggesting the presence of severe psychological distress among individuals who consume alcohol.
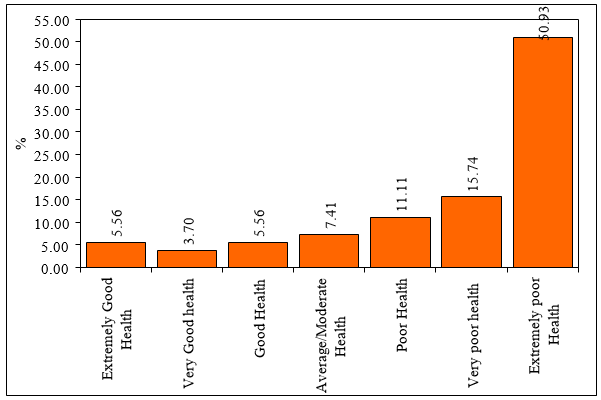
Figure 1. Percentage distribution of psychological health levels among participants consuming alcohol
Table 2. Showing the levels of psychological health of participants
Levels of psychological health |
Number |
Percentage |
Extremely good health |
6 |
5.56 |
Very good health |
4 |
3.70 |
Good health |
6 |
5.56 |
Average/Moderate health |
8 |
7.41 |
Poor health |
12 |
11.11 |
Very poor health |
17 |
15.74 |
Extremely poor health |
55 |
50.93 |
Total |
108 |
100.00 |
The findings of the present study align with previous research, which has shown that alcohol consumption is strongly associated with emotional instability, reduced coping ability, impaired decision-making and psychological disturbances such as anxiety, stress and depressive symptoms. This emphasized that chronic alcohol use can disrupt psychological resilience, interpersonal functioning and overall mental well-being [12,13].
The results of objective 2 are demonstrated in the following table.
Table 3, the findings showed that none of the demographic factors had a statistically significant association with psychological health.
Table 3. Showing association between levels of demographics variables and psychological health among alcoholics
Characteristics |
Extremely
good |
Very good |
Good |
Average/ moderate |
Poor |
Very poor |
Extremely poor |
Total |
χ² |
pvalue |
Age groups |
|
|
|
|
|
|
|
|
|
|
21-30 yrs |
3.23 |
3.23 |
3.23 |
9.68 |
19.35 |
22.58 |
38.71 |
28.70 |
9.2340
|
0.6830
|
31-40 yrs |
6.38 |
4.26 |
6.38 |
4.26 |
4.26 |
14.89 |
59.57 |
43.52 |
>=41 yrs |
6.67 |
3.33 |
6.67 |
10.00 |
13.33 |
10.00 |
50.00 |
27.78 |
Religion |
|
|
|
|
|
|
|
|
|
|
Hindu |
5.75 |
3.45 |
4.60 |
8.05 |
10.34 |
16.09 |
51.72 |
80.56 |
6.0770
|
0.9120
|
Muslim |
7.14 |
7.14 |
14.29 |
7.14 |
14.29 |
7.14 |
42.86 |
12.96 |
Christian |
0.00 |
0.00 |
0.00 |
0.00 |
14.29 |
28.57 |
57.14 |
6.48 |
Occupation |
|
|
|
|
|
|
|
|
|
|
Employed |
10.53 |
5.26 |
0.00 |
5.26 |
5.26 |
15.79 |
57.89 |
17.59 |
26.1170
|
0.6690
|
Self employed |
7.02 |
3.51 |
7.02 |
10.53 |
14.04 |
15.79 |
42.11 |
52.78 |
Farmer |
0.00 |
7.69 |
0.00 |
7.69 |
15.38 |
23.08 |
46.15 |
12.04 |
Driver |
0.00 |
0.00 |
16.67 |
0.00 |
8.33 |
0.00 |
75.00 |
11.11 |
Student |
0.00 |
0.00 |
0.00 |
0.00 |
0.00 |
66.67 |
33.33 |
2.78 |
Business |
0.00 |
0.00 |
0.00 |
0.00 |
0.00 |
0.00 |
100.00 |
3.70 |
Education |
|
|
|
|
|
|
|
|
|
|
Primary |
0.00 |
5.26 |
5.26 |
10.53 |
5.26 |
0.00 |
73.68 |
17.59 |
15.9590
|
0.5950
|
Secondary |
8.16 |
4.08 |
8.16 |
8.16 |
12.24 |
18.37 |
40.82 |
45.37 |
PUC |
0.00 |
0.00 |
0.00 |
9.52 |
14.29 |
19.05 |
57.14 |
19.44 |
Graduate & higher |
10.53 |
5.26 |
5.26 |
0.00 |
10.53 |
21.05 |
47.37 |
17.59 |
Total |
5.56 |
3.70 |
5.56 |
7.41 |
11.11 |
15.74 |
50.93 |
100.00 |
Note: Chi-square (χ2) |
For age, the chi-square value was χ2 = 9.2340 with a p-value of 0.6830, indicating no significant association between age groups and psychological health levels. Similarly, religion showed χ2 = 6.0770 and p = 0.9120, suggesting that psychological health problems were present across all religious groups without any meaningful relationship.
Occupation also did not show an association (χ² = 26.1170, p = 0.6690), meaning that alcoholics experienced poor psychological health regardless of whether they were employed, self-employed, farmers, drivers, students, or businessmen. Education level showed χ² = 15.9590 with p = 0.5950, again demonstrating no significant relationship between educational attainment and psychological health. Earlier studies also report that education alone does not protect individuals from alcohol-related psychological deterioration [14].
Overall, the findings indicate that while the majority of participants displayed extremely poor psychological health, demographic characteristics did not significantly influence these levels. This suggests that alcohol consumption itself is the primary contributing factor to psychological decline, rather than demographic differences.
Limitations
1. The study was conducted in a limited geographical area, restricting generalizability.
2. The sample size was modest, which may limit statistical power.
3. Self-reported data may include recall bias or social desirability bias.
Suggestions
- Future studies may include larger and more diverse samples to examine broader psychological patterns.
- Psych education about mental well-being, substance use, coping skills and relapse prevention should be provided to alcohol consumers and their families.
- Mental-health screening for early detection of depression, anxiety and stress among alcohol users should be conducted in hospitals and de-addiction centers.
- Counselling, support groups and coping-skills training may help reduce psychological distress.
- Awareness programs focusing on healthy lifestyle, stress management and emotional regulation may support psychological recovery among alcohol consumers.
Conclusion
1. Alcohol consumers in the study demonstrated high levels of poor and extremely poor psychological health.
2. No demographic variable showed a significant association with psychological health, indicating alcohol use is the main factor.
Conflicts of interest
The authors declare that there are no conflicts of interest regarding the publication of this manuscript.
References
- World Health Organization (1948) Preamble to the constitution of the World Health Organization. Geneva: WHO. Retrieved from https://apps.who.int/gb/bd/pdf/bd47/en/constitution-en.pdf
- Engel GL (1977) The need for a new medical model: A challenge for biomedicine. Science 196: 129-136. [Crossref]
- National institute on alcohol abuse and alcoholism (2021) Alcohol’s effects on the body. National Institutes of Health. https://www.niaaa.nih.gov/alcohols-effects-health/alcohols-effects-body
- Harm M, Hope M, Household A (2013) American psychiatric association, 2013, diagnostic and statistical manual of mental disorders, 5th edn, washington, dc: American psychiatric publishing.
- Koob GF, Volkow ND (2016) Neurobiology of addiction: A neurocircuitry analysis. Lancet Psychiatry 3: 760-773. [Crossref]
- Boden JM, Fergusson DM (2011) Alcohol and depression. Addiction 106: 906-914. [Crossref]
- Rehm J, Shield KD (2019) Global burden of alcohol use disorders and alcohol liver disease. Biomedicines. 7: 99. [Crossref]
- Grant BF, Goldstein RB, Saha TD, Chou SP, Jung J, et al. (2015) Epidemiology of DSM-5 alcohol use disorder: Results from the National Epidemiologic Survey on Alcohol and Related Conditions III. JAMA Psychiatry 72: 757-766. [Crossref]
- Dawson DA, Goldstein RB, Grant BF (2013) Prospective correlates of drinking and psychosocial functioning: Evidence from the national epidemiologic survey on alcohol and related conditions. Alcoholism: Clinical and Experimental Research 37: 1122-1133.
- King KM, Meehan BT, Trim RS, Chassin L (2013) Substance use and psychosocial functioning from adolescence to young adulthood: A latent variable model. Develop Psychopathol 25: 785-802.
- Sinha R (2008) Chronic stress, drug use, and vulnerability to addiction. Ann N Y Acad Sci 1141: 105-130. [Crossref]
- Rehm J (2011) The risks associated with alcohol use and alcoholism. Alcohol Res Health 34: 135-143. [Crossref]
- Rehm J, Hasan OS, Black SE, Shield KD, Schwarzinger M (2019) Alcohol use and dementia: A systematic scoping review. Alzheimers Res Ther 11: 1. [Crossref]
- Caetano R, Mills B, Harris T (2012) Education level and alcohol-related problems among adults. J Studies Alcohol Drugs 73: 101-110.