On the north coast of present day Peru flourished various relevant civilizations; among them the most important, from the point of view of metallurgical ability, was the Moche (100-600 A.D.).
The Moche metalworking ability was impressively demonstrated when Walter Alva and co -workers discovered in 1987 the “Tumbas Reales de Sipán” [1] and, more recently, when Regulo Franco Jordan discovered in 2005 the tomb of the “Lady of Cao” (Figure 1)s[2].
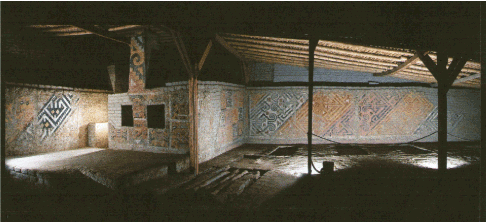
Figure 1. view of the tomb of the lady of Cao. The pyramid where the tomb was found is located several hundreds of meters from the Pacific Ocean, and a few km from Magdalena de Cao, which is about 60 km north from Trujillo.
Spectacular gold and silver funerary ornaments were excavated from this last tomb, and are now located in the site Museum of Cao, about 60 km north to Trujillo. Among these ornaments there are about forty nose decorations on gold and silver sheets, and about twenty ornaments on gold or silver. In all these artifacts, we have gold sheets having a thickness ranging from about 80 to about 150 µm, and silver sheets having ranging from about 100 to about 300 µm.
In order to determine the sheet thickness, transmission measurements were carried out, by using monoenergetic X –rays, while radiographs were employed to determine the thickness homogeneity, and to study the gold-silver interface, typical of about all nose decorations.
Transmission measurements
Transmission of monoenergetic X-rays allows to deduce information about the composition of an artifact, when its thickness is known, or to evaluate its thickness, when the composition is known. In the present case, the composition of the artifacts was determined with a portable device using energy-dispersive X-ray fluorescence (EDXRF)-analysis [3]. Then, the equipment used for EDXRF-analysis can be employed, by monochromatizing the X-ray beam with a secondary tin target. In such a manner, monochromatic tin K-lines are produced, having energy of 25.2 and 28.5 keV (Figure 2). The artifact to be measured is positioned between the Sn secondary target and the detector, and its thickness may be determined using, for example, the attenuation of Sn-Kα X-rays, or the ratio Sn(Kα/Kα°). The Sn(Kα/Kα°)-ratio versus artifact thickness d is shown in Figure 3, according to eq.:
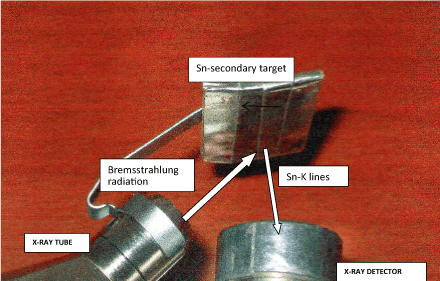
Figure 2. Experimental set-up for the attenuation measurements of Ag or Au-sheets. The X-ray tube emits bremsstrahlung radiation which is collimated and filtered. It induces photo-electric effect in the Sn-target, with emission of Sn-K rays, of 25.2 and 28.5 keV. The Ag or Au-sheet of unknown thickness and/or composition is put between the Sn target and the detector.
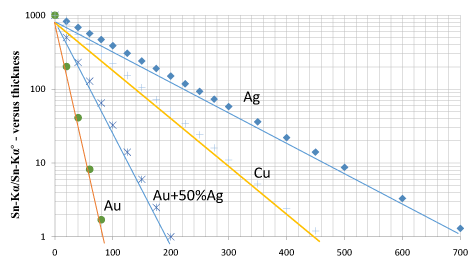
Figure 3. Sn-Kα/Sn-Kα° ratio versus thickness (in µm) calculated for absorbers of various thickness and composition.
 (1)
(1)
where:
Sn(Kα/Kα°) indicates the Sn-Kα line with and without absorber;
cAu , cAg indicate the concentration of gold and silver respectively.
Radiography
X-ray radiography is an imaging method that uses X-rays to reveal the structure of an object based on the different densities of its constituent materials. In the case of the objects from the tomb of the lady of Cao, we should consider the fact that the large majority of them are sheets basically on gold or silver-alloys, with an approximate thickness of about 100 μm for Au-layers and 200-300 for Ag-layers.
Radiographs were carried out with following portable equipment (Figure 4):
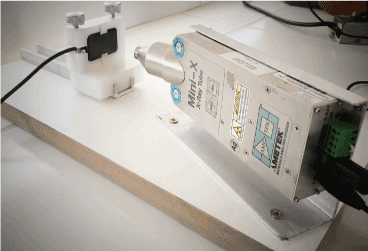
Figure 4. Equipment for radiographic images of the nose ornaments from the tombof theLady of Cao. On the left the dental flat panel detector produced by Schick, on the right the X-ray tube.
-a portable mini X-ray tube by AMPTEK, working at 50 kV and 100 μA maximum voltage and current;
-a flat panel detector by Schick Technologies;
-a Image analysis software ISEE
To image the Moche jewels under study the equipment worked at 25, 35, 45 and 50 kV. The first value appeared to be ideal to visualize the Ag-areas, while the last values (45 and 50 kV) were able to image the gold areas.

Attenuation measurements
Attenuation measurements may be summarized by Table 1. Values are not indicative of the whole object thickness, because of the relevant thickness variations inside the same object. Radiography is more significant for identifying thickness variations, even if it is not able to give a quantitative value to the thickness.
Table 1. thickness determination from attenuation measurements on gold and /or silver
Artifact and analyzed area |
dAu* |
dAu** |
dAg* |
PACEB-F4-00002 (huts) |
70 |
120 |
165 |
PACEB-F4-00003 (upper rectangle) |
180 |
210 |
275 |
PACEB-F4-00006 (bottom area) |
155 |
200 |
200 |
PACEB-F4-00008 (head of right prawn) |
65 |
200 |
165 |
PACEB-F4-00010 (body of iguana) |
140 |
170 |
125 |
PACEB-F4-00011 (left-middle area) |
110 |
110 |
85 |
PACEB-F4-00012 (half-moon) |
140 |
140 |
175 |
PACEB-F4-00013 (half-moon) |
100 |
335 |
360 |
PACEB-F4-00017 (upper right) |
100 |
195 |
240 |
PACEB-F4-00020 (body of animal left) |
135 |
205 |
275 |
PACEB-F4-00023 (tail of the snake) |
120 |
205 |
250 |
PACEB-F4-00029 (right bottom) |
175 |
140 |
115 |
PACEB-F4-00105 |
120 |
- |
- |
*from attenuation measurements
**from geometrical considerations, i.e. density = (mass/surface x thickness)
Radiographs
Inhomogeneity of Moche artefacts: The inhomogeneity of the Moche artifacts from the tomb of the lady of Cao can be visualized from almost all radiographs. A clear demonstration is shown in Figure 5, where a radiography and the related grey values of a small and flat ear-ring (PACEB-F4-0060) are shown. Because the gold-alloy composition was determined to be approximately constant by EDXRF-analysis, the differences in the grey values should be due to thickness differences only.
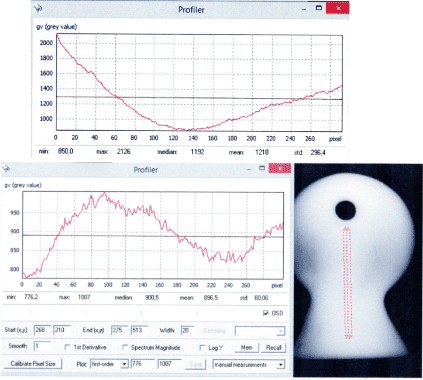
Figure 5. Radiographs of ear-ring F4-0060 and grey values along the black horizontal line (top curve) and along the red vertical line.
Gold-Silver junction by gluing: Concerning gold-silver interface, the radiography of nose ornament PACEB-F4-00002 (Figure 6) is shown in Figure 7, where a silver hat is glued to a gold body. This procedure of gluing together gold and silver foils was point out in a few other cases among the nose ornaments, and is possibly related to the oldest artifacts.
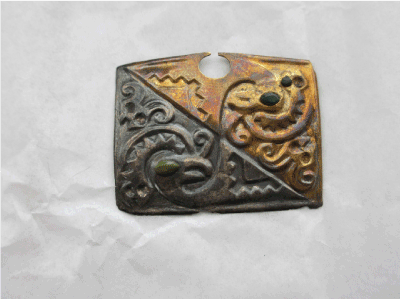
Figure 6. Nose ornament PACEB-F4-00006 made of a silver sheet superimposed to a gold sheet.
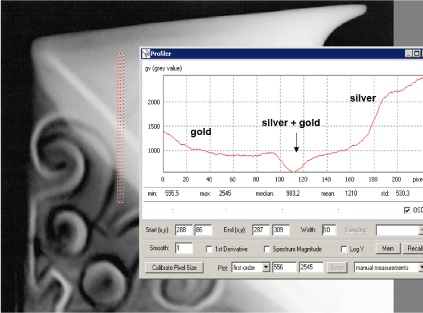
Figure 7. Radiography of nose decoration PACEB-F4-00006 (see Figure 3.5), showing the interface between gold, strongly attenuated with a lower GV and silver, less attenuated. The “negative peak” indicates the area where Au and Ag were glued.
Gold-Silver ju2021 Copyright OAT. All rights reserve decoration PACEB-F4-00106 (Figure 8) was radiographed in the interfaces silver heads- gold body or gold crown. A brazing procedure may be hypotized, because of the presence of additional silver in the interface, as clearly shown in Figure 9. A fracture is clearly visible in the Au-Ag interface of the same artifact (Figure 10). Several other artifacts shown a similar behavior.
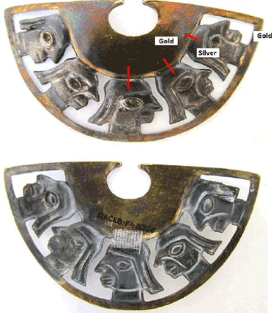
Figure 8. nose decoration PACEB-F4-00106, front and rear side.
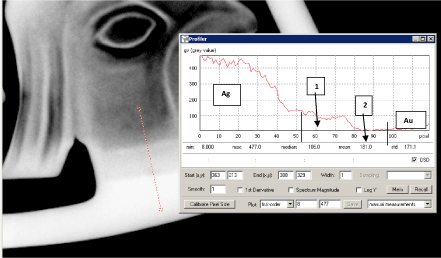
Figure 9. Nose decoration PACEB-F4-00106. Radiography of the first Ag-head from the right and interface gold-silver, showing brazing with Ag (between the two vertical lines, 1 : Ag+Ag (brazing) ; 2 : Au+Ag (brazing).
Gold-Silver junction using mercury amalgam: In the case of nose ornament PACEB-F4-00011, shown in Figure 11, a systematic presence of relevant quantities of mercury was detected in the interface Au-Ag region, and only in the interface. A scanning along the red line of figure 10 is also shown in Figure 12. In the interface, the presence of additional silver in gold, and additional gold in silver may be hypnotized from this curve. A similar behavior was observed in a simulated sample of Ag-Au sheets joined together with a Hg amalgam, and in a large part of the nose decorations. It may be supposed that this method was largely employed in more recent times. Mercury amalgam was never before observed in the New World [4].
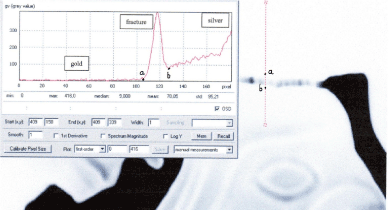
Figure 10. Radiography of the central head of nose decoration F4-00106 ; in the enclosed curve the Grey values in the interface between silver head and gold body. The position of a fracture is clearly visible.
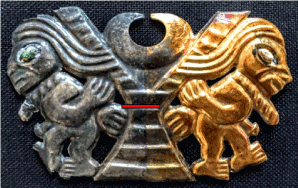
Figure 11. Front side of nose ornament PACEB-F4-00011, composed of two sheets on Ag and Au, joined together. Along the red line in the upper figure, it was observed the systematic presence of mercury, demonstrating a gold-silver-mercury amalgam.
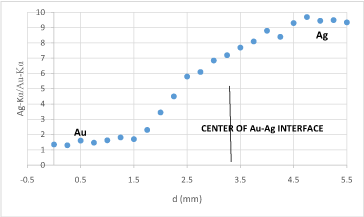
Figure 12. EDXRF- scanning and ratio of Au/Ag counts along the red line shown in Figure 11. The behavior of this ratio is the same as that observed in the case of a simulation carried out on a Au sheet joint to a Ag sheet by using liquid mercury. The effect of mercury interests a width of about 1.5 mm inside Ag and Au respectively. The swelling in the interface is due to the mixing of Ag to Au alloys.
- Alva W (2004) SIPAN: descrubrimiento y investigation, Quebecor World Perù S.A.
- Regulo Franco Jordan (2008) in “Señores de los reinos de la luna”, Ed. Krzysztof Makowski, Banco de Crédito del Perù, Lima 280-287.
- Cesareo R, Franco Jordan R, Fernandez A, Bustamante A, Fabian J, et al., (2016) Analysis of the spectacular Gold and Silver from the Moche tomb señora de Cao. X-ray Spectrometry 43: 138-154.
- Scott DA (2000) A review of gilding techniques in ancient South America in Gilded Metals: History, Technology and Conservation, Eds. Drayman-Weisser Archetype 203-222.


