Experimental evidence indicates that cells under irradiation induce in the neighbor nonirradiated cells the same biological effects affecting the irradiated ones. This is the so-called bystander effect. Up to now in the scientific literature this kind of effect does not appear to be fully understood, even if several experiments show evidence of its existence. It would be reasonable that bystander effect takes place by means of paracrine chemical transmission mediators that would be broadcasted by the damaged cells to the surrounding cells. Furthermore, a subset of a special class of signaling proteins, namely the cytokines, are probably the very ones involved in such signaling phenomenon. Among them, Tumor Necrosis Factor (TNF) is a particularly relevant protein belonging to the class of cytokines, because it is known to contribute to mediate various relevant cell functions, like apoptosis, the programmed cell death. As a molecule, TNF is quite interesting, because it can issue two opposite signals through different intracellular molecular signaling chains. One signal induces apoptosis, while the other is opposite, inducing the cell resistance to apoptic signals. The crucial point is thus to understand what makes each of such two signals masking the other. Thus, a mathematical model related to the TNF signaling pathway is of interest, paying special attention to the study of the TNF reception mechanisms by cells that are not passed through by the radiation beam. In this work, we present a new mathematical model of cellular apoptosis - mediated by TNF - and its validation based on data existent in literature. The model that we present will result to be a stable model with respect to large variation of the parameters and simplified with respect to other models already existent.
cellular Apoptosis; Tumor Necrosis Factor (TNF); cytokines
In Radiobiology (field of science that studies the biological effect of ionizing and non-ionizing radiation on cells) the bystander effect is the phenomenon inducing unirradiated cells to exhibit irradiated effects because of signals received from nearby irradiated cells. Radiation-induced bystander effect is defined as induction of biological effects in cell that are not directly traversed by a charged particle but are receiving signals from the irradiated cells that are near them [1]. Bystander effect is thus defined as non-irradiated cells response to signals produced by neighboring irradiated cells [2]. The bystander effect have many consequences such as genomic instability pertaining the nucleus (that will not be discussed in this paper), and Apoptosis pertaining the cytoplasm, that is the object of this paper. In the scientific literature this kind of effect does not appear to have been fully understood, even if several experiments show evidence of its existence. One of the most representative experiments sounds as follows: cell population becomes radiated, then its culture medium is conveyed to another environment where non-radiated cells live; afterwards the non-radiated cells show to suffer the same types of effect as the radiated cells. Such effect is detected even if the power of the ionizing radiation is small. The action mechanism of the bystander effect is intended to be the diffusion of one or more factors from the irradiated cells to the surrounding non-irradiated ones. Such factors bound (at the membrane level) with the conjugate receptors of the target cells. Such a signaling triggers a series of different phenomena among whom genomic instability, and especially Apoptosis are of our main interest. One of the key point is thus to understand what kind of mediator\mediators is\are responsible for the bystander effect. One of the most accredited hypothesis is that the bystander effect takes place by means of a special class of signaling proteins, namely the cytokines: among them, Tumor Necrosis Factor (TNF) seems to be the most relevant protein because it is known to contribute to mediate various cell functions, like cell survival and proliferation, or apoptosis (the programmed cell death) [3-6]. Thus, a mathematical model related to the TNF signaling pathway is helpful to increase our understanding of the underlying biological processes, allowing us to organize existing information from experimental studies and to identify the gaps in our understanding of TNF pathway. In Sec. II, a short review of TNF biology leading to our mathematical model, will be given as well as a mathematical model of TNF cytotoxicity will be presented, including: the building of a model; its review and simplification; and the final model. In Sec. III the simulation results (using initial conditions and parameters taken from literature and reported in the same section) will be presented and then deeply discussed. The Sec. IV will be mainly focused on discussion and on robustness simulation to better understand both strengths and weaknesses of the proposed model. The conclusion, summarizing the main results of the simulations, as well as the comparison with respect to other models, will be discussed in sec. V.
For the sake of clarity, here we briefly review the basic facts known about TNF, to understand the ground of the model that will be presented in this paper. What follows can be found in more detailed reviews such as [7]. Tumor necrosis factor (TNF) was isolated based on its capacity to kill tumor cells in vitro and to produce hemorrhagic necrosis of transplantable tumors in mice [8,9]. TNF is a molecule that binds to two different receptors: TNFR1 and TNFR2 [7]. Among them TNFR1 appears to be the key mediator in signaling in both normal and tumor cells; for this reason, the large amount of the models is focused on this receptor. TNFR1 has three subunits, whose cytoplasmic tails need to be juxtaposed to trigger intracellular signaling. The signaling pathway has a role of a double-edge sword [10]: it is implicated in tumorigenesis, transplant rejection, septic shock, and in others activities. More commonly, the binding of TNF-α to its receptors can activate two major transcription factors, AP-1 and NF-kB, inducing inflammatory responses. Furthermore, TNF-α can induce an apoptotic response, usually dependent on inhibition of RNA or protein synthesis. Binding of TNF to TNFR1 initiates a series of biochemical events in the cell that take place at the cytoplasmic tails of the receptor subunits and at their specialized domains called Death Domains (DD). DD recruit the adaptor protein TRADD that acts as an assembly platform for at least two other proteins, RIP-1 and TRAF-2 initiating the survival arm (on the left in Figure 1). Such multiproteic complex initiates the signaling cascade resulting in NF-kB activation and hence gene activation and cell survival [4,5,7]. Among the genes that are expressed after the NF-kB activation, there are those that code for the two proteins FLIP and IAP that inhibit the TNF apoptotic pathway. Regarding the TNF apoptotic pathway, it has been demonstrated that this is initiated by TNF-TNFR1 complexes internalized into endocytic vescicles [11]. At this deeper intracellular level, the multiproteic complexes associated to the receptors’ tails modify, and form the Death Inducing Signaling Complex (DISC), whereby TRADD recruits
FADD (Fas-Associated protein with Death Domain) and pro-caspase-8. Such caspase then triggers the irreversible pathway leading to apoptosis and cell death. Both the NF-kB and the apoptotic pathways comprise a series of complex intracellular reactions involving several enzymes and substrates [4,5,7]. Current biological data indicate that activation of NF-kB and caspases occurs at different sites in the cells (at the cell membrane and upon internalization in endosome, respectively). The transcription factor NF-kB has been shown to be predominantly localized at cytoplasmic level in its inactive form, i.e., in the absence of an inductive signal. Cell stimulation with TNF-α can induce the degradation of IkB, the inhibitor of NF-kB, allowing nuclear accumulation of NF-kB and regulation of specific gene expression. Although Caspase-8 has the capacity to localize to several different cellular locations, activated Caspase-8 have predominantly a cytosolic localization.
Figure1. Summarizes the above reported basics of TNF biology grounding our model. All quantities between square brackets are molar quantities (Table 1) and k’s are kinetic constants with the meanings shown in Table 2. To have a better understanding of Figure 1 we want to underline two general concepts:
Table 1. Legend of the species involved in the system.
R |
Free TNFR1 at cell membrane |
L |
Free TNF |
TTR |
R + L |
F |
Free FLIP |
C |
Free Caspase-8 |
COUPLING |
TTR + C + F |
TTRF |
TTR + F |
NFkB |
Activated by TTRF + F (survival complex) |
TTRC |
TTR + C |
Apoptosis |
Activated by TTRC + C (death complex) |
f(t) |
Survival fraction at time t |
Table 2. Kinetic parameters involved in the system.
Vr |
Zero-order rate of insertion of receptors R into the membrane |
kd |
Turnover constant of ligand-free receptors R |
L0 |
Zero-order rate of arriving of free TNF |
VinF |
Zero-order rate of arriving of free F |
VinC |
Zero-order rate of arriving of free C |
koffTTR |
Dissociation rate constant of TTR giving free TNF and TNFR1 |
kdegTTR |
Rate of degradation of TTR |
konLR |
Association rate constant of L and R giving TTR |
konTTRC |
Association rate constant of TTR and C giving TTRC |
konTTRF |
Association rate constant of TTR and F giving TTRF |
koffTTRC |
Dissociation rate constant of TTRC giving TTR and free C |
koffTTRF |
Dissociation rate constant of TTRF giving TTR and free F |
konCoTTRCF |
Association rate constant of TTRC and F giving COUPLING |
konNFkB |
Association rate constant of TTRF and F activating NFkB |
koffNFkB |
Dissociation rate constant of NFkB giving TTRF and free F |
kdegNFkB |
Rate of degradation of NFkB |
koffFCo |
Dissociation rate constant of COUPLING giving TTRC and free F |
konCoTTRFC |
Association rate constant of TTRF and C giving COUPLING |
koffCCo |
Dissociation rate constant of COUPLING giving TTRF and free C |
konATTRC |
Association rate constant of TTRC and C giving Apoptosis |
kdeg |
Rate of lysosomal degradation of the death complex |
k |
“death affinity” |
• all k’s constants (on\off) are rate of association\dissociation constants giving the information on the speed of association or dissociation reaction;
• all k#deg’s constants are the degradation rate of the element #.
In the upper part of Figure 1 the interaction is schematized between TNF (L) and TNFR1 (R) giving the composite TTR. Starting from this point one can clearly see the branching of two ways:
• the “survival way” represented by composite TTRF (interaction of FLIP with TTR, makes the equilibrium unbalanced toward survival against death);
• the “death way” represented by composite TTRC (interaction of Caspase-8 with TTR, makes the equilibrium unbalanced toward death against survival).
konTTRF and konTTRC are thus two key parameters, because they regulate not only the access to the two ways a higher value of konTTRF with respect to konTTRC leads to an increment in cell survival (and viceversa) - but also regulate the sensibility of the cell survival fraction with respect to a variation of every parameter affecting the lower part of each of the two ways. To better understand this point one can think that, for example, for very low value of konTTRF (0 in the extreme case) with respect to konTTRC, the major part of the composite TTR tends to bound to Caspase-8: thus the survival way is practically “close”, and as a result, we expect that a variation of some parameters in such a way (e.g. koffNFkB, konNFkB, ecc..) will not significantly affect the cell survival fraction f(t). Thus, it should be interesting to see the evolution of the survival cell fraction with respect to a variation of konTTRF vs. konTTRC, as it will be shown in Fig. 10 on page 12 pertaining sub-subsection II within subsection B (robustness) of simulation section IV. Another important parameter is kdegTTR that models the lysosomal degradation of TTR. A high value for this parameter will result in an increased cell resistance to apoptic signal. In the lower part of Figure 1 one can see the end of the two ways: on the left the survival way ends with the activation of NFkB (by interaction of FLIP with TTRF), while on the right side the death way ends with the activation (by interaction of Caspase-8 with TTRC) of a composite here schematized as Apoptosis. In such death, leading pathway konATTRC, as well as kdeg, plays a crucial role in cell fate: a small value of konATTRC indicates a low affnity of the composite TTRC in bonding to Caspase-8, thus resulting in an increasing cell resistance. The same effect is expected for a high value of kdeg, that is the degradation term of apoptotic complex, and plays an opposite role in cell survival\death with respect to konATTRC. We want to underline that, as it can be seen in Figure 1, the survival way is bidirectional while death way is not. This will not imply that at the end all the ways will lead to death, because of the terms kdeg and kdegNFkB. To conclude it is also important to notice that the possible coupling between the two ways is considered by means of the composite named COUPLING. It allows to consider a new detail in the TNF pathway, not present in our preliminary suggestion [12], nor in [13], but it also significantly increases the number of parameters present in the model. Thus, at this stage, we decided to postpone the simulation of the complete model depicted in Figure 1 to a future paper, then limiting here ourselves to a simplified model like the one published in [13], with respect to whom we will be able to obtain comparable results with the need of much less parameters. Because of the extreme complexity of TNF pathway (yet not completely understood) and of a lot of cross talk between TNF-mediated apoptosis, NF-kB, JNK and other pathways on apoptosis such as AKT pathway, we reported a simple and minimal but effcient model. Starting from Figure 1 we can thus build a mathematical model that is simpler than [13] without losing the main biological details like in [12] (then presented without substantial variations in [14]). This is a twostep process:
• to build a general model of TNF cytotoxicity;
• to simplify the model, making some biological assumptions, to make the model less computationally burdening, to be able to simulate it without the help of supercomputing.
Figure 1. General scheme of TNF mediated cellular apoptosis
A. Building of the model
In this section, we present a general model of TNF mediated cellular apoptosis. Such a model is built translating into equations the scheme in Figure 1:
 (1)
(1)
 (2)
(2)

(3)

(4)

(5)

(6)
 (7)
(7)

(8)

(9)
 (10)
(10)
 (11)
(11)
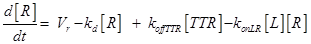
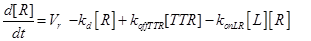
Eq.(1) describes the dynamics of TNFR1. The two parameters Vr and kd - introduced in [15] and already used in [12] describe “the zero-order rate of insertion of receptors into the membrane and the turnover rate constant of ligand-free receptors” respectively. In case of absence of TNF the concentration of TNFR1 at the cell surface (in steady state) is given by:
 (12)
(12)
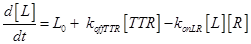
The term −konLR[L][R] describes the association between TNF and its free receptor. The minus sign is because the association between these two components decreases the concentration of free TNF and TNFR1. The same term is also present in eq (2). The +koffTTR[TTR] describes the dissociation rate of TTR and is present obviously with “+” sign also in eq (2) and with “-” sign in eq.(3) for the reasons just explained above.
All the other equations are built following the same philosophy.
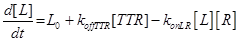
Eq (2) describes the dynamics of TNF. The term L0 is the constant rate of arrival of free TNF.
Eq (3) describes the binding kinetics of TNF\TNFR1. The term −kdegTTR[TTR] considers the possible degradation of this compound: thus, a high value of kdegTTR results in an increasing resistance of the cell to Apoptosis.
Eq (4) describes the dynamics of FLIP. The term VinF is a constant rate of arrival of free FLIP that once bound to TTRF activates NFkB and starts the survival pathway of the cell.
Eq (5) describes the dynamics of COUPLING that is a compound that models the possible coupling between the two ways (survival and death).
Eq (6) describes the dynamics of Caspase-8, that once bound to TTRC starts the irreversible death pathway of the cell. Eq (7) describes the dynamics of the survival complex NFkB. The term −kdegNFkB[NFkB] considers the possible degradation of this complex.
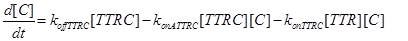
Eq (8) and (9) describe the dynamics of the intermediate complexes TTRC and TTRF.
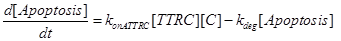
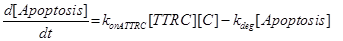
Eq (10) describes the temporal evolution of the death complex. The term −kdeg considers the possible lysosomal degradation of this complex: thus, a high value of kdeg results in an increasing resistance of the cell to Apoptosis.
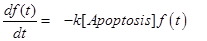
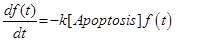
The last equation, (11) already introduced in [12] describes the temporal evolution of the surviving fraction f(t).
B. Review and simplification of the model
From a mathematical point of view the model consists of 11 non-linear first order differential equations with 23 parameters, most of whom never experimentally measured. Because of the huge number of free parameters, before proceeding with the simulations we try to simplify the model on a biological basis and existent literature (see for example [13]).
As a first assumption we consider an “isolated system” from the TNF, FLIP and Caspase-8 point of view: thus, we can put L0 = VinF = VinC = 0. In this case the crucial role in cell survival\death is played by initial conditions and parameters, since no TNF, FLIP or Caspase-8 are entered the system after t=0.
As a second assumption, we consider the death way and survival way completely independent (as considered in [13]). Thus we can completely remove eq.(5), and all the kinetic parameters connected to it (konCoTTRCF, koffFCo, konCoTTRFC, koffCCo and koffFCo) can be set to 0.
The resulting model can be schematized as in Figure 2 and resumed in the following equations:
Figure 2. Simplified scheme of TNF mediated cellular apoptosis utilized for the simulations.
 (13)
(13)
 (14)
(14)

(15)
 (16)
(16)
 (17)
(17)
 (18)
(18)
 (19)
(19)
 (20)
(20)
 (21)
(21)
 (22)
(22)
The resulting model consists in 10 differential equations with 15 kinetics parameters and therefore it is possible to simulate it without supercomputing, differently from the complete model presented in the previous section.
In this section the models and some of the simulations presented in [12] and [13] will be used as a term of comparison for the simulations results of our model. To simulate the model, we need the initial conditions and kinetic parameters. Some of the parameters are taken from [12] and [13], as for example Vr,kd,konLR,koffTTR,kdegTTR and k. Since the model is structurally different, and at a different level of abstraction (intermediate with respect to the lower detail in [12] and the higher detail in [13]), we cannot take all the parameters from these models and compare all the results. One way to avoid this problem, and get a reasonable guess for all the parameters, is to look to the equations of our model with respect to the equations of the two cited models, and try to understand the underlying biological meaning, to find a sort of “contact points” between the equations. Thanks to the stronger bond to the biological reality of our model with respect to [12], we can find many of these contact points with [13] in terms of common equations\parameters. An example of this kind of parameter is kdeg that can be taken as kdeg = k19 + k20 (in [13]), since the equation describing c21 (death complex) dynamics in [13] can be loosely identified with our eq. (21) and the term − (k19 + k20) c21 be lysosomal degradation of this complex. The same can be done for konATTRC,koffNFkB,konNFkB,koffTTRF. The remaining parameters are identified by fitting the temporal evolution of death and survival complexes in [13]. This was done for TNF (0) = 1nM as shown in figures 3(a) and 3(b). Initial conditions and kinetic parameters reported in Table 3, 4 are then used to perform all the simulations.
Table 3. Initial conditions of the species involved.
Species |
Initial Value (nM) |
R |
100 |
L |
a (this parameter change during simulations) |
TTR |
0 |
F |
100 |
C |
80 |
TTRF |
0 |
NFkB |
0 |
TTRC |
0 |
Apoptosis |
0 |
Survival fraction
f(t) |
Initial Percentage
1 |
Table 4. kinetic parameters values. First order constants are in s−1 while second order constants are in nM−1s−1
Vr |
1·10−3 |
kd |
1.67·10−3 |
koffTTR |
1.25·10−6 |
kdegTTR |
2.67·10−3 |
konLR |
185·10−6 |
konTTRC |
750·10−6 |
konTTRF |
580·10−6 |
koffTTRC |
0.3·10−6 |
koffTTRF |
1.25·10−6 |
konNFkB |
185·10−6 |
koffNFkB |
371.25·10−6 |
kdegNFkB |
3.5·10−4 |
konATTRC |
500·10−6 |
kdeg |
300·10−6 |
k |
6.7·10−4 |
Figure 3. Death\survival complex temporal evolution for 1nM of TNF (0)
Simulations show that even if dramatically simplified, the proposed model inherited the significant properties of the more detailed model presented in [13]. Figures 4(a) and 4(b) show the comparison between the temporal evolution of the death and survival complexes simulated with either our model or model [13], computed for 5 and 10nM of TNF (0). The two models keep agreeing at different TNF (0) values.
Figure 4. Death\survival complex temporal evolution for 5nM and 10nM of TNF (0)
Figure 5 shows the temporal evolution of the surviving fraction computed for all the three values of TNF (0). The surviving fraction decreases as the TNF (0) increases.
Figure 5. Surviving fraction temporal evolution computed with our model for 1 (blue), 5 (green), 10 nM (red) of TNF (0).
Figure 6 shows the TNF cytotoxicity as a function of both TNF concentration and time. There is a saturation effect in the survival fraction in both concentration and time. Results are in good agreement with [12]. The apparent minimum in Figure 6 around TNF (0) =100nM, for all the observation times, has probably no biological meaning, being more likely a mathematical artifact illustrating one limit of the proposed model at the boundary of its validity: in the following robustness analysis, the behavior of konTTRF will confirm such boundary limits. There is thus probably no biological explanation for this kind of behavior, but there is a mathematical one: since to perform these simulations we are using parameters already present in literature, some of them are at the boundary of validity for our model (see e.g. konTTRF in sec. IV): thus, little unexpected behavior or oscillations can arise. In this case the undershoot is negligible and the results shown in Figure 6 are still to be considered acceptable.
Figure 6. Computing TNF cytotoxicity as a function of both TNF concentration and time.
As discussed in the previous sections (in III) the results of the simulation of our model are compared with respect to the results showed in [12] and [13]. Simulations showed that even if our model is simplified, the proposed model inherited the significant properties of the more detailed model presented in [13] keeping the computational complexity at a reasonable level. Furthermore, the limits of the model were deeply investigated to understand the boundaries of validity of the model in terms of parameter values.
A. Limits of the model: an example
The model that we presented shows some computational limits for certain values of the parameters. For example, Figure 7 shows an unexpected behavior for lower values of konttrf; in fact, for these values of konttrf we see a new rise in cell survival even for increasing level of TNF (0). Such a behavior is probably related to the already reported curious non-monotonic decay in Figure 6. This is most likely not correct, and can thus be considered one of the limits of validity of the model for this parameter.
Figure 7. Surviving fraction computed varying TNF (0) and konttrf
B. Robustness simulations
As already mentioned, experimental determinations of the parameter values for intermediate binding reactions are not available. Moreover, the small number of available experimental data did not allow us to estimate the error bounds for the parameter values. Because of these problems our aim is to test the stability of our model (i.e., if the model gives reasonable results or fail) over a wide range of parameter values, instead of concentrate ourselves on the accurate determination of the parameters themselves, thus providing a useful tool for the simulation of cellular Apoptosis in many possible different experimental conditions.
1. ∆parameter vs. ∆TNF (0)
In this section, we report the results of such simulations plotting the survival fraction after 48 hours (transient already ended) and\or 1 hour (during transient). Both the initial condition of TNF (0) and some key parameters of the model vary over several decades, with discretization of 40 logarithmic spaced samples over the whole range, around the “nominal value” given in the previous sections. In Table 5 the parameters values are reported, used in all simulations, of whom only the more significant ones are reported in the following.
Table 5. kinetic parameters values. First order constants are in s−1 while second order constants are in nM−1s−1
Inital Condition |
Range |
TNF (0) |
Logspace (-2,3.5) |
Kinetic Parameter |
Ranges |
konattrc |
Logspace (-7,-4) |
k |
Logspace (-4.5,1) |
kdeg |
Logspace (-7,-3) |
konNFkB |
Logspace (-6,-3) |
koffNFkB |
Logspace (-6,-3) |
konttrc |
Logspace (-6,-3) |
koffttrc |
Logspace (-8,-4) |
konttrf |
Logspace (-6,-2) |
koffttrf |
Logspace (-8,-4) |
kdegttr |
Logspace (-5,0) |
Increasing TNF (0) always leads to an increment of the cell death. Figure 8 shows that an increasing value of konattrc leads to an increasing value of cell death, as expected from the model, as well as to a difference in the survival fraction.
The clear difference between Figure 8(a) and 8(b) is due to the different simulation time (1h and 48h). In fact, for 1h of simulation time we can consider that the system is still evaluating (simulation time shorter than time constants present in the system, e.g. k’s) thus only higher values of konattrc lead to an indicative fraction of cell death. On the contrary, for 48h of simulation time, the system can be considered “in steady state” (simulation time much longer than time constants present in the system): thus, only lower values of konattrc lead to an increasing value of cell survival.
Figure 8. Surviving fraction computed varying TNF (0) and konattrc
Figure 9 can be understood if one looks at the value of konttrc, and realizes that this is the parameter that “regulates the access” to the apoptotic way. A high value of konttrc with respect to konttrf means that all the parameters variations in the survival way do not significantly affect the solution.
Figure 9. Surviving fraction computed varying TNF (0), koffnfkb and konnfkb
2. ∆parameter#1 vs. ∆parameter#2
In this section the results are shown about the survival fraction, when varying two parameters across several decades (resolution is 40 points) around the “nominal value” given in the previous sections, for the initial condition of TNF (0) = 10nM. In Tab. VI the parameters values are reported that are used to generate all the figures. Figure 10 refers to a variation of konttrc and konttrf: thus, this figure shows clearly the competition between the two ways. As expected a high value of konttrc with respect to konttrf leads to an increasing value of cell death, and vice versa.
Figure 10. Surviving fraction computed varying konttrf and konttrc
A new general mathematical model of TNF cytotoxicity has been presented and discussed. The model has been simplified and simulated under the main biological assumptions that the survival and death ways are completely independent, and that the system must be considered completely isolated with respect to Caspase-8, TNF and FLIP. The final model results to be less computational demanding with respect to [13] but not oversimplified as the one presented in [12] and discussed in [14]. Despite to its simplicity, the results of our model are in good agreement with [13]. We want to stress that with “good agreement” we intend that the functional form of the common outputs of our model (death\survival complex) and of the model [13] are nearly the same, even if the two models are structurally different: thus, the meaning of some of the involved parameters are different.
Table 6. Initial condition is in nM. The first order rate constant have units of s−1 and the second order rate constants have units of nM−1s−1.
Inital Condition |
Value |
TNF (0) |
10 |
Kinetic Parameter |
Ranges |
konttrf |
Logspace (-6,-1) |
koffttrf |
Logspace (-7,-1) |
konttrc |
2021 Copyright OAT. All rights reserv
Logspace (-8,-4) |
koffttrc |
Logspace (-8,-4) |
konNFkB |
Logspace (-6,0) |
koffNFkB |
Logspace (-6,0) |
kdeg |
Logspace (-8,-3) |
konattrc |
Logspace (-8,-3) |
We have extensively explored the parameters space (robustness simulation) of the model: the simulations show that the model has a stable behavior for a broad range of parameter values and that no unexpected patterns (such as oscillations) emerge, except for the one shown in Figure 7 (and possibly the one occurring in Figure 6).
Our model (as the one presented in [12]) is not specific for a given cell type: then it could be used to simulate effects of TNF in most cell types, thus quite independently of the experimental settings.
It is important to underline that in our model there is no switching mechanism that selects cell survival or death signals, but rather a balance between the two pathways that produces partial cell killing, even for long lasting and intense TNF treatments. The equilibrium between the pathways might further be balanced in favor of cell survival or death in real cells by increasing\decreasing the degradation terms and association\dissociation rate constants (as well as by re-integrating the here not yet fully discussed COUPLING pathway).
To conclude we would like to propose new experimental campaigns to measure the temporal evolution of some output of the model (such as survival fraction, survival complex, death complex,), for instance varying the temperature. The aim of such campaigns would be to understand if there is a substantial modification in TNF cytotoxicity in terms of functional form of the outputs, or only a simple change in the “temporal constants” (k’s factors). In the second case, our model will acquire an even more general validity.
The authors wish to thank Annalisa Zappavigna for her help in mathematical modeling and Andrea Citrolo for his help in data finding and valuable discussions about the final model.
- Zhou H, Ivanov VN, Yu-Chin Lien, Davidson M, Hei TK (2008) Mitochondrial function and nuclear Factor-kB-Mediated Signaling in Radiation-Induced Bystander Effects. Cancer Res 68: 2233-2240. [Crossref]
- Prise KM, O’Sullivan JM (2009) Radiation-induced bystander signalling in cancer therapy. Nature Rev Cancer 9: 351-360.
- Tracey KJ, Cerami A (1993) Tumor necrosis factor: a pleiotropic cytokine and therapeutic target. Annu Rev Med 45: 491-503. [Crossref]
- Ashkenazi A, Dixit VM (1998) Death receptors: signaling and modulation. Science 281: 1305-1308. [Crossref]
- Wallach D, Varfolomeev EE, Malinin NL, Goltsev YV, Kovalenko AV, et al. (1999) Tumor necrosis factor receptor and Fas signaling mechanisms Annu Rev Immunol 17: 331-367. [Crossref]
- Locksley RM, Killeen N, Lenardo MJ (2001) The TNF and TNF receptor superfamilies: integrating mammalian biology. Cell 104: 487-501. [Crossref]
- Wajant H, Pfizenmaier K, Scheurich P, (2003) Tumor necrosis factor signaling. Cell Death Differ 10: 45-65. [Crossref]
- Carswell EA, Old LJ, Kassel RL, Green S, Fiore N, et al. (1975) An endotoxin-induced serum factor that causes necrosis of tumors. Proc Natl Acad Sci U S A 72: 3666-3670. [Crossref]
- Pennica D, Nedwin GE, Hayflick JS, Seeburg PH, Derynck R, et al. (1984) Human tumor necrosis factor: precursor structure, expression and homology to lymphotoxin. Nature 312: 724-729. [Crossref]
- Aggarwal BB, (2003) Signaling pathways of the TNF superfamily: a double-edged sword. Nat Rev Immunol 3: 745-56. [Crossref]
- Schneider-Brachert W, Tchikov V, Neumeyer J, Jakob M, Winoto-Morbach S, et al. (2004) Compartmentalization of TNF receptor 1 signaling: internalized TNF receptosomes as death signaling vescicles. Immunity 21: 415-428. [Crossref]
- Chignola R, Farina M, Liberati D, Del Fabbro A, Milotti E, (2009) Balance between cell survival and death: a minimal quantitative model of tumor necrosis factor alpha cytotoxicity. http://arxiv.org/abs/0905.4396v1,.
- Rangamani P, Sirovich L, (2007) Survival and apoptic pathways initiated by TNF-α: modeling and predictions. Biotechnol Bioeng 97: 1216-1229. [Crossref]
- Chignola R, Vyshemirsky V, Farina M, Del Fabbro A, Milotti E, (2011) Modular model of TNF-α cytotoxicity. Bioinformatics 27: 1754-1757. [Crossref]
- Bajzer Z, Myers AC, Vuk-Pavlović S, (1989) Binding, internalization and intracellular processing of proteins interacting with recycling receptors. A kinetic analysis. J Biol Chem 264: 13623-13631. [Crossref]