Abstract
Studies have reported associations between ambient air pollution exposure and occurrence of various skin diseases. In addition, a few epidemiological studies also indicated associations of air pollution exposure with cellulitis. The purpose of this multi-city study was to examine potential associations between emergency department (ED) visits for skin conditions and ambient air pollution concentrations. The study was conducted using the data for the period from April 2004 to December 2011 in nine cities across the province of Ontario, Canada. ED visits for skin conditions were retrieved from the National Ambulatory Care Reporting System using the International Classification of Diseases, ICD-10 codes: R20, R21, and for cellulitis L03, L25.9, and L50.9. For this study, a case-crossover design was applied. Conditional logistic regression was used to realize statistical models. Temperature and humidity in the form of natural splines were used as cofounders. Odds ratios and their 95% confidence interval have been calculated for one unit increases in the interquartile values of considered air pollutants. For cellulitis (N=252,799), significant positive results were observed for O3 for lags 1, 4 and 5 days among females. For males, statistically significant positive results were observed for PM2.5 for lags 3 to 6. For other skin conditions (N=201,571), significant positive results were also observed in females for PM2.5, for lags 2 to 8 days; for O3, for lags 0 to 2 days; and, for NO2 and SO2, for lags 6 to 8 days. For males, PM2.5 remained positive among all lags, and was statistically significant for lags 4 and 6 days. Our findings support the associations between air pollutants and ED visits for cellulitis and other skin conditions.
Key words
air pollution, case-crossover, cellulitis, exposure, ozone, skin condition, multi-city study
Introduction
The human skin is the body’s first and main barrier of defense against environmental stressors such as air pollution and ultraviolet irradiation (UV) [1]. The upper layer of the epidermis is mainly one of the first and major targets of air pollutants. Ground-level ozone (O3) is one of the most reactive environmental oxidants and the main component of photochemical smog. Many studies have shown that O3 affects respiratory health [2-11], is a risk factor for respiratory conditions such as asthma [12,13] and may even be linked to non-respiratory conditions [13-16]. Moreover exposure to ambient O3 has been associated with skin stress-responses and also various skin conditions [17-20] including cellulitis [21,22]. Human skin acts as a protective and active biological shield against pro-oxidative chemical products and air pollutants [23]. Exposure of the skin to ambient air pollution may have negative impact on the skin health condition and affect skin homeostasis.
In this study short-term exposure to ambient air pollution is considered. The aim of this study was to investigate potential correlation between ambient air pollution exposures, especially ozone, and emergency department (ED) visits for skin conditions during the period from April 2004 to December 2011 in nine cities across the province of Ontario, Canada: Algoma (district), Halton (municipality), Hamilton, London, Ottawa, Peel (municipality), Toronto, Windsor and York. It has been shown that results from multi-city studies are more reliable and are less susceptible to biases than those from single locations [24].
In this study ED visit for cellulitis were investigated separately as this skin condition is caused by bacteria infection. Therefore it is possible that ambient air pollution exposure may affect skin barrier function and allow exogenous bacteria to penetrate in the cutaneous tissues. In addition, recent studies have documented a strong correlation between cellulitis and ozone exposure for the parts of cutaneous tissues that are less covered by clothes [21]. The hypothesis that stronger associations for cellulitis are observed in area that are in direct contact with air pollutants was proposed and verified by the first author of this work [21].
In this study, a case-crossover (CC) technique was used to evaluate any potential association between emergency department ED visits for cellulitis and other skin conditions with ambient air pollution [25]. The CC method allows to adjust the results for time trend and the seasonal variability. ED visits for a wide range of skin conditions, including urticaria (hives), cellulitis, dermatitis and rashes, were used to represent health outcomes. The CC method was realized on clusters defined by individual cases-control strata to avoid potential bias [26].
This work assesses potential impacts of ambient air pollution to human skin condition development. From our data we can propose that increase in ambient air pollution levels can exacerbate various health conditions, among them the ones related to skin as well. In addition, it is possible that skin chronic exposure to air pollution can affect cutaneous processes such as skin aging, inflammation, allergic conditions and skin cancer.
Material and methods
Health data
All ED visits data were retrieved from the National Ambulatory Care Reporting System (NACRS). The NACRS contains day and night surgery, outpatient clinics and ED data for all hospital community-based ambulatory care mainly in the province of Ontario. For more information on the NACRS, see Canadian Institute for Health Information website: www.cihi.ca.
ED visits for cellulitis were retrieved from the NACRS during the period from April 2004 to December 2011 using the International Classification of Diseases, Tenth revision (ICD-10) code L03. Cellulitis-related visits were further separated into those that pertained to a) uncovered parts of body: cellulitis of finger and toe (ICD-10 code: L03.0), cellulitis of other parts of limb (ICD-10 code: L03.1), cellulitis of face (ICD-10 code: L03.2) and cellulitis of head and scalp (ICD-10 code: L03.8); and b) covered parts of body (others cases not in the first category).
ED visits for other skin conditions were retrieved from the NACRS using the following ICD-10 codes: R20 (Disturbances of skin sensation), R21 (Rash and other nonspecific skin eruption), L25.9 (Unspecified contact dermatitis, unspecified cause), L50.9 (Urticaria, unspecified).
Environmental data
The environmental data were obtained from Environment Canada’s National Air Pollution Surveillance Program (NAPS), http://www.ec.gc.ca/rnspa-naps/. The NAPS stations for each patient were identified using the first three letters/numbers of the patient’s postal code. Only NAPS stations within 35 km of each patient’s postal code were considered for the ambient air pollutions exposure measurements and stations within 100 km for temperature and humidity. If more than one station was available for a patient, the daily values of all relevant stations were averaged. The daily average values of O3, nitrogen dioxide (NO2), fine particulate matter (PM) with a median aerodynamic diameter of less than 2.5 µm (PM2.5) and sulfur dioxide (SO2) were calculated by averaging over the relevant NAPS stations. Carbon monoxide levels were not considered in the study because of large amount of missing data in most of the cities. Hourly data for relative humidity and temperature for all cities were also retrieved from Environment Canada. The daily levels for the weather parameters temperature and relative humidity were calculated by averaging hourly data over 24 hour periods.
It should be mentioned that air pollution measurements are available only for a city or a district; therefore it is not possible to retrieve them for each patients. Indeed we can consider the present study as an aggregated exposure case crossover study.
From the 2011 Census of Population we have the following population sizes: Algoma (115,870), Halton (501,669), Hamilton (519,950), London (366, 150), Ottawa (883,391), Peel (1.297 million), Toronto (2.615 million), Windsor (210,890) and York (133,361). The city of Windsor, Ontario, is recognized as having poorer air quality in relation to other cities in Canada. Among the different sources of air pollutants in Windsor and neighbour cities, two are particularly noteworthy: a) upwind sources that include coal-powered electrical energy generating stations and other industrial sources located in the US and b) local industrial pollution and emissions from Canada-US transportation corridors. Toronto is one of the largest city in Canada, with population more than 2.5 million.
Statistical analysis
This study has been performed in two statistical analysis steps. In the first step, a time stratified case-crossover (CC) design was applied and realized separately for each city [27]. In the CC approach cases acted as their own controls on a set of predefined control periods (days) proximate to the time they became cases, since each case is the perfect match. The CC method is an ideal method for air pollution studies because it avoids confounding by individual’s characteristics and longer time-varying covariates (i.e., seasonal effects, trends) [25,27,28].
A p-value less than 0.05 was considered statistically significant in all presented statistical results. The generated results were reported as odds ratios (ORs) and their 95% confidence intervals (CI). ORs for O3, NO2, PM2.5 and SO2 were calculated separately for each city by using the PROC PHREG (proportional hazard Cox’s regression, realized as conditional logistic regression) procedure in SAS (SAS Enterprise Guide, v.4.2). In the models, air pollutants and meteorological factors were lagged by the same number of days, from 0 to 8. The controls were matched to case periods by day of week for the case period (day) and the control periods were determined as other days in the same month and year. For each case, three or four controls were used [27].
The second step of this study involved combining the estimates for individual cities to generalize an overall effect relevant to all nine cities. This stage of study required a meta-analysis of the estimates and their standard errors to achieve a pooled effect estimate. Assuming that individual effect size estimates represent the same underlying parameter and effect estimates are weighted by the inverse of their variance, pooled estimators and their standard errors using a fixed-effects model were calculated. Moreover, based on an assumption that individual effect size estimates reflect potentially different underlying parameters, random-effects model was also calculated [28]. Meta-analysis and meta-regression were performed using the R language [29].
Results
Results for cellulitis
Figure 1 shows frequency (counts) for cellulitis ED visits by sex and age, from 0 years to 100 years of age. The patients 100 years of age and older are represented on the graph as 100 years of age (i.e., by one point). Table 1 shows the frequency of ED visits by type of cellulitis (location on the body), by sex, age group, season (cold months: October-March, and warm months: April-September), city and by type among 252,799 ED visits for cellulitis recorded during the period of April 2004 to December 2011. The most frequent cellulitis-related ED visits were for “Other parts of limb”, a designation that includes leg and shoulder and represents areas that are likely to be mostly uncovered during warm months. The number of visits was higher during the warmer months and higher among males. Table 2 shows the characteristics of relative humidity and temperature of all cities we have considered in this study. Table 3 shows the descriptive air pollution statistics by cities.
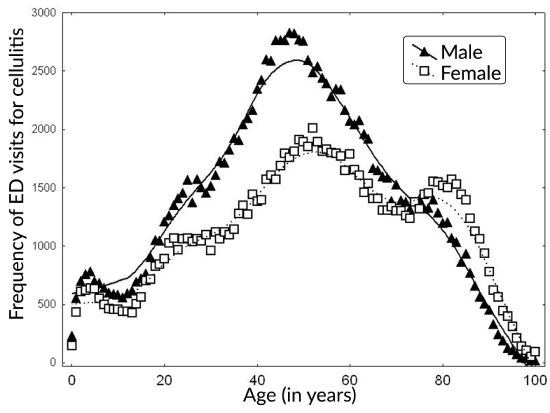
Figure 1. Frequency of ED visits for cellulitis by sex and age.
Table 1. Frequency of visits for cellulitis by type, sex, age group, season and by city
Variables |
Frequency (%) |
Type |
|
Finger & toe |
37,920 (15) |
Other parts of limb |
171,903 (68) |
Face |
17,696 (7) |
Trunk |
12,640 (3) |
Other sites |
5,056 (2) |
Unspecified |
7,584 (3) |
Sex |
|
Female |
113,501 (45) |
Male |
139,294 (55) |
Age group |
|
[0,30) |
49,128 (19) |
[30,75) |
162,228 (65) |
75+ |
41,443 (16) |
Season |
|
Cold |
102,696 (41) |
Warm |
150,103 (59) |
City |
|
Algoma |
11,967 (5) |
Halton |
13,806 (5) |
Hamilton |
30,363 (12) |
London |
17,994 (7) |
Ottawa |
30,107 (12) |
Peel |
28,197 (11) |
Toronto |
81,264 (32) |
Windsor |
16,155 (7) |
York |
22,946 (9) |
Note: Season: cold (October-March) and warm (April - September).
Table 2. Characteristics of relative humidity and temperature
City |
Variable |
Mean |
Minimum |
Maximum |
IQR |
Algoma |
RH |
75.1 |
29.0 |
100.0 |
14.7 |
T |
6.2 |
-26.2 |
26.4 |
16.4 |
Halton |
RH |
70.5 |
35.7 |
95.5 |
15.9 |
T |
9.7 |
-17.9 |
31.0 |
16.1 |
Hamilton |
RH |
76.2 |
36.2 |
100.0 |
15.7 |
T |
9.0 |
-19.8 |
30.0 |
16.8 |
London |
RH |
73.5 |
33.2 |
98.9 |
14.5 |
T |
9.1 |
-19.7 |
30.6 |
16.9 |
Ottawa |
RH |
72.2 |
26.7 |
100.0 |
18.4 |
T |
7.9 |
-26.6 |
29.6 |
17.7 |
Peel |
RH |
70.2 |
27.6 |
99.8 |
16.1 |
T |
9.7 |
-20.3 |
31.7 |
16.9 |
Toronto |
RH |
72.5 |
24.6 |
99.7 |
16.8 |
T |
10.1 |
-19.3 |
31.5 |
16.2 |
Windsor |
RH |
69.5 |
32.4 |
97.4 |
16.3 |
T |
11.0 |
-19.5 |
30.4 |
17.3 |
York |
RH |
70.1 |
30.1 |
100.0 |
16.5 |
|
T |
9.1 |
-20.0 |
32.0 |
16.9 |
Note: IQR: Interquartile range; RH: Relative humidity (%), T: Temperature (oC)
The results of pooling estimates for cellulitis among the nine cities for all months are presented in Figure 2, for males (left panel) and females (right panel). ORs and their 95% CI were calculated for one unit increase in their interquartile range (IQR=75th percentiles- 25th percentiles) values. The IQR values were calculated among all nine cities and are IQR = 9.0, 14.5 and 2.5 ppb respectively, for daily means of NO2, O3, SO2, and 7.1 μg/m3 for PM2 5. Statistically significant positive results among females were observed for O3 for lags 1, 4 and 5 days with the highest result was for lag 4 days: OR=1.021 (95%CI: 1.007, 1.035). These results were more evident during the warm months, and among them the highest was for lag 5 days: OR=1.024 (1.006, 1.042). PM2.5 remained positive, but not significant among all lags. For males, statistically significant positive results were observed for PM2.5 for lags 3 to 6 where the highest result is for lag 5 days: OR=1.022 (1.010, 1.034) and for NO2 for lags 5 and 7, OR=1.018 (1.002, 1.034). During warm months, statistically significant positive results were observed for O3 among lag 3 and 5 days, OR=1.015 (1.002, 1.027).
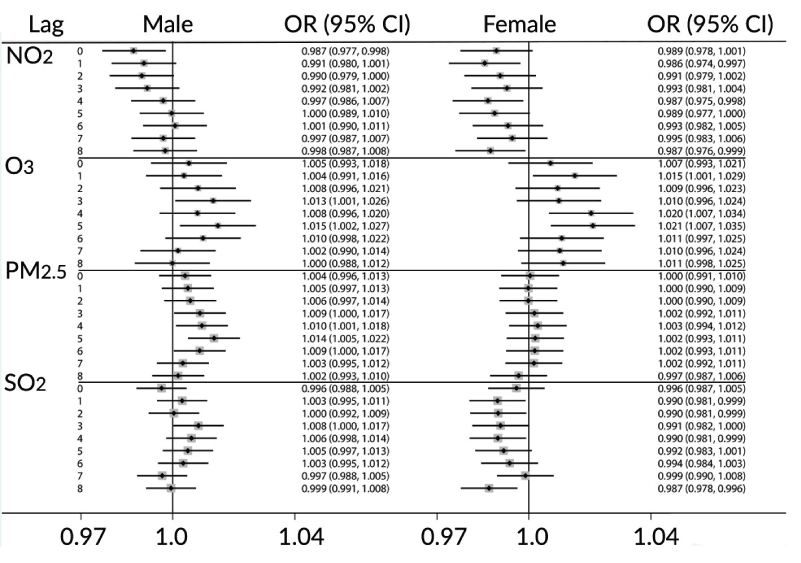
Figure 2. Results of pooling estimates (fixed effect) for cellulitis among the nine cities during all seasons.
Restricted cellulitis: cellulitis infection localized among uncovered or less-covered parts of body
Among all diagnosed ED visits for cellulitis, the cases identified on uncovered or less-covered parts of body were chosen during the warm months (N=196,890, 44% females and 56% males): cellulitis of finger and toe (L03.0), cellulitis of other parts of limb (L03.1), cellulitis of face (L03.2), and cellulitis of head and scalp (L03.8). These restrictions resulted in 140,234 cases. Statistically significant positive results were observed for O3 for lags 4, 5 and 8 among females where the highest result was for lag 4 (OR=1.032 (1.013, 1.050)). For males, statistically significant positive results were observed for PM2.5 for lags 2 to 6 days where the highest result is for lag 3 days (OR=1.020 (1.008, 1.032)) and for NO2 for lags 5, 7 and 8 (OR=1.017 (1.001, 1.034), OR=1.019 (1.003, 1.036) and OR=1.017 (1.000, 1.033), respectively).
Results for other skin conditions
Figure 3 shows frequency (counts) for ED visits for various skin conditions by sex and age, from 0 years to 100 years of age. Table 4 shows the frequency of ED visits by sex, season (cold months (October-March) and warm months (April-September)), city and type among 201,571 ED visits for skin conditions recorded during the period of April 2004 to December 2011. As can be seen in Table 4, the majority of ED visits was for “Rash and other nonspecific skin eruption” (ICD-10 code R21). The number of visits was higher during the warm season (versus cold) and more among females (versus males). The results of pooling estimates for skin conditions among the nine cities for all months are presented in Figure 4, for males (left panel) and females (right panel). ORs and their 95% CI were calculated for one unit increase in interquartile range value. Statistically significant positive results among females were observed for PM2.5 among all lags from 2 to 8, with the highest value for lag 7 days (OR=1.017 (95%CI: 1.007, 1.026)); for O3 for lags 0 to 2 days with the highest value for lag 1 days (OR=1.021 (1.007, 1.034)); for NO2 for lags 6 to 8 days with the highest values for lag 7 days (OR=1.015 (1.005, 1.026); and, for SO2 for lags 6 to 8 days (OR=1.017 (1.007, 1.026)). Among males, PM2.5 remained positive among all lags and this was statistically significant for lags 4 and 6 days, with the highest result for lag 6 days (OR=1.011 (1.000, 1.021)).
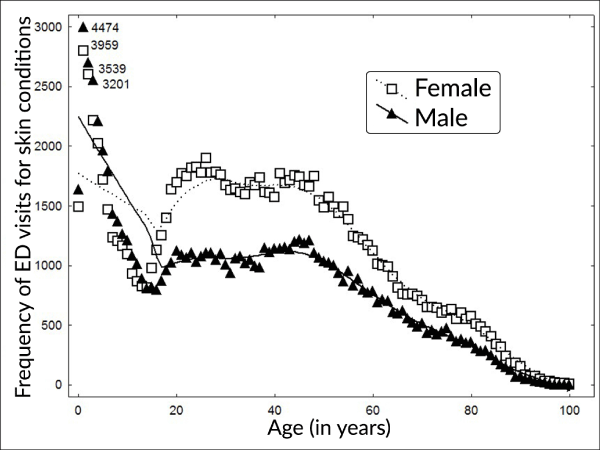
Figure 3. Frequency of ED visits for skin condition by sex and age.
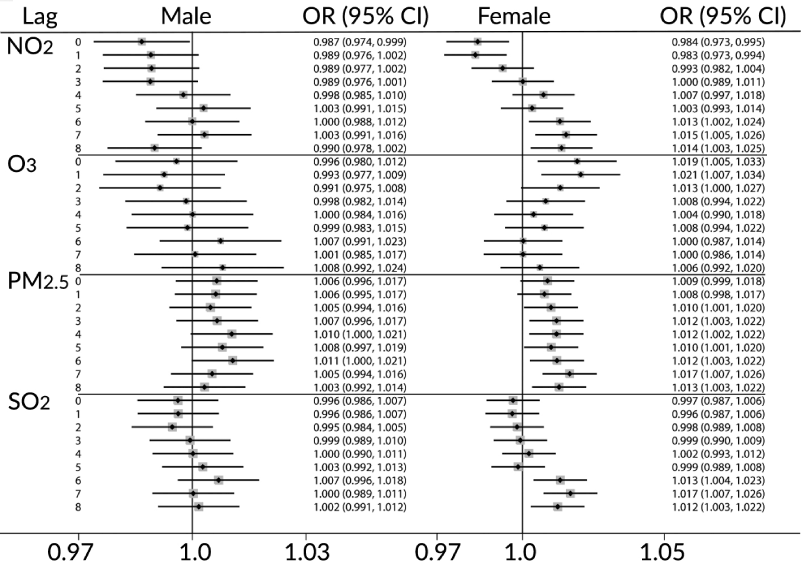
Figure 4. Results of pooling estimates (fixed effect) for skin conditions among the nine cities during all seasons.
Table 3. Descriptive air pollution statistics by cities
City |
Pollutant |
Mean |
Minimum |
Maximum |
IQR |
Algoma |
NO2 |
5.1 |
0.0 |
24.0 |
4.0 |
O3 |
28.5 |
2.0 |
80.0 |
14.0 |
PM2.5 |
5.3 |
0.0 |
29.0 |
4.3 |
SO2 |
1.1 |
0.0 |
17.0 |
2.0 |
Halton |
NO2 |
12.9 |
1.0 |
51.2 |
7.7 |
O3 |
25.8 |
2.0 |
67.7 |
14.0 |
PM2.5 |
7.7 |
0.5 |
34.2 |
5.8 |
SO2 |
2.3 |
0.0 |
14.0 |
2.0 |
Hamilton |
NO2 |
13.9 |
1.7 |
63.0 |
9.5 |
O3 |
26.3 |
1.5 |
70.0 |
13.5 |
PM2.5 |
9.8 |
0.0 |
64.2 |
7.6 |
SO2 |
4.1 |
0.0 |
35.5 |
4.1 |
London |
NO2 |
10.9 |
0.0 |
51.0 |
7.0 |
O3 |
26.3 |
1.0 |
66.0 |
14 |
PM2.5 |
9.5 |
0.0 |
66.3 |
7.2 |
SO2 |
1.7 |
0.0 |
15.0 |
1.0 |
Ottawa |
NO2 |
8.7 |
1.0 |
47.0 |
7.0 |
O3 |
24.1 |
1.0 |
66.5 |
13.0 |
PM2.5 |
7.0 |
0.0 |
67.7 |
6.3 |
SO2 |
0.8 |
0.0 |
13.0 |
1.0 |
Peel |
NO2 |
13.2 |
2.0 |
54.0 |
9.5 |
O3 |
25.0 |
1.0 |
69.5 |
13.5 |
PM2.5 |
8.5 |
0.0 |
64.9 |
6.8 |
SO2 |
1.4 |
0.0 |
12.0 |
1.5 |
Toronto |
NO2 |
18.5 |
4.5 |
62.1 |
9.4 |
O3 |
22.5 |
1.5 |
60.7 |
13.4 |
PM2.5 |
9.3 |
0.0 |
66.8 |
7.4 |
SO2 |
1.8 |
0.0 |
13.7 |
1.8 |
Windsor |
NO2 |
15.6 |
2.4 |
55.5 |
8.1 |
O3 |
25.7 |
1.0 |
68.5 |
16.1 |
PM2.5 |
9.5 |
0.8 |
33.6 |
7.4 |
SO2 |
4.3 |
0.0 |
24.3 |
4.5 |
York |
NO2 |
8.2 |
0.0 |
47.0 |
7.0 |
O3 |
29.2 |
3.0 |
71.0 |
14.0 |
PM2.5 |
6.7 |
0.0 |
27.0 |
6.0 |
SO2 |
1.2 |
0.0 |
8.0 |
2.0 |
Note: NO2, nitrogen dioxide; O3, ozone; SO2, sulphur dioxide; PM2.5, particular matter with a median aerodynamic diameter of less than 2.5 µm. NO2, O3, and SO2 in ppb; PM2.5 in g/m3
Table 4. Frequency of visits for skin conditions other than cellulitis by sex, season, city and by type of skin conditions
Variables |
Description |
Frequency (%) |
Sex |
|
|
Female |
|
114,891 (57) |
Male |
|
86,674 (43) |
Season |
|
|
Cold |
|
88,001 (44) |
Warm |
|
113,570 (56) |
City |
|
|
Algoma |
|
12,146 (6) |
Halton |
|
13,412 (7) |
Hamilton |
|
19,845 (10) |
London |
|
14,357 (7) |
Ottawa |
|
22,629 (11) |
Peel |
|
25,770 (13) |
Toronto |
|
63,049 (31) |
Windsor |
|
10,603 (5) |
York |
|
19,760 (10) |
Type |
|
|
L25.9 |
Unspecified contact dermatitis |
12,322 (6) |
L50.9 |
Urticaria, unspecified |
51,161 (25) |
R20.0 |
Anesthesia of skin |
131 (<1) |
R20.1 |
Hypoesthesia of skin |
205 (<1) |
R20.2 |
Paresthesia of skin |
19,282 (10) |
R20.3 |
Hyperesthesia |
113 (<1) |
R20.8 |
Other disturbances of skin sensation |
35,258 (17) |
R21 |
Rash and other nonspecific skin eruption |
83,099 (41) |
Note: Season: cold (October-March) and warm (April - September); Skin conditions classified according to International Classification of Diseases, Tenth revision, ICD-10 codes
The associations were stronger during the warm months for O3, SO2 and PM2.5: for females, for O3 the highest association was for lags 1 and 5 days (OR=1.023 (1.005, 1.041)) and for SO2 the highest was for lag 7 days (OR=1.032 (1.019, 1.045). For males, PM2.5 was the highest for lag 6 days (OR=1.020 (1.004, 1.036)). No statistically significant results were observed for NO2 during the warm season for either males or females.
Random effect versus fixed effect
To obtain a heterogeneity variance component, random effects meta-analyses were used for this part of the study. Calculating random effects allows the possibility that the estimates from different cities can be referred to different parameters, rather than just a single underlying parameter. Using this model, a heterogeneity variance component was obtained. For cellulitis, approximately 30% of the estimates passed the Q-statistic test and statistically significant positive results were observed for O3 among lags 1, 3-6 days for females and lags 2-6 days for males and PM2.5 among lag 5 days for males. For skin conditions other than cellulitis, approximately 63% of the estimates passed the Q-statistic test and statistically significant positive results were observed among females for O3 for all lags, NO2 and SO2 for lags 6-8 days and lags 1-3 days for PM2.5. Among males for O3 for lags 1-8 days, for NO2 lags 4-8 days, SO2 for lag 8 days and lags 3-8 days for PM2.5.
Discussion
Pollutants can exert their detrimental effects either through inhalation or through contact with the skin. The main role of skin is to act as a barrier of defense for the environmental stressors. The skin is the major target of liquid and gaseous pollutants and the pollutant that reacts most specifically with the cutaneous tissues, beside UV radiation, hydrocarbon, and organic compounds, is O3. Ozone represents one of the major oxidants in photochemical smog, levels being highest in heavily polluted areas where exposure to UV is also high. In the last decade, many studies have shown the toxic effect of O3.
As it was hypothesized [5], O3 does not penetrate the cells, but oxidizes proteins and reacts rapidly with polyunsaturated fatty acids (PUFA) present at the air-cellular interface to form reactive oxygen species (ROS), such as hydrogen peroxide and a mixture of heterogeneous lipid oxidation products (LOPs) including lipoperoxyl radicals, hydroperoxides, malonyldialdeyde, isoprostanes, the ozonide radical and alkenals, particularly 4-hydroxy-2,3-trans-nonenal (HNE) . Therefore O3 is able to modify the redox homeostasis of the cells and damage protein, nucleic acids and lipids.
In this study, 252,799 ED visits for cellulitis and 201,571 ED visits for other skin conditions (excluding cellulitis) during the period of April 2004 to December 2011 patients across nine major cities in Canada were analyzed in an attempt to link air quality conditions to ED visits for skin conditions. To our knowledge, this is one of the largest multi-city studies correlating air pollution with ED visits for skin conditions.
Cellulitis
Positive and statistically significant short-term effects on the risk of cellulitis were observed for O3, NO2 and PM2.5. These results are in line with previous published studies that examined the effect of air pollution on skin diseases and, more specifically, on cellulitis [19-23]. As cellulitis is caused by various bacteria, it has been proposed to identify the bacteria levels in diagnosis of patients. (Proposition was accepted by the ICD-10-CA/CCI Classification Advisory Committee (Canada). The method would be associating the bacteria coding B95 to the Cellulitis coding L03. A statement will be added under L03 to ask coders to specify the bacteria.
Skin conditions other than cellulitis
For PM2.5, statistically significant positive results were observed for all lags. Associations with O3 remained positive among all lags and statistically significant positive for lags 0 to 1 among females were observed. Among males, PM2.5 remained positive among all lags and statistically significant (positive) for lags 3 to 6. Significant positive results were also observed for NO2 and SO2 among both males and females. These results agree with previous published studies in which have been examined the effect of air pollution on skin diseases [19-21]. In a study in Bordeaux, France, from 2000 to 2006 [19], Larrier et al. explored links between daily levels of air pollutions and medical home visits made for several reasons. Their study showed that the risk of a visit for skin rash or conjunctivitis was increased during the 3 days following increases in PM10 (excess relative risk, ERR=3.2%) and O3 (ERR=3.0%). They also found a higher effect of NO2 on visits for skin conditions when delayed effects were considered [16].
A similar CC study in Edmonton, Canada during the period from April 1992 to March 2002 captured a significant associations between ambient ozone exposure and ED visits for the same skin conditions examined in the current study [18]. Indeed, significant association was seen for all patients with skin rash/eruption, lag 0 days; dermatitis/eczema, for lag 2; urticaria, for lag 4 days and unspecified conjunctivitis, for lag 5 days.
Another study in Shanghai, China among 68,226 ED visits for skin conditions between February 2007 and December 2008 from Huashan Hospital also showed a statistically significant association for O3 and ED visits for skin conditions, but not for other pollutants. It should be mentioned that in the study by Xu et al. PM2.5 were not considered [19].
The effect estimates a2021 Copyright OAT. All rights reservo the use of pooled data from nine cities. In a multi-city study, sometimes the effects have small values as some cities do not provide strong associations (large variance). The findings in this study support other published data suggesting associations between air pollutants and the number of ED visits for skin conditions and cellulitis.
References
- Valacchi G, Sticozzi C, Pecorelli A, Cervellati F, Cervellati C, et al. (2012) Cutaneous responses to environmental stressors. Ann N Y Acad Sci 1271: 75-81. [Crossref]
- Bell ML, Zanobetti A, Dominici F (2014) Who is more affected by ozone pollution? A systematic review and meta-analysis. Am J Epidemiol 180: 15-28. [Crossref]
- Fridovich I (1978) The biology of oxygen radicals. Science 201: 875-880. [Crossref]
- Aris RM, Christian D, Hearne PQ, Kerr K, Finkbeiner WE, et al. (1993) Ozone-induced airway inflammation in human subjects as determined by airway lavage and biopsy. Am Rev Respir Dis 148: 1363-1372. [Crossref]
- Pryor WA (1993) Ozone in all its reactive splendor. J Lab Clin Med 122: 483-486. [Crossref]
- Camhi SL, Lee P, Choi AM (1995) The oxidative stress response. New Horiz 3: 170-182. [Crossref]
- Devlin RB, Raub JA, Folinsbee LJ (1997) Health effects of ozone. Sci Me 8: 17.
- Devlin RB, McDonnell WF, Mann R, Becker S, House DE, et al. (1991) Exposure of humans to ambient levels of ozone for 6.6 hours causes cellular and biochemical changes in the lung. Am J Respir Cell Mol Biol 4: 72-81. [Crossref]
- Devlin RB, McKinnon KP, Noah T, Becker S, Koren HS (1994) Ozone-induced release of cytokines and fibronectin by alveolar macrophages and airway epithelial cells. Am J Physiol 266: L612-619. [Crossref]
- Morrison D, Rahman I, MacNee W (2006) Permeability, inflammation and oxidant status in airspace epithelium exposed to ozone. Respir Med 100: 2227-2234. [Crossref]
- Szyszkowicz M, Rowe B (2016) Respiratory health conditions and ambient ozone: a case-crossover study. Insights in Chest Diseases 1:10.
- Szyszkowicz M, Kousha T (2014) Emergency department visits for asthma in relation to the Air Quality Health Index: a case-crossover study in Windsor, Canada. Can J Public Health 105: e336-341. [Crossref]
- Stieb DM, Szyszkowicz M, Rowe BH, Leech JA (2009) Air pollution and emergency department visits for cardiac and respiratory conditions: a multi-city time-series analysis. Environ Health 8: 25. [Crossref]
- Wong TW, Lau TS, Yu TS, Neller A, Wong SL, et al. (1999) Air pollution and hospital admissions for respiratory and cardiovascular diseases in Hong Kong. Occup Environ Med 56: 679-683. [Crossref]
- Szyszkowicz M, Kousha T, Castner J (2016) Air pollution and emergency department visits for conjunctivitis: A case-crossover study. Int J Occup Med Environ Health 29: 381-393. [Crossref]
- Szyszkowicz M, Kaplan GG, Grafstein E, Rowe BH (2009) Emergency department visits for migraine and headache: a multi-city study. Int J Occup Med Environ Health 22: 235-242. [Crossref]
- Larrieu S, Lefranc A, Gault G, Chatignoux E, Couvy F, et al. (2009) Are the short-term effects of air pollution restricted to cardiorespiratory diseases? Am J Epidemiol 169: 1201-1208. [Crossref]
- Szyszkowicz M, Porada E, Searles G, Rowe BH (2012) Ambient ozone and emergency department visits for skin conditions. Air Qual Atmos Health 5: 303-309.
- Xu F, Yan S, Wu M, Li F, Xu X, et al. (2011) Ambient ozone pollution as a risk factor for skin disorders. Br J Dermatol 165: 224-225. [Crossref]
- Valacchi G, Pagnin E, Okamoto T, Corbacho AM, Olano E, et al. (2003) Induction of stress proteins and MMP-9 by 0.8 ppm of ozone in murine skin. Biochem Biophys Res Commun 305: 741-746. [Crossref]
- Szyszkowicz M, Porada E, Kaplan GG, Rowe BH (2010) Ambient ozone and emergency department visits for cellulitis. Int J Environ Res Public Health 7: 4078-4088. [Crossref]
- Szyszkowicz M, Porada E, Kaplan GG, Grafstein E (2012) Ambient ozone as a risk factor for ED visits for cellulitis. Environment and Pollution 1: 105-111.
- Packer L, Valacchi G (2002) Antioxidants and the response of skin to oxidative stress: vitamin E as a key indicator. Skin Pharmacol Appl Skin Physiol 15: 282-290.
- Dominici F, Zeger SL, Samet JM (2000) Combining Evidence on Air Pollution and Daily Mortality from the Largest 20 US cities: A Hierarchical Modeling Strategy. Royal Statistical Society 163: 263-302
- Maclure M1 (1991) The case-crossover design: a method for studying transient effects on the risk of acute events. Am J Epidemiol 133: 144-153. [Crossref]
- Wang SV, Coull BA, Schwartz J, Mittleman MA, Wellenius GA (2011) Potential for bias in case-crossover studies with shared exposures analyzed using SAS. Am J Epidemiol 174: 118-124. [Crossref]
- Janes H, Sheppard L, Lumley T (2005) Case-crossover analyses of air pollution exposure data: referent selection strategies and their implications for bias. Epidemiology 16: 717-726. [Crossref]
- Bateson TF, Schwartz J (1999) Control for seasonal variation and time trend in case-crossover studies of acute effects of environmental exposures. Epidemiology 10: 539-544. [Crossref]
- DerSimonian R, Laird N (1986) Meta-analysis in clinical trials. Control Clin Trials 7: 177-188. [Crossref]
- Dean CB, Nielsen JD (2007) Generalized linear mixed models: a review and some extensions. Lifetime Data Anal 13: 497-512. [Crossref]