Abstract
Purpose
To provide spectral domain optical coherence tomography (SDOCT) of subretinal fibrin leakage and concomitant central serous chorioretinopathy (CSC) morphology in four cases. Likewise, to compare the SDOCT of these cases with others documented.
Case reports
Four cases of acute onset CSC exhibiting serous neurosensory and retinal pigment epithelium detachment (PED) associated with a hyper-reflective pattern in the subretinal space that appear to emanate from the PED are described. Initially, all cases showed thickening of the photoreceptor outer segment (POS) as well as zones where the inner segment-outer segment junction line (IS/OS) was not visible. All cases had an outer retinal “dipping” appearance. On follow-up visits all cases showed thinning of the POS with an increase of granular deposits on the posterior surface of the detached retina. As the CSC resolved, the IS/OS junction line became visible and the granular deposits diminished. One case exhibited a relative decrease in foveal thickness compared to the unaffected eye.
Conclusion
SDOCT imaging of a hyper-reflective pattern at the subretinal space proximal to a PED in CSD may reflect resonance detection of fluid turbulences and density distribution disparities. This occurs as the serous fluid from the choroidal circulation diffuses into the subretinal space from a focal PED leakage site. A clear hypo-reflective area at the core of the hyper-reflective pattern may result from the distribution of less dense constituents centrally while hyper-reflective denser particles surround and concentrate at the peripheral border. The size of the leakage defect in the PED may determine the outline of the hyper-reflective pattern while the location may influence the spatial orientation. The POS swelling may impart pliability to the outer retina. The hydrostatic and fibrin particle pressure flowing from a PED on this retinal layer may contribute to the apparent outer retinal “dipping” imaged on optical coherence tomography.
Introduction
Although central serourschorioretinopathy (CSC) is typically regarded as idiopathic, it has been associated with a variety of systemic and environmental factors such as hypertension, stress, pregnancy, smoking, elevated cortisol and circulating catecholamines levels [1- 5]. The choroid is considered to be principally affected leading to multiple localized tissue damage that precedes focal leakage. The inner layer retinal pigment epithelium (RPE) may be subsequently impaired resulting in a pigment epithelial detachment (PED). Therefore, leakage of serous fluid to the subretinal space results in retinal serous detachment [1-11]. Time domain optical coherence tomography (TDOCT) and spectral domain optical coherence tomography (SDOCT) have significantly facilitated the study and understanding of the pathophysiology and thus, have enhanced the overall management of CSC [1,4,6-17]. Initial observations of patients with CSC using TDOCT revealed associated PED’s, sensory retinal elevation and fibrin material accumulation within the areas of damaged RPE [13-17]. However, it was not until the advancements of SDOCT which provided higher imaging resolution, that the observation of finer image details helped correlate SDOCT findings to those observed on fluorescein angiography (FA) and indocyanine-green angiography (ICGA) [1,6,7,9,10] . For example, fibrin exudation emanating from small intercellular space openings within or contiguous to the localized RPE detachment observed on SDOCT has been described to precisely correspond to areas of observed “smokestack” or “inkblot” leakage patterns on FA and ICGA [1, 6, 7, 9,10]. Additional observationsinclude early stage thickening of the photoreceptor outer segment (POS) layer with invisibility of the inner segment-outer segment junction line (IS/OS), and “dipping” of the posterior retinal layer towards the RPE. The “dipping” pattern has been attributed to attraction or dragging by fibrin strands. In later stages, granular deposits may become more visible at the posterior surface of the detached retina. As the CSC resolves, a decrease in foveal thickness (FT) compared to the unaffected eye has been documented [1,4,6,7,9-11,16].
We provide a comparative interpretation of the image captured by the SDOCT (RTVue-100, Optovue®) and specify the physiological dynamics that may lead to the variations of “smokestack” and “inkblot” leakage patterns. We also propose an alternative interpretation of the posterior or outer retinal layer “dipping” observed in association with the hyper-reflective pattern imaged by optical coherence tomography (OCT).
Case report
Case 1. A 38 year-old Hispanic male, presented to clinic complaining of “seeing a dark spot” that affected his central vision. The patient noticed the central vision change two days prior to his clinic visit. Systemic medical history was unremarkable but a history of tobacco smoking was indicated. No history of stress or previous stomach ulcers was specified. Entering visual acuities with the patient’s spectacle correction at distance were 20/400 OD with no improvement on pinhole (NIPH) and 20/20-2 OS. Preliminary findings including pupil responses were unremarkable OU. Slit lamp exam (SLE) showed deep and quiet anterior chambers and was generally unremarkable OU. Goldman tonometry measurements were 13 mm Hg OD and 12 mm Hg OS. Dilated fundus exam (DFE) cup/disc (C/D) ratios were 0.45/0.45 with healthy rim tissue and disc coloration OU. The macula and posterior pole was healthy OS and similarly the fundus periphery OU.
A central serous detachment (CSD) of approximately 3 disc diameters (DD) was observed at the macula OD (Figure 1). On SDOCT sections, a CSD with a small PED was confirmed. The POS appeared thickened and slightly granulated .The IS/OS junction line was not visible in some areas (Figure 2a). A second PED was observed on a different scan section. A hyper-reflective pattern appeared to stem laterally from this second PED into the subretinal space. The outer layer of the detached retina appeared to be “dipping” into the subretinal space as it contacted the uppermost tip of the hyper-reflective pattern. The center of the hyper-reflective pattern however, was hypo-reflective while its borders were diffuse and hyper-reflective (Figure 2b). On “en-face” imaging five concentric hyper-reflective circles were visible, corresponding to the most upraised retinal layers namely the inner limiting membrane/nerve fiber layer (ILM/NFL), the ganglion cell layer (GCL), the inner nuclear layer (INL), the outer plexiform layer (OPL) and the outer nuclear layer (ONL) (Figure 3a-b). Two PED’s visible on the “en-face” scan appeared to be essentially round with a dark hypo-reflective center surrounded by a diffuse, hyper-reflective well-defined margin (Figure 4). A diagnosis of CSC was made. The patient was educated on possible etiological factors and associated links with tobacco smoking and importance of smoking cessation. In addition he was informed that the initial management required observation for approximately 3-6 months since in many cases CSC self-resolves, otherwise a referral for laser treatment with a retinal specialist may be indicated. Although an appointment was scheduled for a 1 month follow-up visit the patient did not return to clinic as instructed. He returned approximately 2 years and 8 months later at which time the CSC had resolved. BVA were 20/30 OD and 20/20 OS. A residual collapsed PED and dispersed areas of RPE disruption were visible. Similarly the IS/OS junction line was entirely visible and the FT was thinner compared to that of the contralateral unaffected eye. No granulated deposits were present (Figure 5a-b).
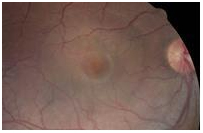
Figure 1. CSD observed in the macula OD (case 1).
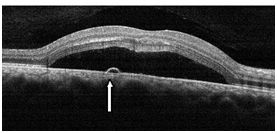
Figure 2a. CSD with a small PED (straight arrow) observed with SDOCT (case 1). The POS appeared thickened and slightly granulated and the IS/OS junction line is not visible in certain areas.
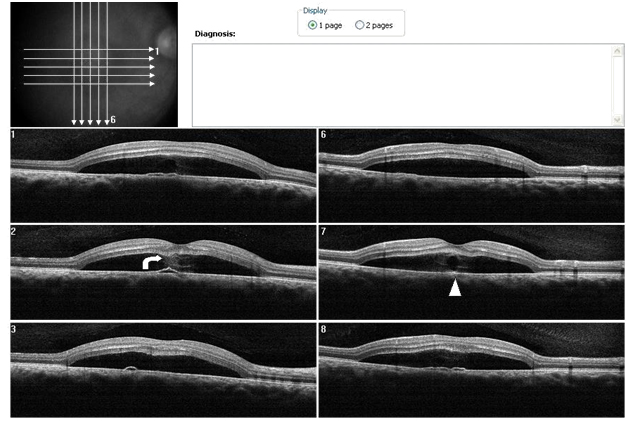
Figure 2b. SDOCT sections shows, a hyper-reflective pattern in the subretinal space that seems to spring from a different PED. Analysis of the sections suggests the hyper-reflective pattern emanates lateral to the PED (case 1). The outer retinal layer appears to be “dipping” into the subretinal space as it contacts the tip of the hyper-reflective pattern (curved arrow). The hyper- reflective pattern is hypo-reflective while its borders appear diffuse and hyper- reflective (arrow head).
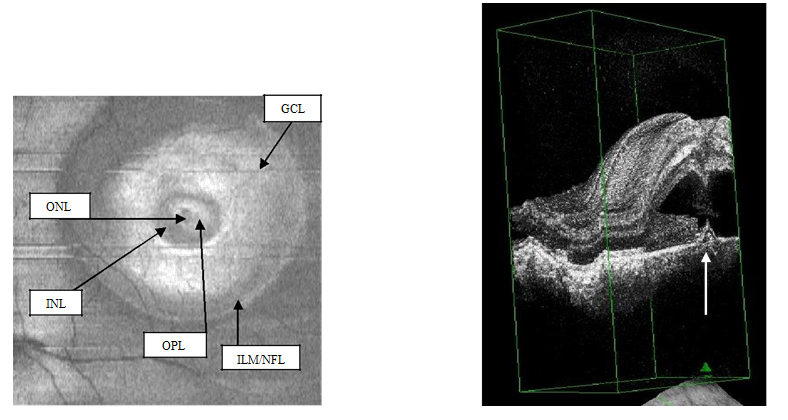
Figure 3a-b. On “en-face” (3a) and 3-D scans (b) (case 1), five concentric hyper- reflective circles are discernable corresponding to the inner limiting membrane/nerve fiber layer (ILM/NFL), ganglion cell layer (GCL), inner nuclear layer (INL), outer plexiform layer (OPL) and outer nuclear layer (ONL) (case 1). On 3-D imaging (3b), the PED (white arrow) associated with subretinal hyper-reflective pattern and “dipping” of the outer retinal layer into the subretinal space is observed.
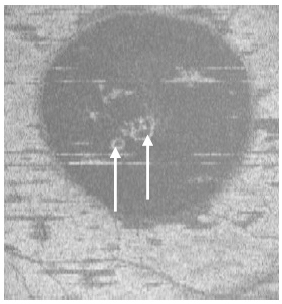
Figure 4. Two PED visible on “en-face” scan (white arrows) appeared to be approximately round with a dark hypo-reflective center surrounded by diffuse hyper-reflective margins (case 1).
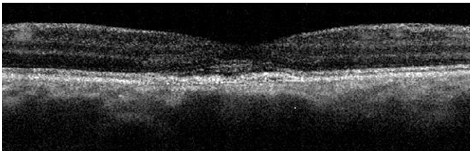
Figure 5a. A remnant collapsed PED and dispersed areas of RPE disruption are visible upon returning to clinic approximately 2 years and 8 month from initial presentation (case 1). The IS/OS junction line is entirely visible and no granulated deposits are present.
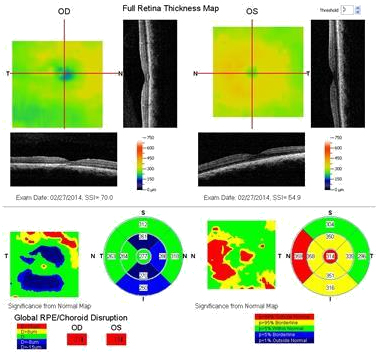
Figure 5b. The FT OD is thinner compared to that of the contralateral unaffected eye (case 1).
Case 2. A 37 year-old Hispanic male, presented to clinic with a chief complaint of decreased central vision on the right eye for one week. He stated that a “dark spot” was in his central vision. The patient had controlled hypertension (HTN) and diabetes mellitus (DM) type II. He was taking metformin HCL (500 mg) and atenolol (100 mg). He reported being under stress. Ocular history included Lasik surgery OU nine years earlier. A past history of a childhood stomach ulcer was reported. Best visual acuities (BVA) were 20/70 OD (NIPH) and 20/20 OS. Preliminary findings including pupil responses were unremarkable OU. Slit lamp exam was also generally unremarkable OU. Goldman tonometry readings were 16 mm Hg OD and 17 mm Hg OS. Blood pressure readings in office were 165/95 mm Hg. On DFE both optic nerves had healthy rim and disc coloration with C/D ratios of 0.65/0.65 OU. The periphery of both eyes had a normal appearance and posterior pole was similarly normal OS. A CSD was present OD encompassing approximately 2 ½ DD (Figure 6). A CSD associated with a PED was evident in the right eye on SDOCT. Thickening of POS with slight granulation and obvious sectorial absence of visible IS/OS junction line was observed. Contiguous to the PED, a hyper-reflective pattern appeared to diffuse laterally from the PED into the subretinal space (Figure 7a-b). The outer retinal layer appeared to be “dipping” into the subretinal space anterior to the contact point with the uppermost tip of the hyper-reflective pattern (Figure 7b). The hyper-reflective pattern center appeared conversely to be hypo-reflective while the borders were hyper-reflective and diffuse. On “en-face” imaging, six concentric hyper-reflective circles were visible corresponding to upraised retinal layers, namely ILM/NFL, GCL, inner plexiform layer (IPL), INL, OPL and ONL (Figure 8a-b). The PED on the “en-face” scan was round with a dark hypo-reflective center surrounded by diffuse hyper-reflective but well-defined margins (Figure 9a-b). The patient was educated on possible systemic and stress etiological factors. Management of stress, and HTN control was recommended. At a one month follow-up visit, the patient reported significant improvement with almost complete disappearance of symptoms. The BVA were 20/25 -2 OD and 20/20 OS. Fundus exam revealed apparent resolution of the CSC OD. Findings on the left eye remained similar to the initial visit. SDOCT confirmed a residual presence of the CSD. The POS appeared to be comparatively thinner but more granulated and IS/OS junction line was now completely visible (Figure 10). At the last follow up (4 months from initial presentation) visit the patient reported no more symptoms. BVA were 20/20 OD and OS. Fundus exam revealed resolution of the CSC with just an isolated area near the macula of discolored RPE pigmentation OD. The SDOCT showed complete resolution of the CSC with localized disrupted RPE defects. Less granulated deposits were visible (Figure 11).
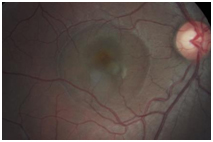
Figure 6. CSD observed OD encompassing approximately 2 ½ DD (case 2).
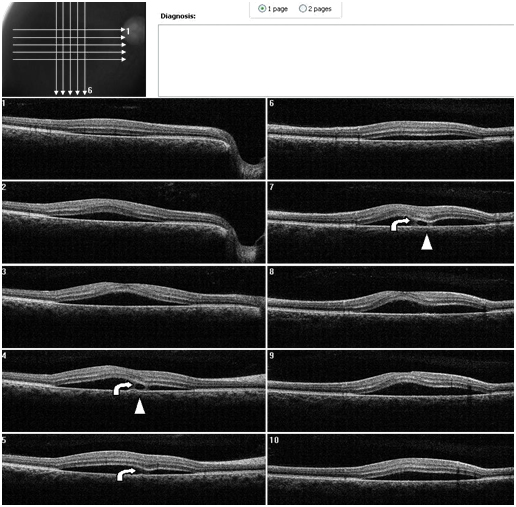
Figure 7. A CSD associated with a PED is present OD on SDOCT. Thickening of POS with slight granulation and sectorial absence of a visible IS/OS junction line is observed. A subretinal hyper-reflective pattern that appears to spring from a lateral margin of the PED is suggested from analysis of SDOCT sections. The outer retinal layer appears to be “dipping” into the subretinal space as it contacts the hyper-reflective pattern tip (curved arrow). The hyper- reflective center appears hypo-reflective with hyper-reflective diffuse borders (arrow head) (Case 2).
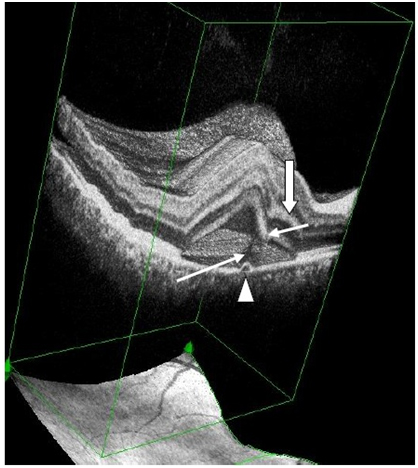
Figure 7a. 3-D SDOCT composed image of CSC (case2). The PED (arrow head) appears anterior to the subretinal hyper-reflective pattern (thin, long white arrow) as this emanates marginally from the PED. The outer retinal layer dips into the subretinal space anterior to the contact site of the tip of the subretinal hyper-reflective pattern (small, thin white arrow). Convexity of inner retina layers (thick white arrow) reflects the forced indentation by the subretinal hyper-reflective pattern behind the dipping retinal area.
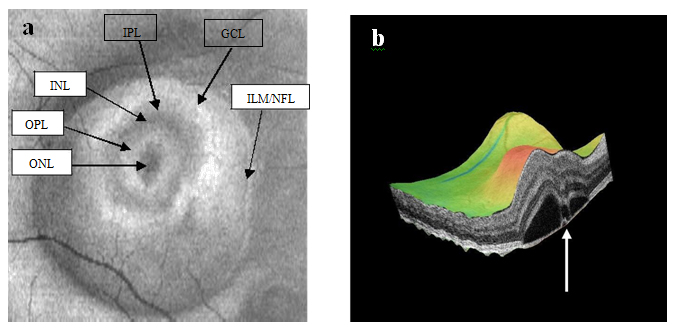
Figure 8a-b. SDOCT “en-face” (a) and 3-D scans (b) (case 2) display of six concentric hyper-reflective circles corresponding to upraised retinal layers, inner limiting membrane/nerve fiber layer (ILM/NFL), ganglion cell layer (GCL), inner plexiform layer (IPL), inner nuclear layer (INL), outer plexiform layer (OPL) and outer nuclear layer (ONL). PED with fibrin leakage is observed on 3-D imaging (white arrow).
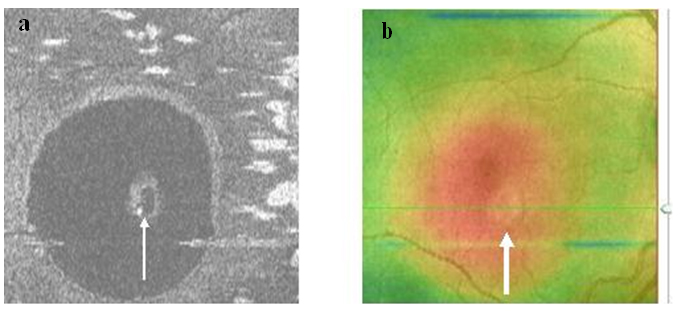
Figure 9a-b. The PED on SDOCT “en-face” scan (thin arrow) (a) and thickness map (thick arrow) (b) (case 2) is round. A dark hypo-reflective center and diffuse hyper-reflective margins are observed on “en-face” scan.
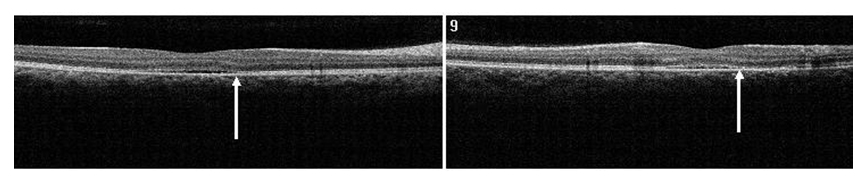
Figure 10. SDOCT confirmed residual presence of the CSD at one month follow-up visit (case 2). The POS appears comparatively thinner but more granulated (arrow). The IS/OS junction line is completely visible.
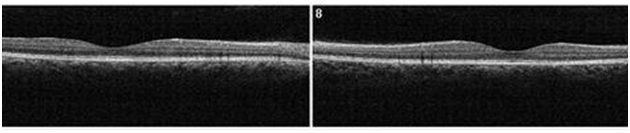
Figure 11. At 4 month from initial presentation, the SDOCT shows complete resolution of the CSC with localized disrupted RPE. Less granulated deposits are visible (case 2).
Case 3. A 37 year-old Hispanic male presented to clinic complaining of loss of vision for one month OS. He indicated that his surroundings “looked blurred, smaller and darker”. He reported having good health and taking no medications. The patient was a tobacco smoker. BVA were 20/20 OD and 20/60 OS. Preliminary tests including pupil responses were unremarkable OU. Blood pressure was 110/70 mm Hg. SLE was generally unremarkable with deep and quiet anterior chambers OU. Goldman tonometry measurements were 17 mm Hg OD and OS. DFE revealed healthy fundus and optic nerves OU with C/D ratios of 0.45/0.45. A CSD was observed encompassing approximately 3 DD at the macula OD (Figure 12). SDOCT confirmed the presence of a CSD and an isolated small PED. A small zone of hyper-reflectivity pattern in the subretinal space was observed proximal to the PED on the SDOCT. The outer retinal layer appeared to be indenting into the subretinal space slightly, proximal to the contact point of the uppermost tip of the hyper-reflective pattern. A hypo-reflective center and diffuse hyper-reflective edgings distinguished the hyper-reflective pattern. The POS appeared thick and somewhat granulated and the IS/OS junction line was not visible (Figure 13). Five concentric, hyper-reflective circles corresponding to upraised retinal layers, namely ILM/NFL,GCL, INL, OPL and ONL were visible on the “en-face” and 3-D imaging scans (Figure 14a-b). On 3-D imaging a slight “dipping” of the outer retinal layer into the subretinal space was also noticed (Figure 14b). The PED on the “en-face” scan appeared nearly round having a hypo-reflective center and hyper-reflective borders (Figure 15). Smoking cessation was recommended as part of the management. During the last follow-up visit (3 month from initial presentation) the patient indicated significant improvement but was not completely asymptomatic. He had reduced the amount of tobacco smoking. BVA were 20/20 OD and 20/25 OS. The CSD was still visible on fundus examination and the SDOCT confirmed the CSD to be partially resolving with a collapsed PED (Figure 16). The hyper-reflective pattern originally seen proximal to the PED was no longer visible. Granulation of the POS appeared to be more widespread but comparatively seemed to be thinner. The IS/OS junction line was now visible. A follow-up appointment was scheduled for one month but the patient did not return to clinic.
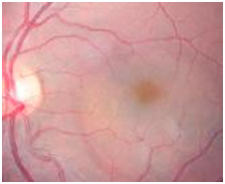
Figure 12. A CSD was observed on fundus examination (case 3).
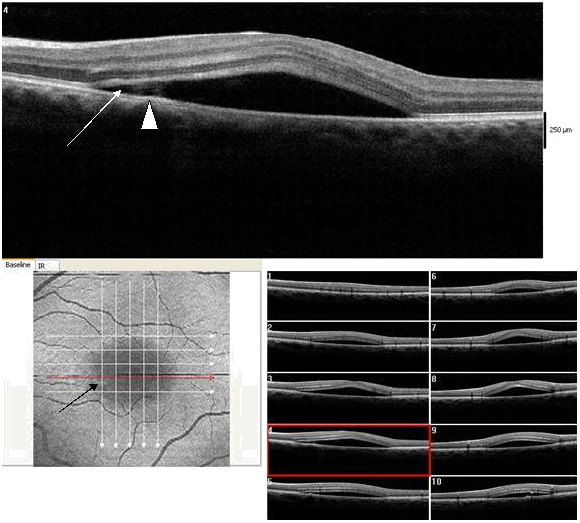
Figure 13. CSD observed on SDOCT with an isolated small PED (dark arrow) (case 3). A small subretinal hyper-reflective pattern is evident proximal to the PED (arrow head). The outer retinal layer appears slightly indented as it contacts the tip of the subretinal hyper-reflective pattern (arrow). A hypo- reflective center and diffuse hyper-reflective edgings distinguish the subretinal hyper-reflective pattern. The POS appears thick and somewhat granulated and the IS/OS junction line is not visible.
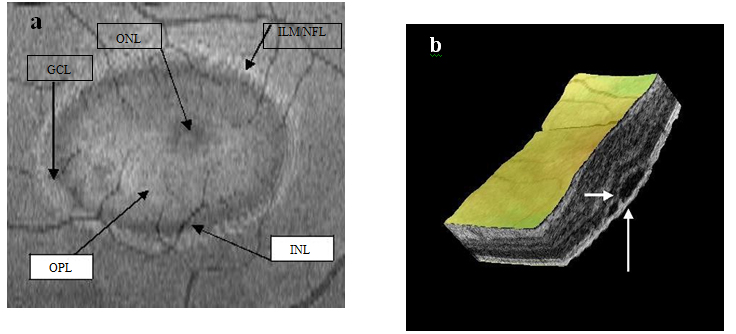
Figure 14a-b. Five concentric hyper-reflective circles (a) (ILM/NFL, GCL, INL, OPL and ONL) are visible on SDOCT “en-face” scan (case 3). The upraised layers and a PED (large white arrow) are observed on 3-D imaging (b). A slight “dipping” of the outer retina layer into the subretinal space is evident (small white arrow) (b).
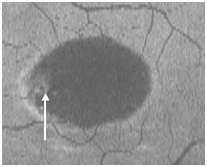
Figure 15. The PED appears on “en-face” scan to be nearly round with a hypo-reflective center and hyper-reflective borders (arrow).
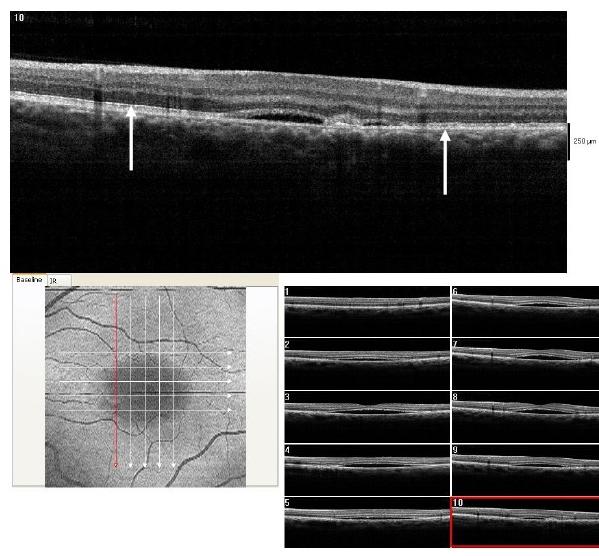
Figure 16. At 3 month from initial presentation, the CSD on SDOCT appears partially resolving with a collapsed PED at the last visit (case 3). A subretinal hyper-reflective pattern is no longer visible. The POS appears to be more granulated, widespread and comparatively thinner (arrows). The IS/OS junction line is visible.
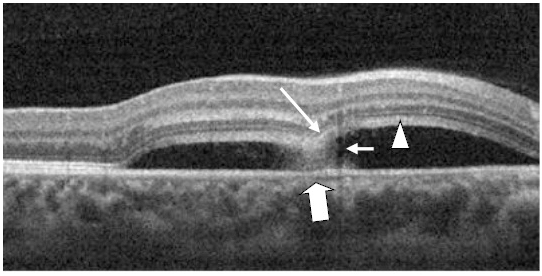
Figure 17. A CSD (case 4) with a subretinal hyper-reflective pattern is observed to emanate from an area of RPE disruption (thick white arrow). The outer layer of the detached retina appeared to dip into the subretinal space as it contacts the uppermost tip of the subretinal hyper-reflective pattern (large white arrow). The section cut shows that the subretinal hyper-reflective pattern has a para-central hypo-reflective zone while its borders are diffuse and hyper-reflective (small white arrow). The POS appears thickened and slightly granulated (arrow head). The IS/OS junction line is not visible at some areas.
Case 4. A 24 year-old Hispanic female presented to clinic for a contact lens follow-up 2 weeks after the initial fitting. She was complaining of constant blurriness in the right eye that had started about one week before. The patient attributed the blurriness to the contact lens wear. Upon further questioning, she described the blurriness as a darker static area in the central vision of her right eye. The patient indicated she was pregnant for 22 weeks and was taking prenatal vitamins. Entering visual acuities with the contact lens at distance was 20/30+2 OD with NIPH and 20/20-2 OS. The patient was correctable to 20/20-2 OD with a mild hyperopic shift. Preliminary findings including pupil responses were unremarkable. SLE showed deep and quiet anterior chambers but otherwise unremarkable OU. Goldman tonometry measurements were 11 mm Hg OD and 12 mm Hg OS. DFE revealed C/D ratios of 0.25/0.25 with healthy rim tissue and disc coloration OU. The macula and posterior pole was healthy OS as well as the fundus periphery OU. A CSD of approximately 3.5 DD in size nasal to the macula, but including the fovea, was observed OD. On SDOCT, CSD was confirmed. The POS appeared thickened and slightly granulated. The IS/OS was not visible in some areas. Approximately at the center of the CSD, a hyper-reflective pattern was observed to emanate from a RPE disrupted zone into the subretinal space. The outer retinal layer appeared to dip in as it contacted the uppermost tip of the hyper- reflective pattern (Figure 17). The section scan showing the hyper-reflective pattern had a hypo-reflective zone para-centrally, while its borders were diffuse and hyper- reflective. Five concentric and hyper-reflective circles corresponding to upraised retinal layers, namely ILM/NFL, GCL, and INL, were visible on the “en-face” and 3-D imaging scans. An internal invagination within the detached area allowed revisualization of the outer hyper-reflective and concentric circles representing the GCL and ILM/NFL inner layers (Figure 18a-c). On 3-D imaging a slight dipping of the outer retinal layer was also noticed (Figure 18b). A diagnosis of CSC was made. The patient was educated on possible etiological factors and associated links with pregnancy. In addition she was informed that initial management required observation for about 3-6 months since in many cases CSC self-resolves. The CSC completely resolved 3 months later.
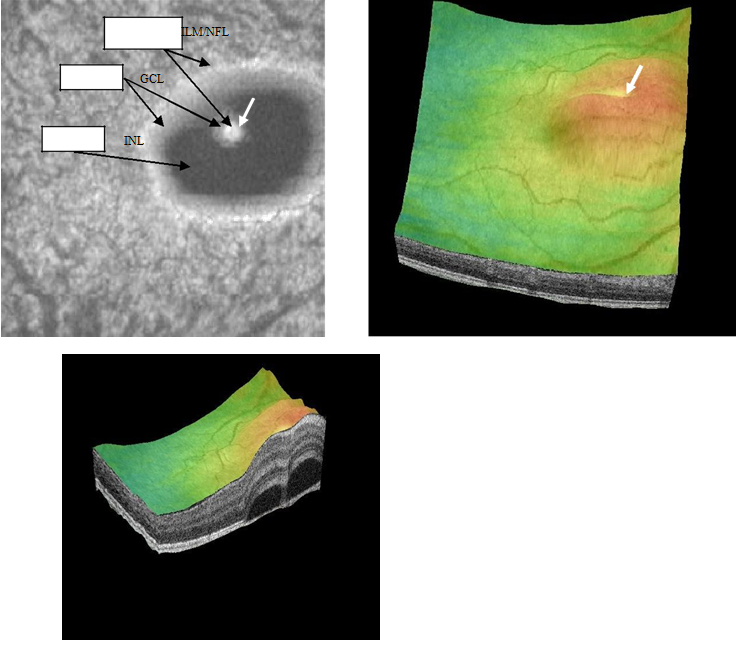
Figure 18a-c. Five concentric, hyper-reflective, circles corresponding to upraised retinal layers, namely ILM/NFL, GCL and INL are visible on “en-face” and 3-D scans. The INL area appears wider as the detachment has a mesa-like contour at this inner retinal layer. An internal invagination within the mesa-like shaped detached area allows revisualization of outer hyper-reflective concentric circles representing inner layers namely GCL and ILM/NFL (case 4).
Discussion
Initial evaluation of CSC using TDOCT revealed previously concealed characteristics of this class of macular pathology [13-17]. Mitarai and associates imaged 27 eyes of 26 patients with CSC and described irregularities within the RPE formations that corresponded to areas of PED’s in 17 of the affected eyes. They also indicated that FA leakage matched the sites of the abnormal RPE observed on TDOCT in 26 of the eyes with CSC [13]. Iida and co-investigators reported the presence of a grayish white lesion observed on fundus examination and located in zones of FA dye leakage. A hyper-reflective substance viewed on TDOCT appeared to connect the neurosensory retina and the RPE. Iida and co- investigators indicated that the site of the hyper-reflective substance corresponded to the location of the white lesion observed on fundus examination. They suggested that this substance represented accumulated fibrin exudates [14]. Similar correlations between the area of RPE detachments and FA leakage points have been documented by other investigators using TDOCT [15-17]. Hussain and associates using TDOCT detected a hyper-reflective mass that bridged the RPE and neurosensory retina causing it to tent or sag in and described this effect as a “dipping pattern”. They suggested that subretinal fibrin accounted for this effect and considered that this hyper-reflective pattern observed on TDOCT was associated with the “inkblot” type leakage typically described on FA [16]. Other investigators have furthermore described development of retinal thinning in chronic CSC cases using TDOCT [14,15].
The advent of OCT technology, leading to higher resolution, allowed imaging of finer microstructure details and variable clinical findings associated with CSC. More current papers have provided detailed descriptions of CSC morphology using SDOCT [1,4,6-20]. Fujimoto and associates provided a Fourier-domain OCT (FDOCT) analysis of 21 eyes with acute CSC [6]. They documented during the initial presentation that the posterior layer of the detachment of the majority of eyes was smooth, the POS appeared thickened and 4 eyes exhibited granular deposits. In approximately 12 of 17 eyes without granular deposits initially, the posterior retinal layer became granulated and the POS decreased in thickness at later stages. They indicated that the subretinal granulation corresponded to white deposits observed on fundus examination. These granular deposits tended to disappear following sensory retina reattachment. The IS/OS was absent at initial presentation but became visible in eyes when the CSC resolved. Coexisting PED’s were noted in 61% of leakage sites of the 21 eyes studied while 35% demonstrated irregularities of the RPE at the FA leakage spots. Miniscule RPE defects were noticed in three eyes which exactly matched the location of focal leakage on FA.
The investigators similarly noted in 12 of 23 leakage areas a “hyper-reflective shadow” in the subretinal space with 8 of the 11 leakage sites showing a transparent center. In two eyes they described a “string-like” hyper-reflective line bridging the posterior surface of the sensory retina and the PED. In one eye it was noted to correspond to the “smokestack” location on FA. At 10 leakage locations they reported an associated sagging or dipping of the posterior retinal layer of the sensory detachment into the subretinal space [6]. Kim and co-investigators analyzed 63 eyes of patients with acute CSC and reported similar findings to those of Fujimoto’s [7]. Kim and associates documented thickening of the POS as well as granular deposits in all eyes with CSC in their study analyzed with SDOCT. Furthermore, the IS/OS junction line was invisible during initial presentation but became visible upon resolution of the CSC in the majority of the eyes (51 eyes). Upon resolution of the CSC, the foveal thickness (FT) was noticeably thinner than that of the unaffected eye. The BVA was comparatively better also in eyes with higher FT ratio (FT affected eye/FT unaffected eye) [7]. Fourteen eyes exhibited a hyper-reflective area in the subretinal space that was considered to be fibrin exudate proximal to FA leakage areas. They also indicated that directly above nine leakage sites the posterior sensory retina layer “sagged” or “dipped-in” as a result of fibrin exudate traction- induced ONL swelling. Moreover, Kim and associates observed a tiny RPE defect within a PED corresponding to the exact location of a leakage site on FA. Similarly they described focal areas of fundus hypo-autofluorescence that exactly corresponded to areas of focal RPE leakage on FA in only two eyes. Kim and associates reported the presence of PED’s in 31.9% of eyes but commented that they considered small or atypical PED’s as RPE anomalies and therefore the actual percentage could be considered higher and comparable to others studies. The authors suggested that an RPE defect could be so small that it may not be even visualized with SDOCT or fundus autofuorescence [7].
Twenty one eyes with CSC, six of them consisting of recurrent episodes, were analyzed using SDOCT and confocal scanning laser ophthalmoscopy (CSLO) by the group led by Shinojima [9]. They also performed concomitant FA and ICGA on their patients. Fourteen eyes were reported to have an “inkblot” leakage pattern while seven manifested a “smokestack” configuration on FA. Leakage points on FA associated with anomalous RPE on SDOCT-CSLO were observed in all eyes examined. They encountered PED’s in 71% of eyes examined. Fifteen eyes had PED’s with leakage points located within the PED’s or at its margins on FA. The authors commented that RPE morphological irregularities observed on SDOCT- CSLO consistently corresponded to FA leakage sites while similarly the leakage points may occur at any location on the PED [9]. SDOCT imaging of subretinal fibrin leakage that appears to arise from surrounding lateral marginal locations within a PED has been documented by other researchers as well [4,6- 7]. Shinojima and associates also concurred a suggested by other investigators [6,7] that the leakage point may occur at a deteriorating intercellular cell junction consequently generating areas with minute focal fibrin leakage [9]. Fibrin exudates were also described on SDOCT-CSLO as having high reflectivity and located between the RPE and sub-neurosensory retinal space. Shinojima and co- investigators considered that that the fibrin components originated from the choriocapillaris and gained access into the subretinal space as it disseminated through miniscule RPE defects.
SDOCT “en-face” scans and enhanced depth imaging (EDI) has allowed the visualization of CSC features form a distinct perspective. Lehman and associates analyzed the SDOCT “en-face” C-scan and EDI of 29 eyes with acute or latent CSC [10]. Concentric hyper-reflective circles corresponding to the entire anterior- posterior layers of the detached retina of the CSC could be observed in some eyes.
Hyper-reflective particles were also visualized lining the POS and underneath the RPE. The hyper-reflective deposits were present in all eyes with active chronic CSC. Only in two eyes with acute onset CSC were the hyper-reflective deposits detected. A PED was observed in 75% of the studied eyes. On C-scan the PED appeared to be generally circular and was surrounded by a hyper-reflective edge. This description of a PED as predominantly round shaped with hyper-reflective borders and a central clear hypo-reflective area have been similarly documented by other investigators using the “en-face” SDOCT scan [8]. Using EDI the choroid was shown to be thicker in recurrent and chronic cases. Similarly, dilated vessels in the choroid were observed in all eyes with CSC which corresponded to the areas of neurosensory detachment and/or PED. Hypo-reflective cysts, characterized as choroidal cavitations, were viewed in two eyes beneath the choriocapillary layer.
Lehman and associates suggested that the hypo-reflective cysts may represent areas of choroidal ischemia associated with focal FA fluorescence leakage. Additionally, hyper-reflective pinpoints were described within the choriocapillary layer in eleven eyes, none belonging to the latent category. The investigators suggested that this observation may be indicative of an active pathological phase of CSC.
Ferrara and co-investigators used EDI to evaluate fifteen eyes of thirteen patients with chronic CSC [1]. They observed a PED in all eyes investigated. C-scan images disclosed hypo-reflectivity at areas of RPE detachment or loss. In one case, the location of the RPE disruption corresponded to the location of ink-blot pattern leakage noted on FA. Similar to findings by Lehman and associates, hypo-reflective spots at the level of the choriocapilary layer were observed in eight eyes using EDI. Differing from Lehman’s view, Ferrara and co-investigators suggested that the hypo-reflective spots may represent enlarged choroidal vasculature.
Likewise, Ferrara and co-investigators noted that the location of these choriocapillary layer anomalies were beneath the areas of the PED or RPE disruption. Focal dilatation of choroidal vessels was observed in 3 eyes while diffuse choroidal vessel dilatation was noted in 12 eyes using EDI. When comparing SDOCT findings to the ICGA results, it was noted that the choroidal vessel dilatation corresponded to zones of ICG hyper-fluoresence. Inamaura and associates conducted an evaluation of 12 eyes with CSC and 16 eyes with diffuse retinal pigment epitheliopathy (DRPE) using EDI [11]. The CSC was bilateral in 6 eyes while in another 6 eyes the contralateral eye was not affected. Inamaura and associates reported that the mean choroidal thickness of studied eyes with CSC was significantly different and 214 um thicker than the documented measurements for normal eyes. The choroidal thickness in the studied eyes with unilateral CSC was approximately 20% thicker compared to that of the contralateral uninvolved eye. The authors considered that these findings suggested that patients with CSC exhibit choroid vascular hyper-permeability.
Our SDOCT observations of the four cases with acute onset CSC are comparable and manifested similar imaging details to those reported in the literature [1,4-17]. All cases showed PED associated with sensory detachment at the macula. Thickened POS with granulated deposits were also noted. At initial presentation, various sections of the IS/OS junction line were not visible. As the CSC resolved, granulated deposits tended to disappear, the POS became comparably thinner and the IS/OS junction line became visible. In one case the FT became thinner relative to the unaffected eye. As indicated by varied investigators the IS/OS junction line visibility diminishes due to the increase swelling of the overlying POS [6,7]. It becomes visible again once the swelling gradually dissipates. Likewise, the granular deposition of the POS has been attributed to the accumulation of shed outer segment debris [6,7]. With the resolution of the CSC the reconstitution of the retinal integrity and regeneration of normal phagocytosis allows the IS/OS to be visible again and concurrently, the granular deposits to vanish in some cases. As suggested by Kim and associates [7] the observed relative decrease in FT of the affected eye may be an indication of photoreceptor, and possibly outer retinal layer damage.
Although we did not observe the type of hyper-reflective pattern described to be associated with a classic “smokestack” fibrin leakage pattern on FA and ICGA, a hyper-reflective pattern reported to be correlated to an “inkblot” fibrin leakage pattern on FA and ICGA [1,6,7,9,10] was noticed in all cases. This type of subretinal hyper-reflective pattern in our series appeared to be emanating from the site of a PED. By comparing the SDOCT imaging of the hyper-reflective pattern in our series and those previously documented, we have elaborated a supplementary interpretation of this phenomenon. As suggested by previous investigators, springing out from a PED site there may be fibrin or protein material mixed with liquefied substances from the choroidal circulation. We suggest that depending on the size of the RPE defect within a PED, the less dense contents may disperse distinctly from the denser fibrin component. The fibrin thus dissipates to the periphery or perimeter of the turbulent flow, while the liquefied component distributes at its core. Consequently the OCT image will display in the case of an “inkblot” fibrin leakage pattern, a hypo- reflective center corresponding to the less dense or more diluted contents of the turbulence, surrounded or enveloped by a zone of hyper-reflectivity constituting denser fibrin material. Smaller and minute RPE breaks [6,7,9] within a PED may give rise to a collimated and concentrated fibrin particle flow not allowing for marginal dispersion from the less dense fluid content. In such case the OCT may image a solid string-shaped configuration consistent with a “smokestack” fibrin leakage pattern on FA. The location of the RPE rupture, whether it is located at the margin or at the tip of the PED [9], may also affect the spatial orientation of the leakage pattern. We consider that the lateral location of the subretinal hyper-reflective pattern noted in the first and second case seems to initiate from a marginal RPE break within the PED. The previously described “dipping” effect of the posterior retinal layer into the subretinal space was observed in all of our cases. We believe that this does not arise secondary to a pulling of the thickened POS by the fibrin material towards the RPE at the leakage site [6]. Instead, this may result from the hydrostatic and fibrin particle pressure indenting and folding the outer retina layer. This is facilitated by a swollen moldable POS. Although we could not visualize all the concentric layers of the CSC and PED features previously documented [1], with the use of the “en- face” scan we were able to discern five to six concentric circles layer in all of our cases. Lehman and co-investigators had documented similar concentric hyper- reflective circles associated with CSC. Likewise, the “en-face” scan of the PED observed in all of our cases, had analogous features (mostly round with a clear center) to those described by Lehman and other investigators [1,8]. We were not able to demonstrate differences in choroidal thickness or its vascular network in our four cases as those previously mentioned in the literature. The pathological mechanism underlying CSC although not entirely elucidated has been more closely understood through the use of OCT. This impressive technology has provided consistent support suggesting CSC results from a breakdown of choroidal vascular permeability [1,6,7-10,20-21]. Various case series have determined that a disruption of the choroid circulation likely results in damages to the RPE with an increased accumulation of fluid into the subretinal space [1,6,7- 10,20-21]. Support has been documented through SDOCT images displaying disruptions of the RPE, IS/OS line and POS. The suggestion that a choroidal vascular system malfunction may give rise to CSC is also supported by the SDOCT observation of PED associated with a hyper-reflectivity pattern corresponding to FA or ICGA leakage sites, and considered to represent fibrin exudation from the choroid. The “en-face” scan visualization of an increase in the choroidal thickness as well as vascular network dilatations in affected eyes similarly corroborates this hypothesis.
SDOCT evaluations of patients with CSC have provided insight and evidence supporting the current management of CSC. Kim and associates [7] documented a complete resolution of subretinal fluid (SRF) in 70% (7 of 10 eyes) of untreated eyes. Reabsorption of SRF in the group receiving focal laser treatment group was similar to that of the untreated group (82.4% or 14 of 17 eyes). The half-dose photodynamic therapy (PDT) treatment group was lower than both focal laser treated and untreated group (50.0% or 4 of 8 eyes). However they specified that since treatment was not initiated until 2 to 3 months following the initial event due to observation, the actual percentage of patients that had resolution of the SRF without treatment may likely be lower. There was a higher percentage of SRF resolution noted in treated eyes (72% or 18 of 25 eyes) compared to untreated eyes (20.0% or 7 of 35 eyes). They also remarked that although the spontaneous resolution of CSC is approximately 80%, their percentage of untreated patients with SRF resolution will still be comparably smaller (55.6% or 35 of 63 eyes) than in the treatment group even when assuming that all the patients that were lost to follow up recovered. Since retinal degeneration may result from protracted detachments, the authors suggested that selected therapy in these cases could be beneficial. Kim and associates did not notice foveal IS/OS junction line disruption in either treatment groups. They indicated that these treatment modalities may be advantageous and safe for eyes with evidence of leakage within the sub or juxta- foveal location [7].
Shinojima and co-researchers observed retinal reattachment in 4 of 6 eyes with CSC out of a total of 9 eyes that have received photocoagulation therapy [9]. They commented that reflective deposits within the subretinal space resolved in 4 of the treated eyes while in 3 eyes the deposits persisted below the RPE space following treatment. Disruption of the RPE and PED’s were still present in 2 treated eyes. In three eyes the PED’s turned into a RPE with an irregular surface and in one patient the irregular surface of an RPE became regular.
A possible contributing role of vitreous traction in the pathogenicity of CSC has also been theorized [19]. Theocharis and Lima used SDOCT to study eyes with either chronic or non-chronic CSC vs. normal as a control group [19]. From their observations they concluded that: 1) the vitreo-retinal interface varied between chronic, non-chronic and normal populations, 2) the vitreo-retinal alterations tended to be bilateral and to occur earlier in patients with CSC than in normal controls, and 3) that chronic forms lose the symmetrical pattern appearance at older ages compared to non-chronic forms and normal subjects. In addition, they indicated that the changes in vitreo-retinal interface persisted or surfaced concurrently with the onset of CSC. The authors recommended that additional studies should evaluate whether recurrent or chronic occurrences affect vitreous- retinal interface or that conversely, the vitreo-retinal interface influences the onset and development of CSC [21].
In conclusion, we consider that the subretinal hyper-reflective pattern observed on SDOCT may be affected by the size and location of the RPE defect within the PED. Similarly, the outer retinal “dipping” into the subretinal space observed associated with the hyper-reflective pattern may occur secondary to the pressure exerted by fluid and fibrin particles springing from the PED on this retinal layer. The “dipping” into thesubretinal space of the outer retinal layer may be enabled by an edematous and swollen POS.
References
- Ferrara D, Mohler KJ, Waheed N, Adhi M, Liu JJ, et al.(2014) En-face enhanced-depth swept- source optical coherence tomography features of chronic central serous chorioretinopathy. Ophthalmology 121: 719-726. [Crossref]
- Okushiba U, Takeda M (1997) Study of choroidal vascular lesions in central serous chorioretinopathy using indocyanine green angiography. Nippon GankaGakkaiZasshi101: 74-82. [Crossref]
- Rahbani-Nobar MB, Javadzadeh A, Ghojazadeh L, Rafeey M, Ghorbanihaghjo A (2011) The effect of Helicobacter pylori treatment on remission of idiopathic central serous chorioretinopathy. Mol Vis17:99-103. [Crossref]
- Saxena S, Sinha N, Sharma S (2012) Three-dimensional imaging by spectral domain optical coherence tomography in central serous chorioretinopathy with fibrin. J OculBiol Dis Infor22: 149-153. [Crossref]
- Haimovici R, Koh S, Gagnon DR, Lehrfeld T, Wellik S, et al.(2004) Risk factors for central serous chorioretinopathy: a case-control study. Ophthalmology 111: 244- 249. [Crossref]
- Fujimoto H, Gomi F, Wakabayashi T, Sawa M, Tsujikawa M, et al.(2008) Morphologic changes in acute central serous chorioretinopathy evaluated by fourier-domain optical coherence tomography. Ophthalmology 115: 1494-1500. [Crossref]
- Kim HC, Cho WB, Chung H (2012) Morphologic changes in acute central serous chorioretinopathy using spectral domain optical coherence tomography. Korean J Ophthalmol26: 347-354. [Crossref]
- Lumbroso B, Savastano MC, Rispoli M, Balestrazzi A, Savastano A, et al.(2011) Morphologic differences, according to etiology, in pigment epithelial detachments by means of en-face optical coherence tomography. Retina 31: 553-558. [Crossref]
- Shinojima A, Hirose T, Mori R, Kawamura A, Yuzawa M (2010) Morphologic findings in acute central serous chorioretinopathy using spectral domain-optical coherence tomography with simultaneous angiography. Retina 30: 193-202. [Crossref]
- Lehmann M, Wolff B, Vasseur V, Martinet V, Manasseh N, et al. (2013) Retinal and choroidal changes observed with 'En-face' enhanced-depth imaging OCT in central serous chorioretinopathy.Br J Ophthalmol97:1181-1186. [Crossref]
- Imamura Y, Fujiwara T, Margolis R, Spaide RF (2009) Enhanced depth imaging optical coherence tomography of the choroid in central serous chorioretinopathy. Retina 29:1469-1473. [Crossref]
- Wang GH, Zhang J, Zhang D, Lv FL, Wang LX (2011) Value of three-dimensional optical coherence tomography and fundus photochromy in correlating the fluorescein leaking sites of acute central serous chorioretinopathy. Med PrincPract20: 283-286. [Crossref]
- Mitarai K, Gomi F, Tano Y (2006) Three-dimensional optical coherence tomographic findings in central serous chorioretinopathy. Graefes Arch ClinExpOphthalmol244: 1415-1420. [Crossref]
- Iida T, Hagimura N, Sato T, Kishi S (2000) Evaluation of central serous chorioretinopathy with optical coherence tomography. Am J Ophthalmol129: 16-20.[Crossref]
- Montero JA, Ruiz-Moreno JM (2005) Optical coherence tomography characterisation of idiopathic central serous chorioretinopathy. Br J Ophthalmol89: 562-564. [Crossref]
- Hussain N, Baskar A, Ram LM, Das T(2006) Optical coherence tomographic pattern of fluorescein angiographic leakage site in acute central serous chorioretinopathy. Clin Experiment Ophthalmol34: 137-140. [Crossref]
- Kamppeter B, Jonas JB (2003) A Central serous chorioretinopathy imaged by optical coherence tomography. Arch Ophthalmol121: 742-743.
- Ibrahim MA, Sepah YJ, Symons RC, Channa R, Hatef E, et al.(2012) Spectral- and time-domain optical coherence tomography measurements of macular thickness in normal eyes and in eyes with diabetic macular edema. Eye 26: 454-462. [Crossref]
- Leitgeb R, Hitzenberger C, Fercher A (2003) Performance of fourier domain vs. time domain optical coherence tomography. Opt Express11: 889- 894. [Crossref]
- de Boer JF, Cense B, Park BH, Pierce MC, Tearney GJ, et al.(2003) Improved signal-to-noise ratio in spectral-domain compared with time-domain optical coherence tomography. OptLett28: 2067-2069. [Crossref]
- Theocharis IP, Lima LH (2012) Vitreoretinal interface in central serous choroidopathy: a retrospective case-control study. ActaOphthalmol90: e505-e511. [Crossref]