Abstract
Active hexose correlated compound (AHCC) is a mixture of glucan-rich polysaccharides isolated from the culture extract of shiitake mushroom mycelium. Multiple bioactivities, including immune regulation, have been reported in both basic and clinical studies. This compound has also been used as an adjunct treatment for cancer, but no study has examined whether AHCC can alter the metabolism of therapeutic agents, such as anticancer drugs, in the liver by altering the expression of drug-metabolizing enzymes. Here, we assessed AHCC-induced changes in the expression of genes encoding drug-metabolizing enzymes using a DNA microarray.
A 3% AHCC solution was provided ad libitum for 5 days to ICR mice, followed by liver excision, total RNA extraction, and DNA microarray analyses using the Genopal® Metabolic chip (195 genes) and Oxidative stress chip (219 genes). The Metabolic chip identified eight differentially expressed genes (DEGs), defined by a minimum 2.0-fold change in expression from that in control mice. Of these DEGs, two involved in drug metabolism exhibited modest upregulation (CYP3A11, signal intensity ratio [SIR] = 1.15 and CYP7A1, SIR = 1.02). In addition, the Oxidative stress chip identified 23 DEGs, of which five (BCL10, BCL6, ICAM1, MAP3K5, and CASP9) showed very strong suppression (SIR < -10).
Oral administration of AHCC to healthy mice altered the expression of multiple genes in the liver, including slight upregulation of drug-metabolizing enzymes and marked suppression of genes involved in tumor necrosis factor signaling and apoptosis. Thus, AHCC may protect liver function against the adverse effects of anticancer agents, such as inflammation, while having little effect on drug metabolism.
Key words
active hexose correlated compounds, apoptosis, DNA microarray, metabolic enzyme
Introduction
Liver metabolism is a critical factor influencing the Absorption, Distribution, Metabolism, and Excretion (ADME) of clinical drugs, thereby influencing their efficacy. Metabolizing enzymes belong to two groups: Phase I mediating oxidation and reduction, and Phase II mediating conjugation [1]. If these metabolizing enzymes are strongly induced or suppressed by other bioactive compounds, such as in food, dietary supplements, or adjunct treatments, primary drug absorption and bioavailability can be substantially altered, resulting in adverse drug−drug interactions. Therefore, the effects of bioactive compounds in food, dietary supplements, and herbal medications on drug metabolizing enzymes must be determined for the evaluation of potential interactions [2].
Active hexose correlated compound (AHCC), a popular nutritional supplement found in the culture extract of shiitake mushroom mycelium, has been shown to alter the expression of hepatic drug-metabolizing enzymes, including the induction of CYP2D6 [3]. Alternatively, there are no detailed reports on the ADME effects of AHCC following oral intake. If polysaccharides are the main bioactive ingredients of AHCC, then changes in liver function are possible as many polysaccharides can be absorbed and transported to the liver intact. We comprehensively analyzed the gene expression changes in the liver following oral administration of AHCC using DNA microarrays to assess the potential for altered drug metabolism in vivo.
DNA microarrays have found wide applications in disease diagnosis, detection of bacteria and viruses, and analysis of polymorphisms [4]. As it is difficult to analyze all gene expression changes and possible associations with biological functions, we narrowed down the target genes using focused DNA microarrays; Genopal® (Mitsubishi Rayon. Co., Ltd., Tokyo, Japan). Each of these microarrays contain approximately 200 gene probes within functional groups and detect gene expression changes with high reliability [5-7].
Materials and methods
Materials
Active hexose correlated compound (AHCC) powder was supplied by Amino UP Chemical. Co. LTD. (Sapporo, Japan) and dissolved in distilled water to prepare a 3% (W/V) stock solution.
Animals
Six-week-old ICR male mice were purchased from Charles River Japan, Inc. (Kanagawa, Japan). They were housed in individual cages under a 12-h light–dark cycle at 23 ± 1°C and 55 ± 15% humidity. After 1 week of acclimation, the mice were divided into two groups (n = 5 per group), a Normal group and a 3% AHCC group. The Normal group had ad libitum access to water while the 3% AHCC group had ad libitum access to the 3% AHCC aqueous solution. At the end of the experiment, the animals were sacrificed using ether anesthesia to obtain liver samples for gene chip analysis.
This study conformed to the Guiding Principles for the Care and Use of Experimental Animals of Hokkaido Pharmaceutical University (published 1998, revised in 2001 and 2007). The protocol approval number is H27-010.
Plasma analyses
After 5 days of ad libitum access to water or 3% aqueous AHCC, all mice were sacrificed to obtain blood and liver samples. Blood samples were collected from the caudal vein in PST heparin-containing tubes (BD Japan Co., Ltd., Tokyo, Japan). Whole blood was separated by centrifugation at 12,000 rpm for 10 min, and the plasma was stored at −80°C. The levels of triglyceride (TG), total cholesterol (T-Cho), glucose (GLU), aspartate aminotransferase (AST), and alanine aminotransferase (ALT) in plasma were determined using a DRI-CHEM 4000 Chemistry Analyzer (Fujifilm Medical Co., Ltd., Tokyo, Japan).
RNA extraction
Livers were dissected and stored in RNAlater® Solution (Thermo Fisher Scientific Inc., MA, USA) for 7 days at −80 °C. Total RNA was extracted (n = 2 livers per treatment group) using an RNeasy Lipid Tissue Mini Kit (Qiagen Co., Ltd., Venlo, Netherlands). The extracted RNA quality and quantity were assessed on a 2100 Bioanalyzer using the RNA 6000 Nano kit (Agilent Technologies Inc., CA, USA) following the manufacturer’s instructions.
DNA microarrays
cDNA was prepared from the RNA, and biotin-labeled RNA was transcribed and amplified using a MessageAmp biotin-enhanced amplification kit (Applied Biosystems Japan, Tokyo, Japan), according to the manufacturer’s instructions. Biotinylated amplified RNA (aRNA) was fragmented using fragmentation reagents (Applied Biosystems Japan) and then incubated at 94°C for 7.5 min. The fragmentation reaction was terminated by the addition of kit stop solution.
The special Genopal® chips used for DNA microarrays were the Metabolic Chip containing probes for 195 genes and the Oxidative-stress Chip containing probes for 219 genes. The genes detected by the Metabolic Chip include those encoding Phase I cytochrome P450 (CYP) species and Phase II glutathione S-transferase (GST) isoforms. Thirty-six detected genes are involved in drug metabolism as shown in Table 1.
Table 1. List of 36 genes involved in hepatic drug metabolism detected by the Metabolic chip for focused DNA microarray analysis
CYP (cytochrome P450)
CYP1A2,CYP2E1,CYP2C29
CYP2D22,CYP3A11,
CYP4A10,CYP4A12A,
CYP7A1,CYP27A1 |
GSTO (glutathione S-transferase omega)
GSTO1,
GSTO2 |
|
GSTM (glutathione S-transferase mu)
GSTM1,
GSTM2,
GSTM3
GSTM4,
GSTM5,
GSTM6 |
|
GSS (glutathione synthetase)
GSS |
|
GSTA (glutathione S-transferase)
GSTA1,
GSTA2,
GSTA3
GSTA4 |
GSTP (glutathione S-transferase pi)
GSTP1 |
|
GSTT (glutathione S-transferase theta)
GSTT1,
GSTT2,
GSTT3 |
|
GSR (glutathione reductase)
GSR |
GSTZ (glutathione transferase zeta)
GSTZ1 |
|
GSTK (glutathione S-transferase kappa)
GSTK1 |
|
MGST (microsomal glutathione S-transferase)
MGST2,
MGST3 |
|
GPX (glutathione peroxidase)
GPX1,
GPX2,
GPX3 |
|
NDUFS
(NADH dehydrogenase (ubiquinone) Fe-S protein 8)
NDUFS8 |
|
COMT (catechol-O-methyltransferase)
COMT1 |
|
|
Hybridization signals were acquired using a DNA microarray reader with multibeam excitation technology (Yokogawa Electric Co., Tokyo, Japan).
Statistical analysis
Results are expressed as means ± standard error of the mean (S.E). Group means from plasma chemical analyses were compared by analysis of variance followed by pair-wise Student’s t-tests. For analysis of DNA microarrays, a 2.0-fold change in expression, as measured by the signal intensity ratio (SIR, log2 [Sample Signal intensity/Control Signal intensity]), was interpreted as differential expression.
Pathway analysis
The predicted target genes were compared against the Database for Annotation. We performed pathway analysis for DEGs based on the latest Kyoto Encyclopedia of Genes and Genomes database (KEGG, http://www.genome.jp/kegg). This analysis allowed for determination of biological pathways significantly enriched in DEGs [8].
Results
Plasma biochemical examinations
There were no significant changes in plasma levels of TG, T-Cho, GLU, AST, and ALT between Normal controls and 3% AHCC-treated mice (Table 2).
DNA microarray Metabolic Chip
Of the 195 genes detected by the Metabolic Chip, eight exhibited a significant (>2-fold) change in expression (Figure 1). Of these, five were upregulated: cytochrome P450 family 3, subfamily a, polypeptide 11 (CYP3A11); cytochrome P450 family 7, subfamily a, polypeptide 1 (CYP7A1); phosphoenolpyruvate carboxykinase 1, cytosolic (PCK1); mitogen-activated protein kinase 6 (MAPK6); nuclear receptor subfamily 0, group B, member 2 (Nr0b2). Conversely, three genes were downregulated: ATP-binding cassette, sub-family C, member 2 (ABCC2); secreted phosphoprotein 1 (SPP1); and tumor necrosis factor (TNF). These DEGs are summarized in Table 3.
Figure 1. Number of DEGs (2.0-fold change) identified by the focused DNA microarray Metabolic chip
Table 2. Comparison of plasma cholesterol, triglycerides, and liver enzymes between untreated (Normal) and 3% AHCC-treated mice
|
|
Normal |
|
3% AHCC |
TG (mg/dl) |
|
89.4 ± 3.8 |
|
71.4 ± 3.8 |
T-Cho (mg/dl) |
|
121.2 ± 6.3 |
|
110.7 ± 8.2 |
GLU (mg/dl) |
|
99.3 ±19.4 |
|
106.2 ±20.8 |
ALT (IU/l) |
|
29.3 ± 2.7 |
|
27.9 ± 8.4 |
AST (IU/l) |
|
79.1 ± 9.1 |
|
71.7 ± 12.6 |
Blood plasma triglycerides (TG), total cholesterol (T-Cho), glucose (GLU), aspartate aminotransferase (ALT), and alanine aminotransferase (AST) were measured after 5 days of ad libitum access to water (Normal group) or 3% AHCC (mean ± S.E.). There were no significant differences.
Table 3. List of the 8 genes differentially expressed in AHCC-treated mice using the Metabolic chip
Gene symbol |
|
Gene name |
|
Signal intensity ratio (SIR) |
|
CYP3A11 |
|
Mus musculus cytochrome P450, family 3, subfamily a, polypeptide 11 (CYP3A11), mRNA |
|
1.15 ± 0.48 |
|
CYP7A1 |
|
Mus musculus cytochrome P450, family 7, subfamily a, polypeptide 1 (CYP7A1), mRNA |
|
1.02 ± 0.62 |
|
PCK1 |
|
Mus musculus phosphoenolpyruvate carboxykinase 1, cytosolic (PCK1), mRNA |
|
1.42 ± 0.12 |
|
MAPK6 |
|
Mus musculus mitogen-activated protein kinase 6 (MAPK6), transcript variant 1, mRNA |
|
1.14 ± 0.52 |
|
NrOb2 |
|
Mus musculus nuclear receptor subfamily 0, group B, member 2 (NR0B2), mRNA |
|
1.68 ± 0.36 |
|
ABCC2 |
|
Mus musculus ATP-binding cassette, sub-family C (CFTR/MRP), member 2 (ABCC2), mRNA |
|
-1.18 ± 0.86 |
|
SPP1 |
|
Mus musculus secreted phosphoprotein 1 (SPP1), mRNA |
|
-1.80 ± 0.33 |
|
TNF |
|
Mus musculus tumor necrosis factor (TNF), mRNA |
|
-2.50 ± 0.61 |
|
Differential expression defined as a 2.0-fold change SIR > 1.0 or < 1.0
Table 1 shows the SIR for CYP3A11 (1.15 ± 0.48) and CYP7A1 (1.02 ± 0.62), two well known drug metabolism-related genes. The other 34 genes involved in drug metabolism detected by the Metabolic chip were not differentially expressed (data not shown).
DNA microarray oxidative-stress chip
Of 219 genes detected by this chip, 23 were classified as DEG (Figure 2). Figure 3 shows the signals for B-cell lymphoma/leukemia 10 (BCL10), B-cell lymphoma/leukemia 6 (BCL6), Intercellular Adhesion Molecule 1 (ICAM1), Mitogen-activated Protein Kinase Kinase Kinase 5 (MAP3K5), and Caspase 9 (CASP9), all showing strong suppression (SIR < −10) in the 3% AHCC group.
Figure 2. Hierarchical clustering of genes downregulated (green) or upregulated (red) by oral administration of 3% AHCC (center and right lanes) detected by the Oxidative-stress Chip in ICR mouse liver (n = 2). Twenty-three DEGs (2.0-fold change) analyzed using TIGER’s MultipleExperiment Viewer v4.0 software.
Figure 3. Five strongly downregulated genes (SIR < -10) among 23 DEGs detected by the Oxidative-stress Chip.
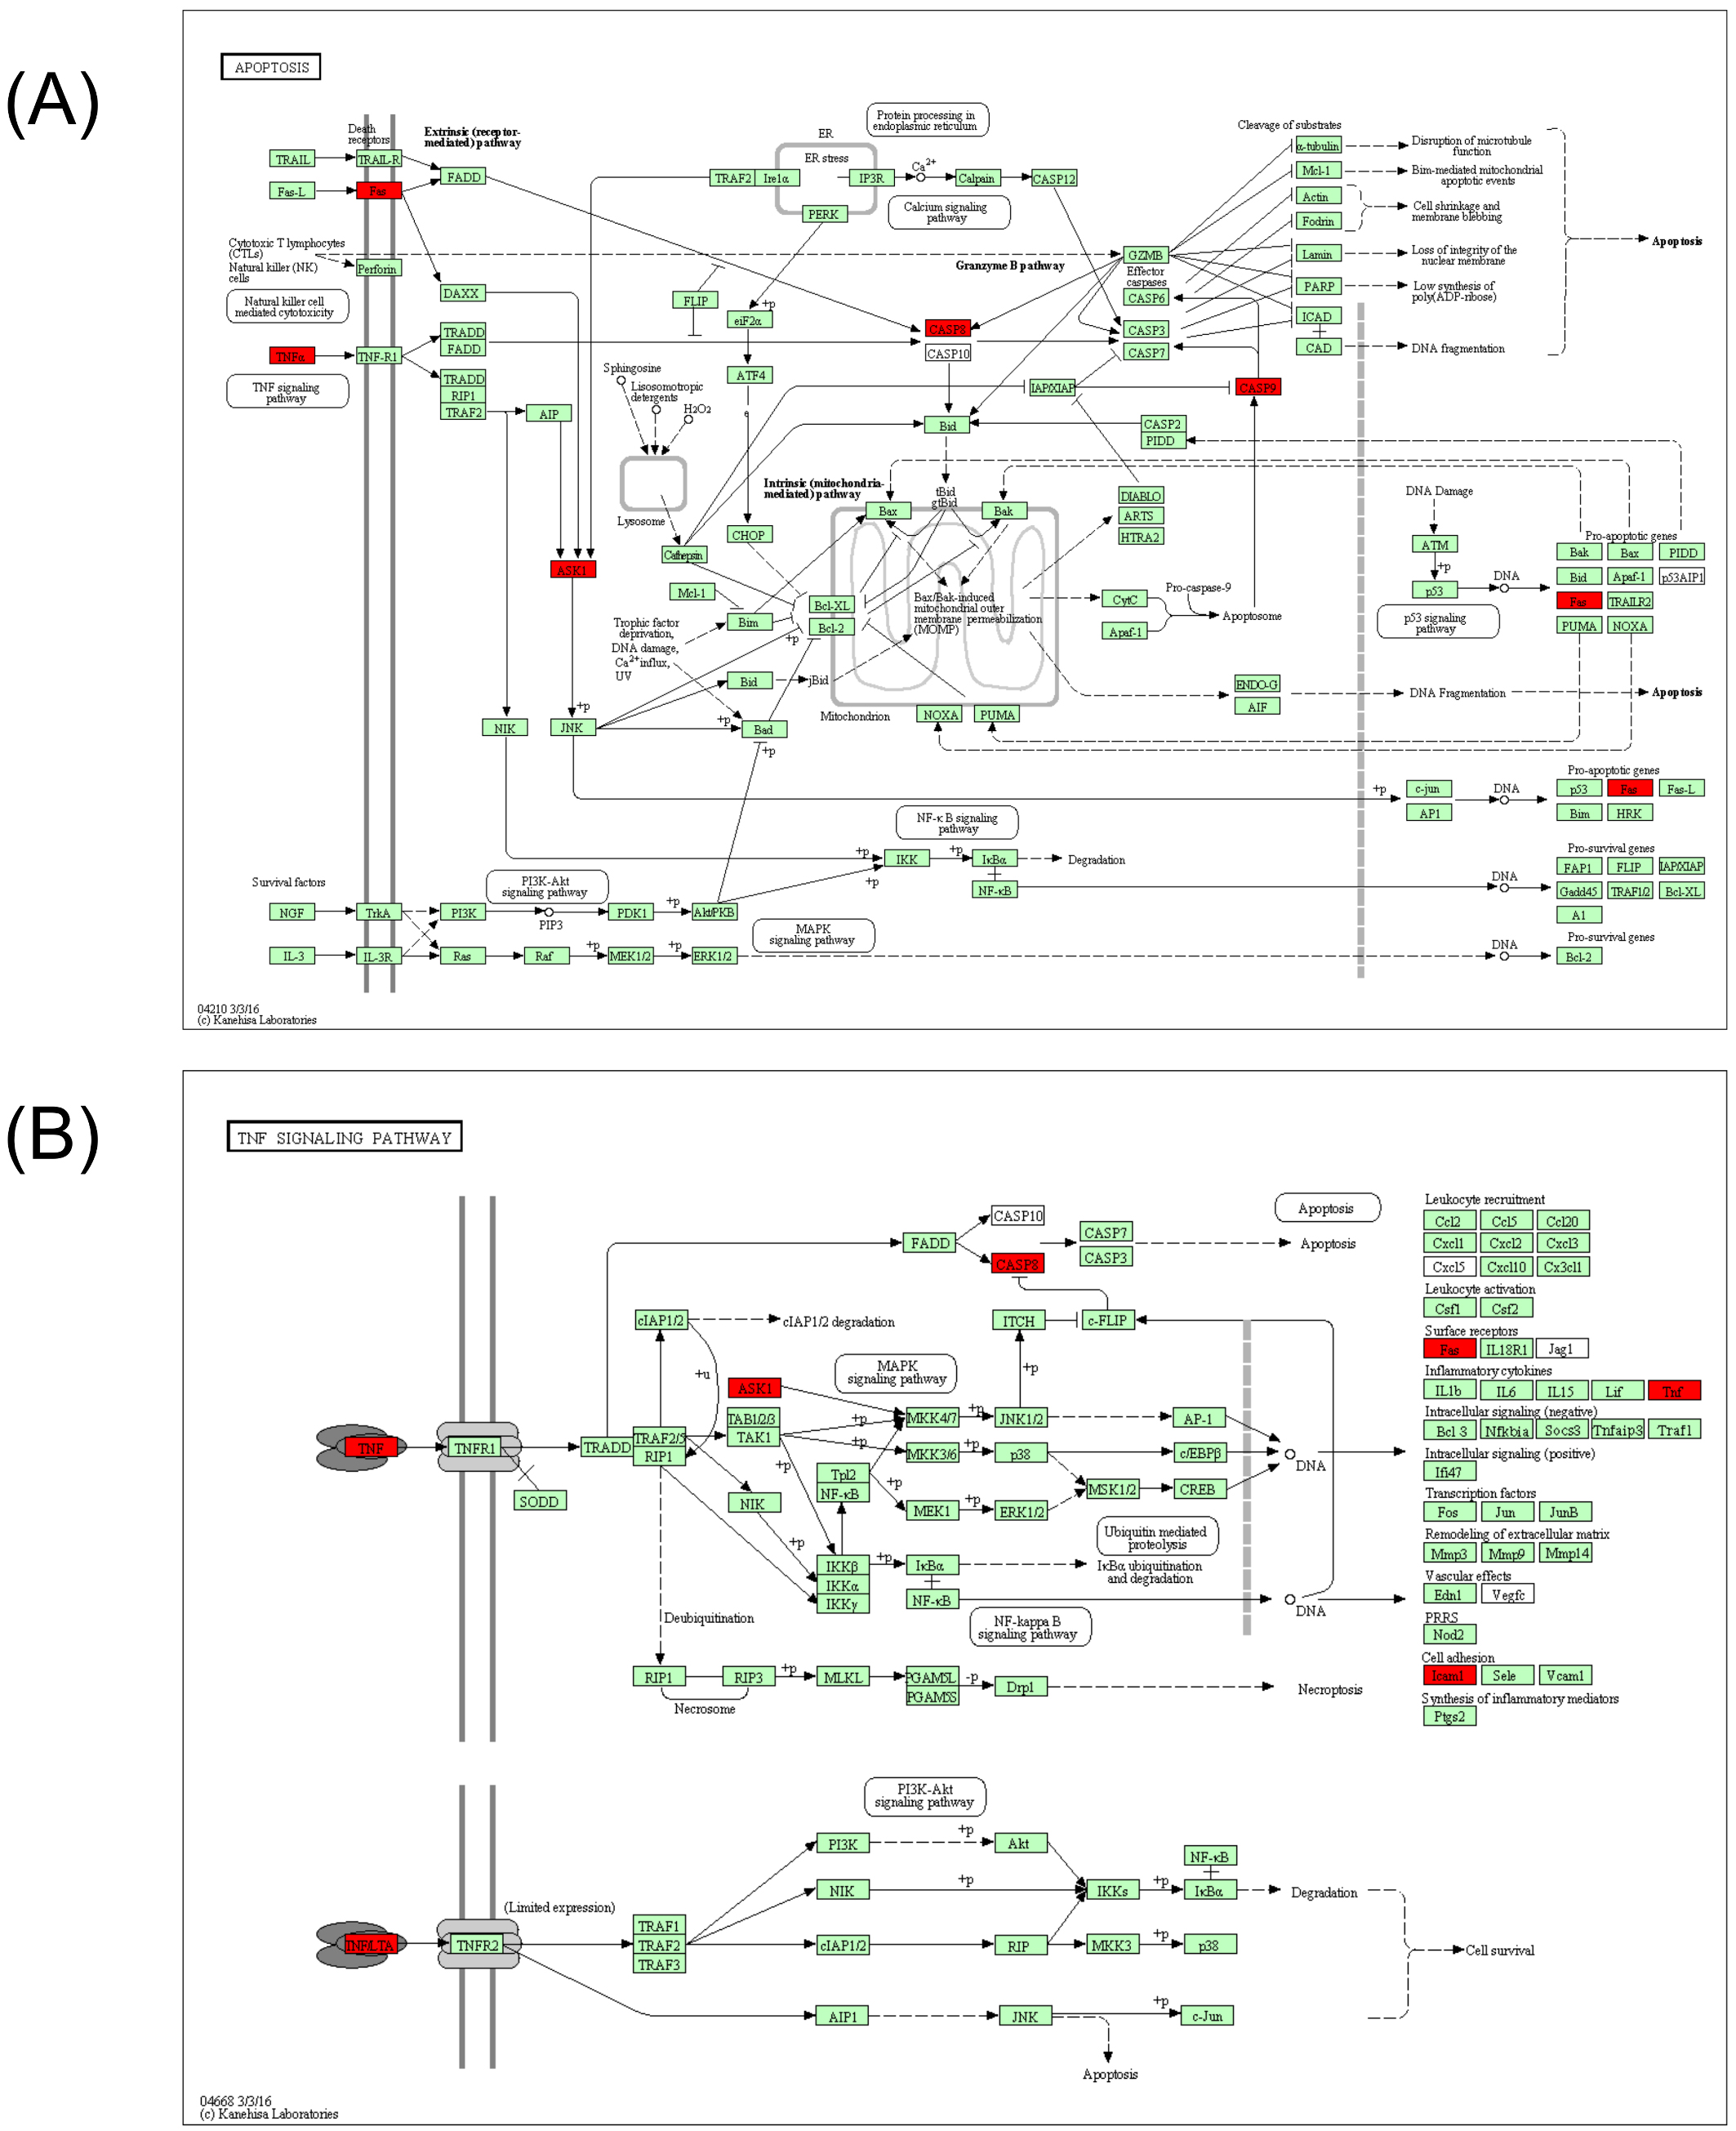
Figure 4. Pathways analysis from KEGG database. According to pathways analysis, two pathways, which are involved in apoptosis (A) and TNF (B) signaling, were downregulated (red collar) by 3% AHCC administration.
Pathway analysis
According to KEGG pathway analysis of genes showing strong suppression (SIR <−2) by the Metabolic and Oxidative-stress chips, two main pathways were downregulated: tumor necrosis factor (TNF) signaling and apoptosis.
Discussion
Active hexose correlated compound is used as a traditional medicine in Asia and its use as a nutritional supplement around the world is increasing. There are many reports on the bioactivity and pharmacological benefits of AHCC in mice and humans. Reported benefits include prevention of the adverse effects of anticancer agents [9,10], immunomodulation [11], anti-influenza effects [12], and protection of hepatocytes [13]. In the present study, we found no changes in plasma biochemical indices, in particular those for hepatotoxicity, in mice allowed to freely consume 3% AHCC over 5 days. This finding is in agreement with previous reports on AHCC safety that found no severe toxicity or adverse effects in healthy rats (single-dose or subacute toxicity) and human subjects in a phase I study [14]. Further, AHCC dramatically suppressed genes involved in two major cellular toxicity pathways, TNF signaling and apoptosis, but had only modest effects on liver metabolic enzymes. These expression changes may in part account for the reduction in inflammation and cytoprotection observed in previous studies.
DNA microarrays can be used for comprehensive analysis of gene expression, but gene expression changes may not parallel downstream protein expression changes and associated signaling. Nonetheless, the powerful suppression of TNF- and apoptosis-related genes strongly suggests that disruption of these pathways underlies the cytoprotective effect of AHCC. Moreover, we provide evidence for the utility of Genopal® microarrays for nutri-genomics, Indeed, these DNA microarrays facilitated efficient functional analyses of genes associated with specific pathways.
The Metabolic Chip used in this study includes 36 DNA probes for detecting phase I and II enzymes, including multiple cytochrome P450 (CYP) species and glutathione S-transferase (GST) families. Among them, only two drug metabolism-relevant genes, CYP3A11 and CYP7A1, were induced in the AHCC group, and the magnitudes were both relatively small (both SIRs close to +1). Mouse CYP3A11 is homologous to the human liver metabolizing enzyme CYP3A5, an enzyme involved in the metabolism of immunosuppressive agents such as tacrolimus [15] and thus a major determinant of efficacy and drug−drug interactions involving these agents. CYP7A1 is known to be the rate-limiting enzyme for catabolism of cholesterol to bile acid [16]. However, we found no significant effects on plasma T-Cho, possibly because the upregulation was modest. These results suggest minimal likelihood of adverse events from combination treatments including AHCC.
Moreover, our analyses using the Oxidative-stress Chip (containing probes to identify 219 genes) identified five genes dramatically suppressed (SIR <−10) by oral AHCC (BCL10, BCL6, ICAM1, MAP3K5, and CASP9). BCL10 is involved in the release of inflammatory cytokines such as TNFα and interleukin (IL)-1β through NF-κB signaling [17]. MAP3K5, otherwise known as Apoptosis Signal-regulating Kinase 1 (ASK1), has been reported to play a major role in inflammation, oxidative stress, oncogenesis, and apoptosis [18]. AHCC also suppresses Apo-1/CD95 (Fas, SIR = −2.7) (data not shown) as well as CASP9, suggesting that it functions as a strong suppressor of apoptotic induction in the liver [19]. Moreover, ICAM1 is associated with inflammation of the vascular endothelium [20] while BCL6 is involved in the differentiation and mutual adhesion of immunocytes [21].
Collectively, these results provide possible molecular mechanisms for the anti-inflammatory and hepatoprotective effects of AHCC. On the other hand, Mallet et al. [22] reported that TLR2 and TLR4 function as AHCC ligands, suggesting that AHCC may activate innate immunity. However, we found that AHCC also suppressed ASK1, which is downstream from TLR4. Thus, the effects of AHCC on immune function may depend on the current immune status of the host.
Acknowledgments
We appreciated Dr. Naoyuki Togawa (Bio-device research group, Mitsubishi Rayon. Co., Ltd., Tokyo, Japan) who aided the present study and provided technical information on DNA microarray analysis during the study period.
Competing interest
The authors declare that they have no competing interests
Reference
- Tibbitts J, Canter D, Graff R, Smith A, Khawli LA (2016) Key factors influencing ADME properties of therapeutic proteins: A need for ADME characterization in drug discovery and development. mAbs 8(2): 229-245. [Crossref]
- Lu TL, Su LL, Ji D, Gu W, Mao CQ (2015) Interaction between CYP450 enzymes and metabolism of traditional Chinese medicine as well as enzyme activity assay. Zhongguo Zhong Yao Za Zhi 40(18): 3524-3529. [Crossref]
- Mach CM, Fugii H, Wakame K, Smith J (2008) Evaluation of active hexose correlated compound hepatic metabolism and potential for drug interactions with chemotherapy agents. J Soc Integr Oncol 6: 105-109. [Crossref]
- Marzancola MG, Sedighi A, Li PC2 (2016) DNA Microarray-Based Diagnostics. Methods Mol Biol 1368: 161-178. [Crossref]
- Okuzaki D, Fukushima T, Tougan T, Ishii T, Kobayashi S, et al. (2010) Genopalâ„¢: a novel hollow fibre array for focused microarray analysis. DNA Res 17: 369-379. [Crossref]
- Niwa M, Nagai K, Oike H, Kobori M (2009) Evaluation of the skin irritation using a DNA microarray on a reconstructed human epidermal model. Biol Pharm Bull 32: 203-208. [Crossref]
- Motojima H, O Villareal M, Han J, Isoda H (2011) Microarray analysis of immediate-type allergy in KU812 cells in response to fulvic acid. Cytotechnology 63: 181-190. [Crossref]
- Shao-Liang Chen, Zhi-Mei Wang, Zuo-Ying Hu, Bing Li (2015) Genome-wide analysis of differentially expressed long noncoding RNAs induced by low shear stress in human umbilical vein endothelial cells. Integr Mol Med 2: 276-289.
- Yanagimoto H, Satoi S, Yamamoto T, Hirooka S, Yamaki S, et al. (2016) Alleviating Effect of Active Hexose Correlated Compound (AHCC) on Chemotherapy-Related Adverse Events in Patients with Unresectable Pancreatic Ductal Adenocarcinoma. Nutr Cancer 68(2): 234-240.
- Ito T, Urushima H, Sakaue M, Yukawa S, Honda H, et al. (2014) Reduction of adverse effects by a mushroom product, active hexose correlated compound (AHCC) in patients with advanced cancer during chemotherapy--the significance of the levels of HHV-6 DNA in saliva as a surrogate biomarker during chemotherapy. Nutr Cancer 66(3): 377-382.
- Vetvicka V, Vetvickova J1 (2014) Immune-enhancing effects of Maitake (Grifola frondosa) and Shiitake (Lentinula edodes) extracts. Ann Transl Med 2: 14. [Crossref]
- Roman BE, Beli E, Duriancik DM, Gardner EM (2013) Short-term supplementation with active hexose correlated compound improves the antibody response to influenza B vaccine. Nutr Res 33: 12-17. [Crossref]
- Tanaka Y, Ohashi S, Ohtsuki A, Kiyono T, Park EY, et al. (2014) Adenosine, a hepato-protective component in active hexose correlated compound: its identification and iNOS suppression mechanism. Nitric Oxide 40: 75-86.
- Ulbricht C, Brigham A, Bryan JK, Catapang M, Chowdary D, et al. (2013) An evidence-based systematic review of active hexose correlated compound (AHCC) by the Natural Standard Research Collaboration. J Diet Suppl 10(3): 264-308. [Crossref]
- Nair SS, Sarasamma S, Gracious N, George J, Anish TS, et al. (2015) Polymorphism of the CYP3A5 gene and its effect on tacrolimus blood level. Exp Clin Transplant 13 Suppl 1: 197-200. [Crossref]
- Hebanowska A1 (2011) [Mechanisms of bile acid biosynthesis regulation--autoregulation by bile acids]. Postepy Biochem 57: 314-323. [Crossref]
- Zhao H, Zhu M, Dou G, Zhao H, Zhu B, et al. (2014) BCL10 regulates RNF8/RNF168-mediated ubiquitination in the DNA damage response. Cell Cycle 13: 1777-1787. [Crossref]
- He P, Zeng B, Zhang XL, Fang DL, Zhou XQ2, et al. (2016) Protective effect of apoptosis signal-regulating kinase 1 inhibitor against mice liver injury. Asian Pac J Trop Med 9: 283-287. [Crossref]
- Lu EP, McLellan M2, Ding L3, Fulton R2, Mardis ER4, et al. (2014) Caspase-9 is required for normal hematopoietic development and protection from alkylator-induced DNA damage in mice. Blood 124: 3887-3895. [Crossref]
- Fan XJ, Zhao HD, Yu G, Zhong XL, Yao H, et al. (2015) Role of inflammatory responses in the pathogenesis of human cerebral aneurysm. Genet Mol Res 14: 9062-9070. [Crossref]
- Oestreich KJ, Read KA, Gilbertson SE, Hough KP, McDonald PW, et al. (2014) Bcl-6 directly represses the gene program of the glycolysis pathway. Nat Immunol 15: 957-964. [Crossref]
- Mallet JF, Graham É, Ritz BW, Homma K, Matar C (2016) Active Hexose Correlated Compound (AHCC) promotes an intestinal immune response in BALB/c mice and in primary intestinal epithelial cell culture involving toll-like receptors TLR-2 and TLR-4. Eur J Nutr 55(1): 139-146. [Crossref]