Abstract:
Objective:
To reintroduce a neglected mathematical method for the auditing of official data in development/emergency aid. These data are paramount for the accountability and effectiveness of relieve programmes.
Introduction:
Our example (paediatric malnutrition and cereal production) constitutes one of the most important development challenges. Nutritional services, famine intervention and the improved food supply for populations in resource poor countries need valid data. The data on food production do not only influence nutritional projects, but are significant for a wide variety of parameters in public health.
Method:
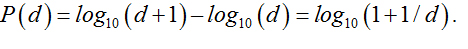
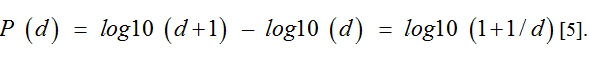
Newcomb discovered that many natural data sets follow a specific, counterintuitive distribution. He showed, that the frequency distribution of the first digit “d” (“d” element of {1,…9}) in many large datasets can be described through the logarithmic equation:
 Significance was tested by Chi-Square. We scrutinized data from FAOSTAT on the world´s cereal production.
FAO data supported our null-hypothesis (published data are correct). Chi square for the second digit supported narrowly H0. There was no reason to suspect irregularities, which might reach from psychological challenges during data collection to open fraud.
Conclusion:
Scrutiny via Newcombs law is easy and FAO´s numbers on the world´s cereal production showed no suggestion of systemic bias.
Keywords:
data audit, data management, international research, misconduct in research, forensic auditing, public health research, paediatric research ethics, research bias, research in developing countries
Introduction
Simon Newcomb described in his classical paper from 1881 for the American Journal of Mathematics “Note of the Frequency of Use of the Different Digits in Natural Numbers [1]” that this frequency shows that some numbers occur much more frequently than others; that these frequencies can be described through a logarithmic relation and that the probabilities of their occurrence are relevant in a high number of real life data sets [2]. For a long time this frequency distribution was more or less forgotten. Due to the strive of our tax-authorities to detect fraud and financial irregularities [3,4] it was rediscovered in order to support the tax-authorities investigations [5,6]. Nevertheless, despite its ability to give us an idea whether scientific data sets can be judged as honestly collected or should be suspected of fraud it has beenrarely used in medicine or relatedfields [7,8]. We are of the opinionthat Newcomb´s discovery holds great possibilities of unmasking questionable data collections and compilations in the social, agricultural and medical sciences. Even when the exact mathematics are beyond the scope of this paper, we would like to show (besides many examples given in physics and mathematics [9,10]) that the correctness of Simon Newcomb´s discovery is intuitively understandable.
A country with a harvest of 10,000 tons of rice needs at least to double (a growth rate of 100%) its production until the first number is replaced by a “2” (e.g. 20,000 or 23,000 tons).To reach 30,000 tons only a growth of 50% is needed and only 33% to reach at least 40,000 (up to 49999 tons (and so the “4” as first number).Newcomb law refers to the fact that in many data sets the small numbers are more prevalent than the larger ones. Another example would be the money that villagers gain from the cereals, they are harvesting on their land. After they have the first 10 $ on their account in the e.g. “Grameen Bank” they need to wait x years (depending on the interest rates until their money will double, so that a 2 (meaning e.g. 20 $) can be seen in the account. Assuming interest rates 100%, in the second year the first number will be a 3 for some time and will end a 4.In the third year. The first number will become a 5, 6 and 7 and end theyear an 8 for $ 80 inthe account. This means that in any given moment the probability to find the “1” is higher than the probability of the “2”, which is higher than the probability of the”3” and so on. The same is repeated for the hundreds or thousands.
The cereal production is probably the most important factor for the world´s nutrition. Rice, maize, and wheat alone comprise around 90% of the cereal production. The accuracy of the cereal production figures is of the utmost importance for the planning of food security, famine evaluation, the political importance of water restrictions, the nutrition of children in the developing countries and the possible calorie intake of large parts of the world´s poor population.
We applied Newcomb´s law arguably on the most authorative data available for cereal production in the world. We used the data for 2010-2013(newest available) from the statistical division of the Food and Agriculture Organization of the United Nations (FAO-STAT) [11]. Our aim was to evaluate whether our assumptions on the world´s cereal production are supported by a mathematical scrutiny of its published numbers or whether this scrutiny might reveal irregularities which need to be addressed for its further use in planning for the fight against hunger. Moreover the findings might well be important for Africa´s food security, famine and disaster prevention, public health, the ability of the e.g. African, countries to provide meals in their schools and our ideas about the reasons for under five or infant mortality rates.
Methods
Simon Newcomb [1] discovered that many natural sets of numbers follow a specific distribution. He could show, that the frequency distribution of the first digit “d” (e.g. 1 in the number 14267 – or generally of the number “d”); with d an element of {1,...,9} in natural and mathematical databases with more than 5 data per group, covering more than two orders of magnitude and without having artificial cut-off or endpoints are very likely to satisfy the first digit law [12-14].
They can be described through the following equation:
This lead to the recognition of the fact, that “1” as first number occurs much more often (30.1%) than the other numbers (“2”: 17.6%, “3”: 12.5%, “4”: 9.7%, “5”: 7.9%,“6”: 6.7%, “7”: 5.8%, “8”: 5.1% and “9”: 4.6% [5]. Similar calculations can be carried out for the second number [13]. For the second number (d E {0,…9}) the probabilities of their frequency are between 12% for the “0” and 8.5% the “9”.
Datasets not complying with the mathematical percentages of Newcombs discovery are likely to deviate systematically. The reason for this irregularity ranges from psychological challenges during data collection to open fraud. In any case these data have to be treated with great care.
Newcomb´s law was applied to the yearly data for 2010-2013(newest available) from the statistical division of the Food and Agriculture Organization of the United Nations (FAO-STAT) [11] on the world´s cereal production of all countries published through the United Nations FAO. This is arguably the most important single factor of the world´s nutritional status.
The significance of a deviation of the observed numbers in FAO´s reports from the expected values following Newcomb´s law were established through the Chi-Square test (alpha: 0.05, degrees of freedom: 8 for the first and 9 for the second digit) [15,16].
Our null hypothesis (H0) was that the observed numbers were correct (H1: There is a systemic bias, leading to the conclusion that they are not correct). In case the null hypothesis was not rejected (or narrowly not rejecte, we further scrutinized the data for the second digit.
Results
The available data in FAOSTAT were reviewed for the years 2010-2013 [11].
1. Data from 180 countries were scrutinized and the data concerning the world’s combined production of cereals (rice, maize, wheat etc.) were counted for the frequency of the occurrence of all numbers from 1 – 9 as the first number. The results for the observed and expected values can be seen in Table 1 and 2. The corresponding statistical parameters are summarized in Table 3. We compared the results graphically for the observed values together with the values expected after Newcomb´s law in (Figures 1 and 2).
|
Year of Report
|
No of countries
|
|
|
Observed values for the first digit
|
|
|
|
0
|
|
1
|
2
|
3
|
4
|
5
|
6
|
7
|
8
|
9
|
|
|
|
First digit:
|
|
|
|
|
|
|
|
2010
|
180
|
-
|
|
47
|
39
|
28
|
19
|
14
|
11
|
9
|
8
|
5
|
|
|
2011
|
180
|
-
|
|
49
|
37
|
22
|
23
|
8
|
12
|
10
|
9
|
10
|
|
|
2012
|
180
|
-
|
|
46
|
34
|
27
|
21
|
18
|
12
|
3
|
9
|
10
|
|
|
2013
|
180
|
-
|
|
45
|
36
|
19
|
29
|
12
|
13
|
6
|
10
|
10
|
|
|
|
|
|
|
|
|
|
|
|
|
|
|
|
|
|
Second digit:
|
|
|
|
|
|
|
|
2013
|
180
|
30
|
|
12
|
16
|
23
|
10
|
15
|
23
|
12
|
20
|
15
|
|
| |
|
|
|
|
|
|
|
|
|
|
|
|
|
|
|
|
|
|
|
|
|
|
|
|
Table 1. The observed values.
|
Year of report
|
No of countries
|
Expected values for the first / second digit
|
|
|
|
|
First digit:
|
|
1 2 3 4 5 6 7
|
|
8
|
9
|
|
|
2010
|
180
|
-
|
54.2
|
31.7
|
22.5
|
17.5
|
14.2
|
12
|
10.4
|
|
9.2
|
8.3
|
|
|
2011
|
180
|
-
|
54.2
|
31.2
|
22.5
|
17.5
|
14.2
|
12
|
10.4
|
|
9.2
|
8.3
|
|
|
2012
|
180
|
-
|
54.2
|
31.2
|
22.5
|
17.5
|
14.2
|
12
|
10.4
|
|
9.2
|
8.3
|
|
|
2013
|
180
|
-
|
54.2
|
31.2
|
22.5
|
17.5
|
14.2
|
12
|
10.4
|
|
9.2
|
8.3
|
|
|
|
|
|
|
|
|
|
|
|
|
|
|
|
|
|
Second digit:
|
|
0 1 2 3 4 5 6
|
|
7 8
|
9
|
|
|
2013
|
180
|
21.5
|
20.5
|
19.5
|
18.8
|
18.05
|
17.4
|
16.7
|
|
16.2
|
15.8 15.3
|
|
| |
|
|
|
|
|
|
|
|
|
|
|
|
|
|
|
|
|
|
Table 2. The expected values.
|
Year of report
|
No of countries
|
Statistical parameter
|
Ho
|
|
|
|
Alpha
|
df
|
X2
|
Cut off for X2
|
|
Result
|
|
First digit:
|
|
|
|
|
|
|
|
|
2010
|
180
|
0.05
|
8
|
5.5
|
15.51
|
|
Not rejected
|
|
2011
|
180
|
0.05
|
8
|
6.15
|
15.51
|
|
Not rejected
|
|
2012
|
180
|
0.05
|
8
|
9.32
|
15.51
|
|
Not rejected
|
|
2013
|
180
|
0.05
|
8
|
12.97
|
15.51
|
|
Not rejected
|
|
|
|
|
|
|
|
|
|
|
Second digit:
|
|
|
|
|
|
|
|
|
2013
|
180
|
0.05
|
9
|
16.78
|
16.92
|
|
Not rejected
|
|
|
|
|
|
|
|
|
|
Table 3. The statistical parameter.
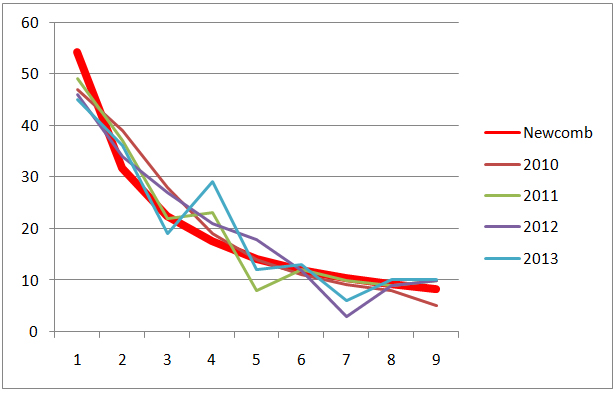
Figure 1. The frequency distribution of the first digit expected after Newcomb for 2010 – 2013 (red) and the observed frequencies for the first digit from the FAO reports 2010 – 2013.
2021 Copyright OAT. All rights reserv
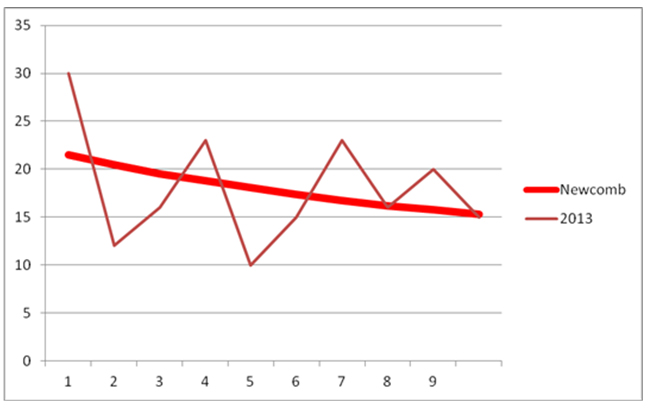
Figure 2. The frequency distribution of the second digit expected after Newcomb for 2013 (red) and the observed frequencies for the second digit from the FAO report 2013.
2. For the calculation of the significance of the statistical differences between observed and expected values we used Chi-square test.
For all years (2010-2013) Chi-square was lower than the cut-off value for the Chi-square distribution on a level of significance of 0.05 (alpha = 0.05) and the respective degrees of freedom [15,16].
We could not reject the null hypothesis.
3. For 2013, Newcomb’s law was also applied to the second digit. Chi-Square was lower than the cut-off (for alpha 0.05 and nine degrees of freedom) and we could not reject the null-hypothesis.
The acceptance of the null hypothesis suggests that the numbers observed in the publication are congruent with Newcomb´s law(Tables 1-3).
Discussion
In recent decades Newcomb´s law of the first number or digit has been used to scrutinize sets of data in order to decide whether the data sets are of natural or fraudulent origin [1]. In order to fit with Newcomb´s law, which was later given the name “Benford´s law” [2] the data sets need to be large enough, span several orders of magnitudes and need to lack any artificial restriction to their growth. They then follow the above distribution, so that nutritional, social, medical, economic or demographic datasets can be scrutinized.
Despite some suggestions [7,8] this rule was never really discovered for the social sciences or pediatric medicine. We suggest this law as a valuable tool to identify data sets in need of further scrutiny. It constitutes a method with which a non-statistician can obtain a reliable and quick overview over large data-sets.
Formerly, we discovered irregularities in the Unicef datasets [17,18] for children under five years of age [19]. This led to the idea to use Newcomb´s discovery to evaluate some of the most important data for the nutrition of the rich and poor countries.
Most people in the world rely on the cereals evaluated here for their daily survival. Moreover these data influence a variety of other important parameters. FAO publishes an annual overview on the most important nutritional data. These data are used by international organizations, program-managers and legislators worldwide. Many count on the accuracy and reliability of these data.
The distribution of Newcomb´s law states, that a deviation from it is not of natural origin. It does not offer an explanation why the data deviate; but it does indicate that the data have to be evaluated in depth.
In the event of data irregularities, it should be considered whether the deviation is due to psychological or innocent challenges like difficult data collection (e.g. in some geographical areas) or if there are serious operational systematic challenges or if there has been fraud, corruption or nepotism
It was the purpose of this article to show that even data from respected and well established sources, which have been put together with care, expertise and experience – often have to be seen critically.
The digital analysis through the Newcomb distribution has shown that the FAOSTAT data are good enough not to be mistrusted. For 2013, which came nearest to the statistical values which would have led to the rejection of the null hypothesis (and the idea that we can trust the data), we also checked the second digit using Newcomb’s method.“ Here the result was that the data were acceptable, but it was extremely near to the rejection of the null hypothesis. Should that happen more frequently, we would suggest an in-depth analysis through more sophisticated mathematical tests like the tests of Komolgorov-Smirnov and Kuipers [20] which are outside the scope of our paper and lack accessibility for the non-statastician, which is the beauty of the Newcomb method.
Most probably this is related to some limitations of FAOSTATS data - which constitutes the limitations of our study. FAO uses data from “countries” which are not countries. This is most prominent for the French overseas territories like Reunion or New Caledonia. Conversely some countries are not mentioned like Morocco or Equatorial Guinee (and the Seychelles, the Holy See, Andorra…). We could not see why they use around 15 “countries” less than organisations, such as Unicef, for their worldwide comparisons. Additionally, FAO counts West-Sahara and the Occupied Palestinian Territories as countries. FAO still counts Sudan as a country and not Sudan and South Sudan. FAO obviously has a challenge with China, where they give data for “China”, “mainland China”, “Taiwan” and mention Hong Kong (but not Macao) – without data”.
We assert that these data have to be scrutinized regularly. Nevertheless, for the future planning in all challenges related to the fight against hunger we found a valuable and reassuring result, especially considering how many data come from countries not known for their rigorous collection of data.
The scrutiny of FAO numbers on the world´s cereal production showed that we can accept the validity of these fundamental data. Due to structural challenges we still should be aware that these data have to be scrutinized regularly for all future planning related to the fight against pediatric hunger and in all projects involved in nutritional services, disaster relief and pediatric public health.
Author statements
The study was not funded by any organization. The authors declare not to have competing interests.
Acknowledgements
Dr. Andy Hall for his help with the English language.
References
- Newcomb S (1881) Note of the Frequency of Use of the Different Digits in Natural Numbers. American Journal of Mathematics 4: 39-40.
- Benford F (1938) The Law of Anomalous Numbers. Proceedings of the American Philosophical Society 78: 551-572.
- Rauch B, Göttsche M, Brähler G, Engel S (2011) "Fact and Fiction in EU-Governmental Economic Data". German Economic Review 12: 243–255.
- Müller Hans Christian (2011) Greece Was Lying About Its Budget Numbers. Forbes.
- Durtschi C, Hillison W, Pacini C (2004) The Effective Use of Benfords Law to Assist in Detecting Fraud in Accounting Data. Journal of Forensic Accounting 5: 17-34.
- Nigrini MJ (1996) Taxpayers Compliance Application of Benford’s Law. Journal of the American Taxation Association 18: 72-92.
- Varian HR (1972) Benford’s Law. The American Statistician 26: 65-66.
- Cáceres JLH, García JLP, Martínez Ortiz CM, Domínguez LG (2008) First Digit Distribution in Some Biological Data Sets. Possible Explanations for Departures from Benford’s Law. Electronic Journal of Biomedicine 1: 27-35.
- Washington JC (1981) "Benford's Law for Fibonacci and Lucas Numbers" The Fibonacci Quarterly, 19.2 175–177.
- Wikipedia; Wikipedia commons, the free media repository; Benford´s law – physical constants“: last access: 11.2.2014.
- Data collection of the statistical division of the “Food and Agriculture Organization” (FAO) of the United Nations (FAO-STAT).
- Janvresse, E, de la Rue T (2004) From Uniform Distribution to Benford’s Law. Journal of Applied Probability 41: 1203-1210.
- Fewster RM (2009) A Simple Explanation of Benford’s Law. The American Statistician 63: 26-32.
- Suh IS, Headrick, TC, Minaburo S (2011) An Effective and Efficient Analytic Technique: A Bootstrap Regression Procedure and Benford’s Law. Journal of Forensic and Investigative Accounting 3: 3.
- Hennekens CH, Buring JE (1987) Epidemiology in Medicine, Little, Brown and Company, Boston/Toronto.
- Dawn G (2012) Statistics. Churchill Livingston.
- Unicef: The State of The World’s Children (2012). Unicef Reports.
- Pollach G (2014) The world´s under five population – do we really have good data for its size in medicine? International Journal of Clinical Medicine 5: 599-604.
- Hill TP (1995) The Significant-Digit Phenomenon. The American Mathematical Monthly 102: 322-327.
- Stephens MA (1970) Use of the Kolmogorov-Smirnov, Cramér-Von Mises and Related Statistics without Extensive Tables. Journal of the Royal Statistical Society, Series B 32: 115-122.