This study is aimed to determine the effect of broccoli intake on the antioxidant enzymes of the liver and kidney in experimental rats infected with diabetes. The broccoli was obtained from the Saudi local market and the different chemical analyses were conducted. After the process of steam boiling for 4-5 minutes, it was dried at 50°C degrees then added to the meal. The research sample included groups of experimental healthy male rats numbering (50) and the weight of the rat ranging from 200-210 grams; divided into five equal groups, each group of 10 rats. The first group was fed a standard meal. While the 40 rats were injected with Streptozotocin substance dose of 60 mg/kg of body weight, and after confirmation of diabetes were then divided into 4 groups: the second to be the positive group and dealt with the standard meal; and the third, fourth and fifth groups were fed a standard meals that contained 10, 20 and 30% of dried broccoli, respectively, for two months. The results showed improvement in all biochemical parameters in serum and antioxidants of the liver and kidneys after broccoli feedings.
broccoli, antioxidant, diabetes, liver, kidney
Diabetes is considered as a chronic disease that often manifests in patient during his lifetime. The acute symptoms such as coma results in the increase or decrease of sugar in the blood, or the symptoms of chronic diseases such as cardiovascular, or damage to the retina and loss of vision, or kidney disease [1].
It was mentioned by Sharafetdinov et al. [2] that broccoli is rich in chromium content, which works with insulin to maintain blood sugar and less concentration of cholesterol and triglycerides in the blood vessels. Broccoli helps to resist diabetes due to high content of fiber. Whereby intake of high amounts of fiber helps regulate blood glucose level and help in the treatment of diabetes [3].
The objective of this study is to identify the chemical composition of broccoli, and to determine the effect of adding percentage of broccoli to the meal on biochemical measurements of blood serum and antioxidants in the liver and kidneys of diabetic rats.
Materials
Sample of broccoli found in the Saudi market. A group of healthy Swiss Albino rats numbering (50), weighted ranges from 200-210 grams. Broccoli washed several times and then chopped into small singular pieces and placed in the oven dryer at a temperature of 50°C . Then the nutrient elements of the broccoli were estimated according to the method of A.O.A.C [4].
All stages of the experiment to the ethics of scientific research on animals according to the guide for caring of animals in experiments [5].
Experimental design
All the rat were fed a standard meal and then divided into five groups, each group of (10) rat, the first group of (10) rat was fed on a standard meal (negative control). While 40 rat were injected Streptozotocin substance at a dose of 60 mg/kg of body weight to cause diabetics [6]. After confirming diabetics it was divided into 4 groups, each group of 10 rats, the second group to be the positive control group and fed the standard meal, and the third, fourth and fifth groups fed with standard meals containing 10, 20, 30% dried broccoli, respectively. The provision of food was Ad Libitum.
Blood samples were drawn from all groups after the first week, the third, fifth, seventh, and eighth to estimate the level of glucose. The blood samples were withdrawn from the vessels of the eye [7]. At the end of the period of treatment the animals were slaughtered after fasting 12 hours, taking the blood of the rats to estimate the level of hemoglobin and glycated hemoglobin, insulin and enzymes alkaline phosphatase, alanine amino, and aspartate amino transferase using a chemical device [8,9]. The levels of Malondialdehyde compounds were estimated and through the use of Thiobarbutyric acid (TBA) calculating methods [10]. The activity of Glutathione-S-transferase, catalase enzyme, Superoxide dismutase, Gluthatione Peroxidase (GPX) were estimated by methods of Habig et al. [11], Cohen et al. [12], Beuchamp and Fridovich [13], Barjade et al. [14], respectively. Data were analyzed using the general linear model of the program SAS [15].
Chemical composition of broccoli
Table 1 indicates the chemical composition of broccoli. Manchali et al. [16] study has mentioned that every 100 grams of fresh broccoli contains 2.82, 0.37, 6.64 grams protein, fats, and carbohydrates, respectively. And it contains phosphorus, potassium, magnesium, calcium increased by 66, 317, 21, 47 mg/100 g of fresh broccoli. And the percentage of iron, selenium, manganese, zinc to 0.77, 0.003, 0.22, 0.44 mg/100 g in fresh broccoli, respectively. While the percentage of fiber to 30% on a dry weight basis.
Table 1: The chemical composition of Broccoli
Food component
on wet basis |
% |
Food component
on dry basis |
% |
| Moisture |
86.51 |
Moisture |
0.0 |
| Protein |
4.35 |
Protein |
32.22 |
| Total carbohydrates |
5.46 |
Total carbohydrates |
40.51 |
| Fiber |
1.82 |
Fiber |
13.48 |
| Mineral elements |
1.44 |
Mineral elements |
10.6 |
| Fat |
0.42 |
Fat |
3.12 |
Mineral contents |
Vitamin and antioxidants content |
Elements |
mg/100 gm |
Elements |
mg/100 gm fresh broccoli |
| Potassium |
525 |
Vitamin C |
90.0 |
| Calcium |
175 |
Total carotene |
10.37 |
| Phosphorous |
162.5 |
Vitamin E |
1.4 |
| Iron |
3.95 |
Total phenols |
86.84 |
| Selenium |
3.0 |
Total Polyphenols |
20 |
| Manganese |
1.53 |
Chlorophyll A |
46.46 |
| Zinc |
0.45 |
Chlorophyll B |
19.64 |
Level of glucose, insulin, hemoglobin and glycated hemoglobin
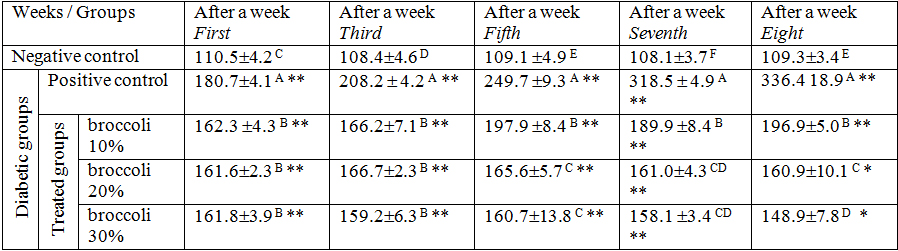
The results in Table 2 indicated the occurrence of high level of glucose in the blood serum of all diabetic rat compared to the negative control group at the end of the first and third week meal of fortified powdered broccoli. At the end of the fifth and seventh week the level of glucose in the blood serum continued to rise in the positive control group and the group that rat fed with 10% powdered broccoli, while little change occurred in the level of glucose in the groups that dealt with broccoli powder by 20%, 30%. At the end of the eighth week an improvement in the level of glucose in the group which dealt with broccoli powder by 30%.
Table 2: The mean and standard deviation of blood glucose (mg 100 ml) in the control groups of rat and treatment during the period of the experiment
*Level of significance less than 0.05 **Significant at less than 0.01
A, B, C, D, E, F represents the moral differences between the mean within the standard at the level of 0.05
|
Decrease was significant in the level of insulin of blood serum in the positive control group, and in all experimental diabetic groups (Table 3).
Table 3: The level of insulin in the blood serum, hemoglobin, and glycated hemoglobin in the blood
* Level of significance less than 0.05 ** Significant at less than 0.01
A, B, C, D, E represents the moral differences between the mean within the standard at the level of 0.05.
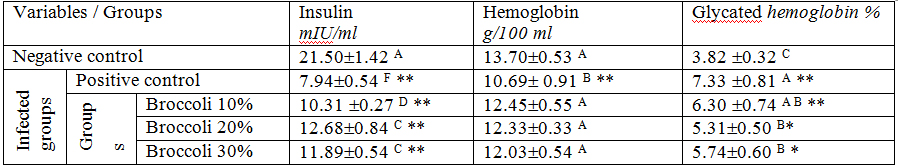
Table 3 indicates the absence of any significant differences between the level of hemoglobin in the blood of the negative control group and diabetic groups, which had been treated with powdered broccoli. However, the level of hemoglobin was significantly decreased in the positive control group.
This study is in agreement with the study of Al-Malah [17] in which it noted a decrease in blood glucose level in rat infected with diabetes, which dealt with meals supplemented with powdered broccoli by 5, 10, 20% where the glucose level decreased by percentages of 13.86, 30.25, 35.56%, respectively, compared to the positive control group (infected with diabetes without treatment).
A significant increase occurred in the concentration of the enzyme alkaline phosphatase in the blood serum in each of the positive control group and the groups that dealt with broccoli powder by 10, 20, 30% of the meal (Table 4). Increased concentration of aspartate amino transferase enzyme (AST) significantly (Table 4) in the blood serum as a result of infection in diabetic rat positive control group and the groups that dealt with broccoli powder concentration of 10, 20, 30% compared to the negative control group.
Table 4: The level of alkaline enzyme Phosphatase, aspartate amino transferase (AST) and alanine amino transferase (ALT) in the blood serum
* Level of significance less than 0.05 ** Significant at less than 0.01
A, B, C, D represents the significant differences between the mean and standard deviation at the level of 0.05
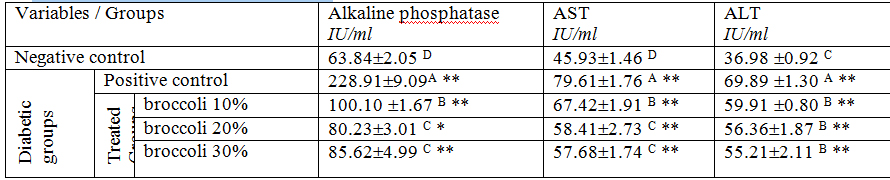
Similar results in the concentration of the enzyme alanine amino transferase (ALT) with enzyme the aspartate amino transferase, where the concentration of the enzyme alanine amino transferase significantly increased in the blood serum as a result of infection of rat with diabetes in the positive control group and groups that dealt with powdered broccoli concentration of 10, 20, 30% compared to the negative control group (Table 4).
This study agreed with the results of the study of Guerrero-Beltran et al. [18] in which indicated that a Solforavan compound extracted from broccoli and cabbage led to a reduction in the concentration of the enzymes aspartate amino transferase, and alanine amino transferase and also the level of bilirubin in the blood serum of rat infected with hepatitis, compared with rat that did not dealt with Solforavan. The study concluded that solforavan is an antioxidant agent that may be effective to relieve oxidative stress and damage that occurs in the cells of the body.
The antioxidant enzymes in the liver tissue
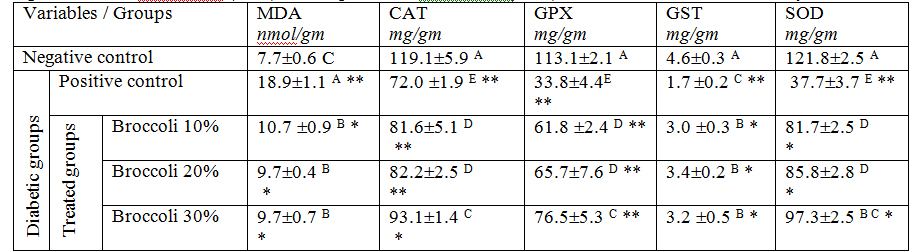
The results in Table 5 showed a significant increase in the concentration of malondialdehyde (MDA) in the liver tissue of the positive control group compared to negative control group. There was a significant decrease in the concentration of enzyme glutathione S-transferase (GST) in the positive control group and turn out to be 0.7 ± 0.2 microseconds/mg liver (Table 5).
Table 5: Level of malondialdehyde (MDA), the enzyme catalase (CAT), and glutathione peroxidase (GPX), and glutathione S-transferase (GST), and super oxide dismutase (SOD) in the wet liver tissue
* Level of significance less than 0.05 ** Significant at less than 0.01
A, B, C, D, E represents the significant differences between the mean and standard deviations at the level of 0.05.
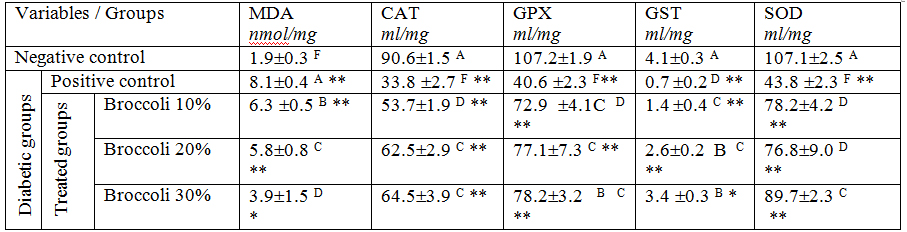
Decreased concentration of the enzyme catalase (CAT) in the liver tissue was significant in the positive control group and all the diabetic groups, which had been treated with broccoli compared to the negative control group. But progressive improvement was observed in the concentration of the enzyme catalase by increasing the amount of broccoli powder intake but it did not reach the level for the negative control group (Table 5).
Also, a decrease in the concentration of enzyme glutathione peroxidase (GPX) significantly in the liver tissue of the positive control group and all diabetic groups and which was treated with broccoli compared to the negative control group (Table 5). Similar results in the concentration of the enzyme super oxide dismutase (SOD) with the results of enzyme glutathione S-transferase (GST), where the results showed in Table 5 was a decrease in the concentration of the enzyme super oxide dismutase in the positive control group to 43.8 ± 2.3 mg/g liver tissue.
Antioxidant enzymes in the kidney tissue
The results in Table 6 showed a significant increase in the concentration of malondialdehyde (MDA) in kidney tissues of all the positive control group and the group that dealt with broccoli powder by 10% compared to the negative control group. However, significant differences were not observed among the negative control group and the groups which had been treated with broccoli powder by 20, 30%. Almost similar in concentration of glutathione S-transferase enzyme (GST) in all diabetic groups which had been treated with broccoli powder by 10, 20, and 30% (Table 6). This concentration was decreased significantly compared to the negative control group (4.6 ± 0.3 micro/ mg kidney tissues.
Table 6: Level of malondialdehyde (MDA), the enzyme catalase (CAT), and glutathione peroxidase (GPX), and glutathione S-transferase (GST), and super oxide dismutase (SOD) in the wet tissues of the kidneys
*Level of significance less than 0.05 **Significant at less than 0.01
A, B, C, D, E represents the significant differences between the mean and standard deviation at the level of 0.05.
Decreased concentration of the enzyme catalase (CAT) in the tissues of the kidneys was significant in the positive control group and all the diabetic groups, which had been treated with broccoli compared to negative control group. But it noted an improvement in the concentration of the enzyme catalase in the group which dealt with 30% broccoli powder compared to the control diet (Table 6). Decreased in the concentration of enzyme glutathione peroxidase (GPX) in the tissues of the kidneys was significant in the positive control group and all the diabetic groups, which had been treated with broccoli compared to negative control group (Table 6), and although there were significant differences between the negative control group and experimental groups but it is noted that the increase in the proportion of broccoli powder in the diet led to improvement in the concentration of enzyme glutathione peroxidase.
Results were similar in the concentration of the enzyme super oxide dismutase (SOD) in the kidneys with the results of enzyme glutathione peroxidase (GPX). The efficiency of the liver and kidneys improved in groups dealt with powdered broccoli may be due to the content of broccoli high in phenols and polyphenols compounds that have an active role in reducing the effect of free radicals, which are produced in patients with chronic diseases, especially diabetes.
This may be because the high concentration of antioxidant enzymes in the liver and kidneys of the diabetic groups which dealt with broccoli powder and extract for the body to try to take advantage as much as possible of antioxidants available in the meal and to compensate the body of the necessary antioxidants to neutralize free radicals and oxidative stress.
The results agreed with Bahadoran, et al. [19] who mentioned the occurrence of a significant decrease in the level of malondialdehyde, low-density lipoproteins, and the index of oxidative stress, whereas an increase in the total antioxidant capacity in the serum blood of patients with diabetes who ate 5 gm dried broccoli, 10 gm daily for 4 weeks (number 29, 27, respectively), and that by patients who did not eat broccoli (number = 25). And an increased level of malondialdehyde was noted in the kidneys for increasing fat oxidation. Broccoli contains the pigment anthocyanin, a strong worker to counter free electrolytes and acts as an antioxidant. And it gives protection against harmful physical changes such as fat oxidation and rapid breaking of cellular membrane. Broccoli contains vitamin A, C, making it a protective role against oxidative damage [20]. The study recommends expanding the cultivation of broccoli to be supplied in the market at reasonable prices, because of its good effects on public health and also encourage diabetics to eat broccoli because it lowers the level of glucose in the blood.
2021 Copyright OAT. All rights reserv
- Al Madani, Khalid Ali (2009) Diet therapy for diabetes. Dar Al Madani, Jeddah. Saudi Arabia.
- Sharafetdinov KhKh, Meshcheriakova VA, Plotnikova OA, Mazo VK, GmoshinskiÄ IV, et al. (2004) [Effect of food diet supplements with chromium on the clinical and metabolic parameters in type 2 diabetic patients]. Vopr Pitan 73: 17-20. [Crossref]
- Nosaka N, Kasai M, Nakamura M, Takahashi I, Itakura M, et al. (2002) Effects of dietary medium-chain triacylglycerols on serum lipoproteins and biochemical parameters in healthy men. Biosci Biotechnol Biochem 66: 1713-1718. [Crossref]
- A.O.A.C. (2000) Official Methods of Analysis. seventh ed., Gaithersburg.
- Bashandi, Abdul Wahab Mohammed (2003) Guide for care of experimental with animals and their uses in medical research. Publishers of scientific books for publication and distribution. Cairo, Arab Republic of Egypt
- Kataya HA, Hamza AA (2008) Red Cabbage (Brassica oleracea) Ameliorates Diabetic Nephropathy in Rats. Evid Based Complement Alternat Med 5: 281-287. [Crossref]
- Waynforth B (1980) Experimental and Surgical technique in the rat, Academic Press. A Subsidiary of Harcourt Brace Jovanovich, publishers. London.
- Tietz N (1986) Textbook of Clinical Chemistry, W; Saunders Co. Philadelphia, P.A. (1986):(techniques and procedures to minimize laboratory infections), (Specimen collection and storage recommendations).
- Tietz NW (1994) Textbook of Clinical Chemistry, W.; Saunders Co., Philadelphia, P.A (Techniques and procedures to minimize laboratory infections), (Specimen collection and storage recommendations).
- Placer ZA, Cushman LL, Johnson BC (1966) Estimation of product of lipid peroxidation (malonyl dialdehyde) in biochemical systems. Anal Biochem 16: 359-364. [Crossref]
- Habig WH, Pabst MJ, Jakoby WB (1974) Glutathione S-transferases. The first enzymatic step in mercapturic acid formation. J Biol Chem 249: 7130-7139. [Crossref]
- Cohen G, Dembiec D, Marcus J (1970) Measurement of catalase activity in tissue extracts. Anal Biochem 34: 30-38. [Crossref]
- Beauchamp C, Fridovich I (1971) Superoxide dismutase: improved assays and an assay applicable to acrylamide gels. Anal Biochem 44: 276-287. [Crossref]
- Barjade Quiroga G, Gil P, Lopeztorres M (1988) Physiologic significance of catalase and glutathione peroxidase in vivo peroxidation in selected tissues of the toad Discoglossuspietus (amphibian)during actimation to normobarichyperoxics. J comp Physiol B 158: 583-590.
- SAS "Statistical Analysis System" (2000): SAS user guide: Statistics Version 8 edition, Inc., Carry, NC.
- Manchali S, Murthy K, Patil B (2012) Crucial facts about health benefits of popular cruciferous vegetables. J Func Foods 4: 94-106.
- Al-Malah M (2007) Study the effect of broccoli on both hypercholesterolemic and hyperglycemic rats. Ph.D. degree. Faculty of Home Economics. Helwan University. Cairo.
- Guerrero-Beltran C, Calderon-Oliver M, Pedraza-Chavem J, Chirino Y (2012) Protective effect of sulforaphane against oxidative stress: Recent advances. Exp Toxicol Pathol 64: 503-508.
- Bahadoran Z, Mirmiran P, Hosseinpanah F, Hedayati M, Hosseinpour-Niazi S, et al. (2011) Broccoli sprouts reduce oxidative stress in type 2 diabetes: a randomized double-blind clinical trial. Eur J Clin Nutr 65: 972-977. [Crossref]
- Rodríguez-Cantú LN, Gutiérrez-Uribe JA, Arriola-Vucovich J, Díaz-De La Garza RI, Fahey JW, et al. (2011) Broccoli (Brassica oleracea var. italica) sprouts and extracts rich in glucosinolates and isothiocyanates affect cholesterol metabolism and genes involved in lipid homeostasis in hamsters. J Agric Food Chem 59: 1095-1103. [Crossref]