Abstract
Aplastic anemia (AA) is a potentially life threatening bone marrow disorder. The exact mechanisms responsible for AA pathogenesis are unclear and the disease is very difficult to study due to its rarity, heterogeneity in its pathology and limitations in number of cells available for examination. Our aim was to identify serum proteins differentially expressed in untreated AA patients compared to ATG treated patients and healthy controls that might be useful in understanding and monitoring AA. Serum was profiled on CM10 and Q10 ProteinChip arrays using SELDI-TOF/MS, detecting a number of differentially expressed protein peaks. A combined strategy of chromatographic fractionation, 1D gel electrophoresis, passive elution, trypsin digestion and LC-MS/MS analysis, formally identified two discriminatory peaks, further validated with immunodepletion, Western blot and ELISA. They include anti-inflammatory apolipoprotein A1 (APOA1), downregulated in AA compered to controls, and apolipoprotein C3 (APOC3), downregulated in AA compared to both control and ATG treated patients, and represent novel disease- and therapy- associated AA biomarkers. Inflammatory biomarkers in AA serum support immune-mediated pathology of AA and suppressive action of ATG. Results presented here are the first to describe disease- and therapy-associated proteome changes in these patients. The two identified proteins are, to the best of our knowledge, the first reported serum biomarkers of AA. These biomarkers can potentially be used for disease detection, diagnosis and monitoring and can help in understanding the mechanism of AA. Further studies with additional samples are needed to confirm their importance in the pathogenesis of the disease and their clinical value.
Key words
aplastic anemia, biomarkers, Apolipoprotein A1, Apolipoprotein C3, SELDI-TOF
Abbrevitions
AA: Aplastic anemia; APOA1: Apolipoprotein A1; APOC3: Apolipoprotein C3; APP: Acute phase protein; ATP: Antithymocyte globulin; BM: Bone marrow; IL: interleukin; TNF: Tumor necrosis factor
Background
Aplastic Anemia (AA) is a serious bone marrow disorder that results from suppression of bone marrow (BM) activity and a marked reduction in blood cell production. It causes potentially life-threatening bleeding, infection and anaemia. The exact factors responsible for BM cell destruction and blood pancytopenia are unclear; possible causes include a quantitative/qualitative defect in haemopoietic stem cells, an immune mediated inhibition of haemopoiesis, a defective BM microenvironment or a combination of these. In addition to regular blood and platelet transfusions, specific treatment of aplastic anaemia involves bone marrow transplantation and intensive immunosuppressive therapy with antithymocyte globulin (ATG) and cyclosporin. There is good evidence that AA is immune mediated in some patients but not all patients respond to ATG and the reason for lack of response in most patients is unknown.
AA is very difficult to study, as by the time a patient presents with the disease, the BM has already been damaged showing hypocellularity and pancytopenia leaving little material for investigation. Difficulties in diagnosing AA also occur due to the rarity of the disease and the heterogeneity in its pathology. In addition to blood cell counts, diagnosis is made based on BM aspirate and trephine biopsy and often a final diagnosis is based on exclusion of other conditions rather than a definitive diagnosis of AA itself. Finding alternative markers for differentiating between AA patient samples and samples from healthy individuals or patients of other BM disorders may enable quicker and more efficient diagnosis and therapy monitoring.
In recent years a technology known as SELDI-TOF/MS has been demonstrated as a powerful method in clinical studies for biomarker discovery. The present study was designed to determine whether SELDI-TOF/MS could be used as a tool for proteomic profiling and discovery of novel biomarkers of AA that are reflective of active disease. We hypothesized that there are specific differences in proteins in the blood between AA patients and normal individuals and that comparison of serum protein expression from AA patients, patients treated with ATG and those from healthy individuals could lead to the discovery of candidate biomarkers for AA.
To identify and further characterize proteins that may contribute to AA, serum samples from AA patients and healthy subjects were investigated through the application of the SELDI-TOF/MS platform in a combination with protein fractionation and purification steps, gel electrophoresis and LC-MSMS. Discovered biomarkers were further verified by immunodepletion and Western blotting and their concentration is serum measured by ELISA assay. The protein identities of the discovered biomarkers were determined to allow for additional validation and help in understanding the mechanism in which they may contribute to the BM damage in AA.
Materials and methods
Study subjects
Serum samples were obtained in accordance with the South-West London Local Research Ethics Committee. All patent and control serum samples were collected, processed and stored in the same manner. Venous blood was collected into BD Vacutainer tubes with no anticoagulant (BD Biosciences). The tubes were kept at room temperature until blood clothed and the serum was then aliquoted and frozen at -80°C for further analysis. Three subject groups were analysed: 32 patients with newly diagnosed acquired AA prior to treatment with immune suppressive therapy (diagnosis and assessment of disease severity was determined using standard criteria), 6 AA patients after treatment with ATG (unpaired samples) and 22 normal control samples from healthy donors. Patients and controls demographic characteristics are shown in Table 1.
Table 1. Basic patients and controls demographics.
Patient
number |
Sex |
Age |
Pre/Post ATG |
Volunteer number |
Sex |
Age |
AAPR2 |
m |
58 |
pre |
NPR3 |
m |
50 |
AAPR3 |
m |
/ |
pre |
NPR4 |
f |
24 |
AAPR4 |
m |
46 |
pre |
NPR5 |
f |
30 |
AAPR5 |
f |
42 |
pre |
NPR7 |
f |
59 |
AAPR6 |
f |
37 |
pre |
NPR11 |
f |
21 |
AAPR10 |
f |
58 |
pre |
NPR12 |
m |
19 |
AAPR11 |
f |
79 |
pre |
NPR13 |
m |
/ |
AAPR12 |
f |
56 |
pre |
NPR14 |
m |
/ |
AAPR14 |
f |
50 |
pre |
NPR16 |
f |
46 |
AAPR15 |
f |
73 |
pre |
NPR30 |
m |
34 |
AAPR16 |
m |
60 |
pre |
NPR15 |
f |
30 |
AAPR17 |
f |
/ |
pre |
NPR17 |
f |
26 |
AAPR20 |
f |
19 |
pre |
NPR18 |
m |
40 |
AAPR21 |
f |
61 |
pre |
NPR21 |
f |
19 |
AAPR22 |
m |
56 |
pre |
NPR23 |
f |
20 |
AAPR23 |
f |
21 |
pre |
NPR24 |
f |
38 |
AAPR24 |
m |
77 |
pre |
NPR25 |
f |
29 |
AAPR26 |
f |
21 |
pre |
NPR26 |
f |
30 |
AAPR27 |
f |
55 |
pre |
NPR27 |
f |
50 |
AAPR28 |
f |
27 |
pre |
NPR28 |
m |
26 |
AAPR29 |
m |
41 |
pre |
NTR25 |
f |
50 |
AAPR30 |
m |
70 |
pre |
NTR26 |
f |
36 |
AAPR31 |
m |
41 |
pre |
|
|
|
AAPR32 |
m |
78 |
pre |
|
|
|
AAPR33 |
m |
38 |
pre |
|
|
|
AAPR34 |
f |
63 |
pre |
|
|
|
AAPR35 |
f |
53 |
pre |
|
|
|
AAPR36 |
m |
25 |
pre |
|
|
|
AAPR37 |
f |
74 |
pre |
|
|
|
AAPR38 |
f |
20 |
pre |
|
|
|
AAPR39 |
m |
34 |
pre |
|
|
|
AAPR40 |
f |
55 |
pre |
|
|
|
AAPR65 |
f |
27 |
post |
|
|
|
AAPR66 |
m |
34 |
post |
|
|
|
AAPR67 |
f |
32 |
post |
|
|
|
AAPR68 |
f |
20 |
post |
|
|
|
AAPR70 |
m |
49 |
post |
|
|
|
AAPR71 |
f |
32 |
post |
|
|
|
ProteinChip arrays
Serum protein patterns were determined using CM10 and Q10 ProteinChip arrays and SELDI-TOF/MS. Serum sample were diluted 1/10 in urea buffer (9.5M urea, 2% CHAPS and 1% DTT) and further diluted 1/10 in binding buffer with 0.1% Triton X-100 and applied to protein arrays. Two binding buffers were used: 50 mM Ammonium acetate buffer pH5.5 and 50mM Sodium phosphate buffer pH6.0. All samples were run on both CM10 and Q10 ProteinChip Arrays with both binding buffers. 3 μl of each sample was loaded onto an array and incubated for 1 hour and 0.8μl of energy absorbing matrix containing sinapinic acid (SPA) (in 50% ACN and 0.5% TFA) applied on each spot.
SELDI-TOF/MS analysis
Arrays were analysed on a Ultraflex MALDI-TOF mass spectrometer (Bruker Daltonics) and data acquired using automated data collection protocol with the FlexControl software (Bruker Daltonics). Spectra were collected after averaging 2000 laser shots collected on each array spot at laser intensity of 40-45, detector sensitivity of 8, peak evaluation values of S/N of 5, resolution >50 and no smoothing or base-line substraction. All spectra were compiled and peaks with m/z between 3500 and 75000 were autodetected (smaller masses were determined to be artefacts of energy absorbing molecules and were not considered as peaks).
Data analysis and statistics: For detection of peaks, data were imported into Lucid Proteomics Software (Bio-rad) and generated spectra grouped into four individual conditions based on the array type and binding buffer used (CM10 pH5.5, CM10 pH6.0, Q10 pH5.5 and Q10 pH6.0). Pre-processing steps including baseline correction, signal/noise ratio and normalization were performed on all collected spectra. Peaks with similar masses across all the spectra were grouped into clusters under the following conditions: first pass-S/N of 5 or higher, valley depth of 5 and appearance in at least 20% of spectra being compared; second pass-S/N of 2, valley depth of 2 and cluster mass window of 1. Peaks detected within 0.2% m/z units of each other across the spectra were considered as one cluster.
The non-parametric Mann-Whitney tests were performed to compare the mean intensities of peak clusters in sera of AA patients, ATG treated patients and normal individuals. A p value of less than 0.05 was presented as statistically significant. The quality of all significant peaks was assessed by visual inspection.
Protein purification and fractionation
Serum samples were diluted 1/4 in urea buffer and further diluted 1/10 in binding buffer. 2 mg of protein extracts were loaded on ProteinChip CM or Q Ceramic HyperD® F Spin Columns (Bio-rad). Bound proteins were eluted over a discontinuous pH gradient of binding buffer (pH 6.0 - pH 3.5). The eluted fractions were concentrated and buffer exchanged with binding buffer in Ultrafree 3 kDa cut-off spin columns (Millipore). Protein concentration of each fraction was assessed by the Bradford assay and individual fraction concentrations normalised by dilution in matching binding buffers. 3μl of each eluate was applied on CM10 or Q10 arrays and analysed as described above to confirm the presence of protein peaks in the flow through fraction. Remaining eluate of each fraction was applied onto a polyacrylamide gel.
Gel electrophoresis
Fractions of interest were separated by 1D SDS-PAGE gel electrophoresis using 4-12% acrylamide Bis-Tris precast gels (NuPAGE, Invitrogen). Protein fractions were diluted in NuPAGE sample buffer and 10 μl/well loaded on the gel. SeeBlue® Plus2 Following electrophoresis, gels were stained with Simply Blue Safe Stain (Invitrogen). Protein bands of molecular weight approximating to that of candidate biomarkers were extracted and digested with trypsin for MS analysis or used in the passive elution experiment for molecular weight determination.
Passive gel elution
Extracted bands were sliced in half and one half washed with100 mM Ammonium bicarbonate followed by dehydration in 50 mM Ammonium bicarbonate in 50% ACN. Gel slices were incubated in 20 μl of FAPH solvent (50% formic acid, 25% ACN, 15% isopropanol and 10% dH2O) and extracted proteins concentrated by SpeedVac centrifugation. 2µl of eluant was applied on a Normal Phase (NP20) protein array (Bio-rad) followed by 0.8 µl of SPA solution. Arrays were analysed using the same SELDI-TOF/MS settings as in biomarker discovery experiments.
LC-MS/MS
Protein digestion: Remaining halves of gel bands were subjected to in-gel trypsin digestion using a robotic system (Projester, Genomic Solutions). In brief, gel bands were washed and shrunk using 100 mM Ammonium bicarbonate and 50% ACN and then reduced with 10 mM DTT followed by alkylation with 50 mM iodacetamid. Proteins were digested using trypsin solution (Sigma sequencing grade). The peptide containing supernatant was pooled into an additional microtitre tray and digested peptides in the gel extracted with 10% formic acid and pooled with the initial supernatant. Extracts were freeze dried and resuspended with 5% ACN/ 0.1% formic acid for MS analysis.
Protein identification: Peptides were analysed by LC-MS/MS using a Surveyor LC system and LCQ Deca XP Plus (ThermoScientific). Briefly, peptides were resolved by reverse phase chromatography (Biobasic column, ThermoScientific; 180 μM × 15 mm) over a 30 min ACN gradient at a flow rate of 2 μl/min. Peptides were ionised by electrospray ionisation and MS/MS was acquired on ions dependant on their charge state and intensity.
MASCOT searching algorithm was used to interrogate SwissProt with Human taxonomy (v. 2010_06) using the following search criteria: tryptic peptides with up to one missed cleavage and carbamidomethylation of cysteines and oxidation of methionines, which were set as variable modifications. Peptides above the MASCOT significance threshold were considered as positive assignments. For peptides that matched with multiple members of a protein family, the proteins whose predicted molecular weight was closest to the actual molecular weight measured by MALDI-TOF/MS were selected.
Immunoprecipitation
Antibodies used in the immunoprecipitation study were Rabbit polyclonal antibody to APOC3 (Abcam, USA) and Goat polyclonal antibody to APOA1 (GeneTex). Dynabeads Protein G (Invitrogen) was incubated with each antibody and then diluted serum (1/10 dilution in urea buffer and 1/7 in PBS) incubated with the beads-antibody complex. The mixture was centrifuged and the supernatant purified and buffer exchanged with Ammonium acetate buffer in the Mini dialysis 1 kDa cut-off columns (Invitrogen). Retained proteins were applied on CM10 or Q10 array spots and protein profiles acquired as described above. Bound target proteins were eluted off the beads-antibody-antigen complex with 30% ACN/0.5% TFA and the eluate applied on CM10 or Q10 arrays and protein profiles acquired.
Western blotting
Three serum samples from each sample group were separated by SDS-PAGE electrophoresis as described above. After electrophoresis, gels were equilibrated with transfer buffer (1/2 dilution of NuPAGE transfer buffer and methanol) and separated proteins transferred onto a 0.20 μm polyvinylidene difluoride (PVDF) (Invitrogen) membrane. Following separation, the membrane was washed and blocked and next incubated with 1 μg/ml of primary antibody (Rabbit polyclonal antibody to APOC3 (Abcam) or Goat polyclonal antibody to APOA1 (GeneTex)). The secondary antibody solution (Alkaline-Phosphatase Conjugated Anti-goat or Anti-rabbit IgG) was then applied, followed by Novex Alkaline-Phosphatase BCIP/NBT Chromogenic substrate (Invitrogen) until purple bands developed.
ELISA
Serum levels of the two identified biomarkers in 22 control serum samples, 30 AA samples and 6 ATG samples were measured using ELISA quantification kits with serum samples diluted according to the manufacturer’s recommendations.
A polyclonal antibody specific for APOC3 has been pre-coated onto a plate of a APOC3 ELISA kit (AssayPro, USA) and 50 µl/well of diluted serum was added and incubated, followed by incubation with biotinylated polyclonal antibody. Streptavidin-peroxidase conjugate was next added, wells incubate and then chromogen substrate added until the optimal colour density was developed. The reaction was stopped by the addition of stop solution.
Levels of APOA1 were measured using a sandwich APOA1 ELISA kit (Mabtech). 100 μl of capture antibody was added to wells, followed by blocking with 1% BSA in PBS and incubation with 100 μl of diluted serum. This was followed by incubation with biotinylated secondary antibody and another incubation with horse-radish peroxidase-conjugated streptavidin. Finally, tetramethyl-benzidine substrate solution was added until optimal colour developed and the reaction was stopped by adding stop solution. The absorbance for both ELISA assays was read at 450 nm in a BioTek FLx800 microplate reader (BioTek, USA). Measurements were analysed using Gen5 data analysis software (BioTek). Results were compared with unpaired Student t-test; values of p<0.05 were considered significant.
Results
Serum protein profiles were obtained from denatured, diluted serum samples analysed on cation exchange CM10 surface and anion exchange Q10 surface at pH5.5 and pH6.0 using SELDI-TOF/MS. In the discovery phase, a total of 240 spectra were acquired from 60 samples. To compensate for any spectrum-to-spectrum variation due to differences in total protein concentration or sample preparation, peak intensities were normalised to total ion current and only spectra with normalization factors <2SD from the mean normalisation factor were included in analysis.
Peak detection with the Lucid software resolved a total of 134 peaks on both CM10 and Q10 arrays in the m/z ratio between 3500 and 75000. Of these 53 significantly (p<0.05) discriminated between AA and control samples (disease-associated peaks) while 31 were significantly altered when comparing AA and ATG samples (therapy-associated peaks).
Detection of candidate disease-associated and therapy-associated biomarkers: A total of 53 protein peaks differentiated samples from AA and control group at p<0.05 over the four conditions, of which 34 showed increased expression in AA samples while 19 were decreased (Table 2). While the protein profiles expressed in different conditions were largely different, some peaks could be detected on both surfaces and/or both pHs with similar trends of alterations. For example, peaks at 4.1, 8.9, 9.1, 12.5, 15.1, 15.3 and 15.8 kDa were detected in more than one condition and consistently showed increased expression in AA sera. Similarly, peaks at 4.4, 7.7, 9.3 kDa displayed constant decrease in AA sera on more than one array condition.
In addition to disease-associated peaks, 31 peaks from a total of 134 detected peaks were altered as a result of ATG therapy. 15 of these were increased and 16 decreased in AA serum compared with serum after treatment (Table 2). Similar to disease-associated peaks, some peaks were commonly observed in more than one condition.
From the altered peaks two were further characterised and formally identified (Table 2, underline peaks), both of which were downregulated in AA samples. They were identified as APOC3 (9128 Da), and APOA1 (28109 Da). APOC3 peak was also associated with ATG treatment and is a potential disease-associated biomarker that is upregulated in treated compared to untreated AA patient samples.
Having identified potential biomarker peaks, the attempt was made to characterise them further by obtaining their formal identities. This was possible for 2 proteins, APOA1 and APOC3. The identification and verification strategy for both proteins was identical and is exemplified by the explanation of the identity of the 28109 kDa biomarker. The quantitative information of 28.1 kDa peak is shown in Figure 1A. The peak was detected on Q10 arrays at pH6 and its mean expression was decreased by 28% in AA serum compared with healthy individuals (p=0.004) and further decreased in ATG treated patients compared with untreated patients, although not to a significant level. The protein was then enriched and identified by MS as human APOA1 and its identity further confirmed by immunodepletion. The results obtained by ProteinChip and SELDI analysis were finally validated by Western blot and ELISA. Detailed identification and validation strategy is explained below.
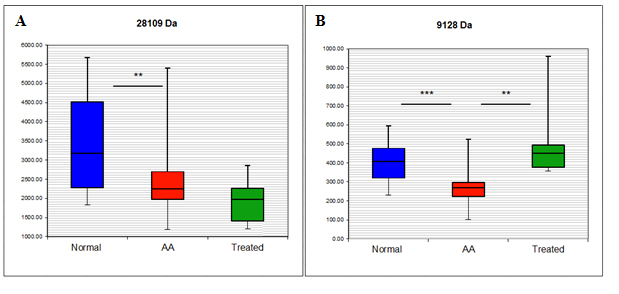
Figure 1. Box and whisker plot of the intensity of the 28.1 kDa (A) and 9.1 kDa (B) peaks detected by SELDI-TOF/MS.
Prior to protein identification by MS the complexity of serum samples was reduced and candidate biomarkers concentrated by fractionating serum samples with anionic or cationic spin columns over a pH gradient of elution buffers. Fractions were further concentrated by size fractionation through filtering columns and analysed by SELDI-TOF/MS to confirm initially discovered biomarker masses. Fractions that contained proteins with masses similar to those observed within the original SELDI spectra were subsequently separated by 1D gel electrophoresis. Gel bands with masses similar to those of potential biomarkers were cut out and prepared for both passive elution and in-gel trypsin digestion. The experimental strategy is shown in Figure 2. Proteins were passively eluted from gel bands and quality controlled on NP20 arrays to establish which band corresponded to biomarker peaks in original SELDI spectra. This was a crucial step as proteins do not always migrate in gels at their predicted masses. When the peak mass of the eluted protein matched the biomarker peak, corresponding band was subject to in-gel trypsin digest and LC-MS/MS and its content formally identified.
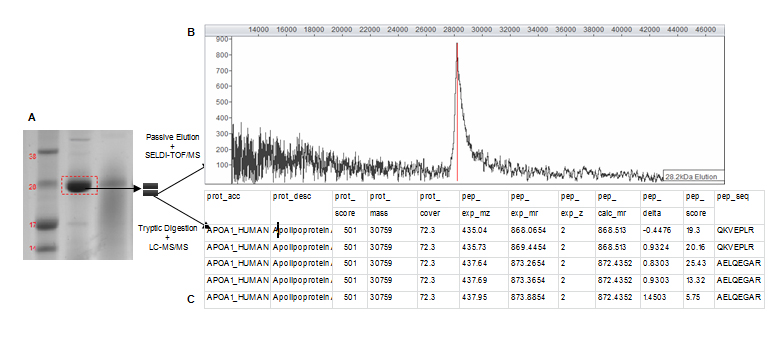
Figure 2. Experimental strategy for the 28.1 kDa biomarker identification.
The SELDI-TOF/MS analysis of a gel band after passive elution strongly supports the identity of a particular SELDI biomarker peak. A degree of uncertainty is, however, introduced when an increase in Mr of the passively eluted protein occurs compared to the originally discovered biomarker. As illustrated by the example of the 28.1 kDa candidate biomarker, when the corresponding gel band (Figure 2A) was passively eluted, a single 28.2 kDa peak was produced (Figure 2B). The passively eluted peak was about 100 Da bigger than the biomarker peak (28.1 kDa). Similar increases in molecular mass after passive elution were previously observed by our group and were postulated to be most probably caused by acrylamide adducts produced from the gel or protein formylation induced by formic acid used in the passive elution protocol [1,2].
The characterization of the 28 kDa gel band and the 28.1 kDa biomarker peak highlights another potential problem. It is sometimes hard to precisely locate a band on a gel so it could be argued that this band is located at 27 kDa and not 28 kDa (Figure 2A). A 27.2 kDa SEDLI peak was indeed detected in some samples. Although this peak was weak compared to the 28.1 kDa peak and it was not detected in all samples, without the passive elution steps one could have concluded that the 28 kDa gel band corresponds to the 27.2 kDa peak and not the biomarker peak at 28.1 kDa. However, passive elution of the selected band ensured that the band was indeed the biomarker of interest whether or not it migrated at its predicted Mr on the gel.
Following passive elution, the remaining half of the 28 kDa band was tryptically digested and generated peptide mixture analysed by LC-MS/MS. A MASCOT search of derived peptide masses in the SwissProt protein database produced a high probability identification of this protein as APOA1 (Figure 2C). MS analysis of the 28 kDa gel band identified 2 additional proteins. This was observed when identifying other biomarkers. This is a common limitation of 1D gel electrophoresis as it cannot always separate all proteins. Although unlikely based on the overall protein score, the presence of these two proteins in the 28 kDa gel band cannot be disputed. However, the presence of a single 28 kDa peak in the passive elution spectra and the immunodepletion of this peak with a specific antibody (explained below) strongly suggest that the 28 kDa gel band contains the APOA1 biomarker.
Biomarker verification
Direct verification of the identified biomarker was achieved by immunodepletion, Western blotting and ELISA assay.
Although the identification of APOA1 was obtained with high confidence, it was necessary to confirm that serum APOA1 comprises the 28.1 kDa peak observed by SELDI-TOF. This was achieved by demonstrating that a polyclonal antibody specific to APOA1 recognises a single band by Western blot analysis after serum separation by 1D gels (Figure 3A).
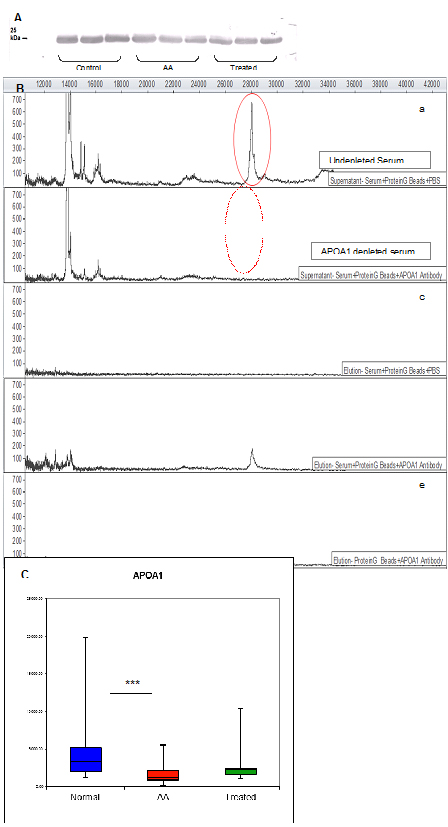
Figure 3. Verification of the 28.1 kDa biomarker by Western blot, immunoprecipitation and ELISA.
Once it was verified that a polyclonal APOA1 antibody was effective at recognising an individual biomarker protein of the expected size, it was possible to selectively immunodeplete this protein from serum. Incubation of serum with anti-APOA1 antibody bound to Protein G-Beads resulted in a loss of the 28.1 kDa peak in the SELDI-TOF mass spectrum (Figure 3B).
Diagnostic accuracy of the identified biomarker was assessed by measuring its serum levels by ELISA. The APOA1 concentration in AA sera differed significantly from control sera (AA mean=1642.2 ± 201.9 SEM μg/ml, control mean=3962.8 ± 618.8 SEM μg/ml; p=0.0001), verifying SELDI results and confirming APOA1 as a disease-associated biomarker (Figure 3C).
Publication history
The proteomics strategy described above for APOA1 was used in identifying an additional differentially expressed protein, APOC3. The mean intensities of this protein determined by SELDI-TOF/MS are shown in Figure 1B. Its mean expression was decreased by 30.5% in AA serum compared with healthy individual (p=0.00017) and 46.6% compared with ATG treated patients (p=0.0014). This protein was immunodepleted from serum and its concentrations measured by ELISA assay, indicating significantly lower levels in AA samples compared to both control and treated AA samples (AA mean=17.47 ± 2.49 SEM μg/ml, control mean=51.31 ± 8.36 SEM μg/ml, treated mean 57.57 ± 10.66 μg/ml; p<0.001 AA vs control; p<0.001 AA vs treated) and confirming APOC3 as both a disease- and therapy- associated marker. Western blot, immunodepletion and ELISA figures for APOC3 are shown in Figure 4.
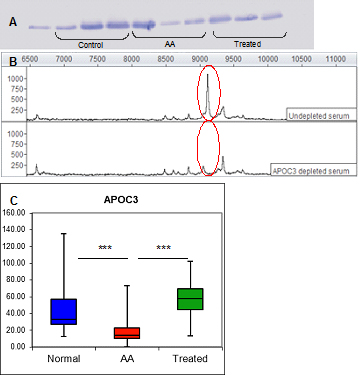
Figure 4. Verification of the 9.1 kDa biomarker by Western blot, immunoprecipitation and ELISA.
MASCOT search results for biomarker identifications following LC-MS/MS analysis are shown in Supplemental Table 1.
Discussion
Proteomic technologies are being used with increasing frequency to identify diagnostic and therapeutic targets in human disease. ProteinChip technology based on the SELDI-TOF/MS has been utilised for biomarker discovery in various diseases. Here we report the first SELDI-TOF/MS based proteomic analysis of serum in AA. Our aim was to identify biomarkers that may help understand the AA pathology and potentially be useful in its diagnosis and management. It was shown that a strategy combining ProteinChip arrays, SELDI-TOF/MS, spin column chromatography, 1D gel electrophoresis and LC-MS/MS was capable of discovering and identifying serum biomarkers of AA. Results revealed a number of disease- and therapy-associated proteome changes in these patients. A successful identification was achieved for two statistically validated biomarkers, one of which was both a disease- and therapy-associated marker (APOC3) discriminating AA samples before treatment and control samples as well as AA samples before and after ATG treatment. Another identified biomarker (APOA1) was disease-associated as its spectral intensities differed significantly between AA and control samples.
ELISA assays were performed for biomarker verification; however a consideration that needs to be addressed when comparing ELISA and SELDI results is that SELDI analysis determines protein identity and mass, while ELISA determines protein identity and quantity. Although ELISA is more sensitive in its antigen detection, it is indiscriminate of the distribution of isoforms or protein fragments, whereas SELDI analysis can detect protein structural differences. If multiple forms of a protein are present (isotopes, fragments etc.), each may appear as an individual SELDI peak of which only some may be differentially expressed. With ELISA on the other hand, it is possible that the antibody binds to several protein forms producing a composite signal of all detected forms. This may explain what may seem as a discrepancy between the ELISA and SELDI results seen in the analysis of the 28.1 kDa peak (Figure 1A and 3C). In the ELISA analysis this candidate biomarker is down-regulated in AA compared with healthy controls as well as to ATG treated patients while in the SELDI analysis the 28.1 kDa peak is further down-regulated in ATG treated patients, although this was not significant. These differences emphasise the need to use large data sets for SELDI analysis and to validate the obtained data with confirmatory assays with, if possible, also a large number of samples.
APOA1 was identified following characterisation of the 28.1 kDa biomarker peak which was significantly decreased in AA patients. APOA1 is a major component of high-density lipoproteins and has a specific role in lipid metabolism. It is one of the most frequently identified proteins using SEDLI-based analysis and has been described as a biomarker in a variety of diseases, showing mainly reduced expression [3-7]. APOA1 is a well-known negative acute phase protein (APP) with anti-inflammatory effects and the ability to inhibit production of the major inflammatory cytokines IL-1 and TNF-α [8] suggesting that increased levels of APOA1 may be beneficial in treatment of rheumatoid arthritis [9]. Decreased levels of APOA1 were also found to be relevant in pathogenesis of other autoimmune diseases [10,11]. APOA1 production by the liver on the other hand is inhibited by the same group of inflammatory cytokines [12]. Although not using the same strategy, an additional negative APP in the form of albumin was detected (data not shown). APP are mainly synthesised by the liver and their serum concentrations change by at least 25% during inflammatory processes [13]. Despite the name, APP are involved in both acute and chronic inflammatory processes that result from the host response activated by infections, autoimmune reactions, stress, injury and tumours. It is becoming evident that when combined and used with other markers, APP may allow more specific diagnosis and classification [14,15].
Following identification of APOA1, an additional apolipoprotein was identified, APOC3 (9.1 kDa). While APOA1 was a marker for differentiation of AA and control samples, APOC3 was a dual marker and differentiated these samples as well as AA and ATG samples. When observing serum levels of biomarkers pre and post treatment, APOC3 demonstrated change in expression levels (measured by both SELDI and ELISA) in the opposite direction, with its level being reduced in AA pre-treatment but increasing significantly following ATG therapy. This, in accordance with its immunomodulatory role (although through unknown mechanisms) shows the ability of the ATG treatment to “normalise” levels of this proteins in serum. Understanding the underlying processes may help explain lack of response to ATG therapy in some AA patients.
Similar to APOA1, APOC3 main function is in plasma lipoprotein metabolism [16]; additional cellular functions may also exist. It was also demonstrated to stimulate cell survival signalling pathways and reduce pro-inflammatory cytokine-induced apoptosis [17,18]. Alterations in blood levels of APOC3 were described in several diseases with reduced concentration in liver cirrhosis [19] and cancers [20,21]. Increased levels were also reported [22].
Although AA has been extensively investigated, apart from some inflammatory cytokines, little is known about soluble circulating factors in the blood including serum proteins. Some proteins identified here are APP and markers of inflammation whose presence and altered expression may suggest ongoing inflammatory processes in AA. The link between inflammation and haemopoiesis in AA is unknown; however these processes are closely related as all immune cells are derived from BM and released upon demand. APP expression in the liver is stimulated and regulated by various pro- and anti-inflammatory cytokines of which IL-1, IL-6, IL-8 and TNF-α play the most important role [23]. These cytokines act on and are produced by many different cells including lymphocytes, monocytes, macrophages and stromal cells and their levels will be affected by alterations in numbers or function in any of these cells. Imbalance and excessive production of inflammatory cytokines have been confirmed to contribute to the pathogenesis of AA (reviewed by [24]. However, finding a link between biomarkers identified here and various inflammatory cytokines that may be relevant in AA is very difficult. A complex network of pathways may exist in which for example, low levels of anti-inflammatory APOA1 and APOC3 molecules may be insufficient to inhibit further production of inflammatory factors, thus further adding to the inflammatory processes. The exact effects APP and inflammatory proteins have in AA are yet to be characterised. Only then possible imbalances in cytokine and protein activates may be identified and underlying links between multiple factors discovered. Until that time, the exact regulation of APP in AA and its similarities/differences with regulation in normal immunological processes remains unknown.
In conclusion, the SELDI-TOF/MS protein profiling was demonstrated to be useful for identification of serum biomarkers associated with AA. Two identified proteins appear to be valuable markers with potential biological significance; additional studies are needed to define their exact role in AA. Furthermore, if they are ever to be used in a future diagnostic or prognostic test, their individual and combined discriminatory power has to be assessed in a blind, independent sample set.
Authorship and contributorship
Edita Hamzic participated in the design of the study, carried out all experimental work and drafted the manuscript. Karen Whiting and Ruth Pettengell participated in the design and coordination of the study and helped to draft the manuscript. All authors read and approved the final manuscript.
Acknowledgements
We thank the UK charity Aplastic Anemia Trust for funding this project. We also wish to express our gratitude to all patients and healthy volunteers who donated blood samples.
Funding information
This research was funded by the Aplastic Anemia Trust, UK.
References
- Le Bihan MC, Tarelli E, Coulton GR (2004) Evaluation of an integrated strategy for proteomic profiling of skeletal muscle. Proteomics 4: 2739-2753. [Crossref]
- Le Bihan MC, Hou Y, Harris N, Tarelli E, Coulton GR (2006) Proteomic analysis of fast and slow muscles from normal and kyphoscoliotic mice using protein arrays, 2-DE and MS. Proteomics 6: 4646-4661. [Crossref]
- Engwegen JY, Helgason HH, Cats A, Harris N, Bonfrer JM, et al. (2006) Identification of serum proteins discriminating colorectal cancer patients and healthy controls using surface-enhanced laser desorption ionisation-time of flight mass spectrometry. World J Gastroenterol 12: 1536-1544. [Crossref]
- Ehmann M, Felix K, Hartmann D, Schnölzer M, Nees M, et al. (2007) Identification of potential markers for the detection of pancreatic cancer through comparative serum protein expression profiling. Pancreas 34: 205–214. [Crossref]
- Calès P, Oberti F, Michalak S, Hubert-Fouchard I, Rousselet MC, et al. (2005) A novel panel of blood markers to assess the degree of liver fibrosis. Hepatology 42: 1373-1381. [Crossref]
- Dayal B, Ertel NH (2002) ProteinChip technology: a new and facile method for the identification and measurement of high-density lipoproteins apoA-I and apoA-II and their glycosylated products in patients with diabetes and cardiovascular disease. J Proteome Res 1: 375–380. [Crossref]
- Mateos-Cáceres PJ, García-Méndez A, López Farré A, Macaya C, Núñez A, et al. (2004) Proteomic analysis of plasma from patients during an acute coronary syndrome. J Am Coll Cardiol 44: 1578-1583. [Crossref]
- Hyka N, Dayer JM, Modoux C, Kohno T, Edwards CK 3rd, et al. (2001) Apolipoprotein A-I inhibits the production of interleukin-1beta and tumor necrosis factor-alpha by blocking contact-mediated activation of monocytes by T lymphocytes. Blood 97: 2381-2389. [Crossref]
- Dayer JM (2002) The saga of the discovery of IL-1 and TNF and their specific inhibitors in the pathogenesis and treatment of rheumatoid arthritis. Joint Bone Spine 69: 123-132. [Crossref]
- Dinu AR, Merrill JT, Shen C, Antonov IV, Myones BL, et al. (1998) Frequency of antibodies to the cholesterol transport protein apolipoprotein A1 in patients with SLE. Lupus 7: 355-360. [Crossref]
- Zhang B, Pu S, Li B, Ying J, Song XW, et al. (2010) Comparison of serum apolipoprotein A-I between Chinese multiple sclerosis and other related autoimmune disease. Lipids Health Dis 9: 34–39. [Crossref]
- Navarro MA, Carpintero R, Acín S, Arbonés-Mainar JM, Calleja L, et al. (2005) Immune-regulation of the apolipoprotein A-I/C-III/A-IV gene cluster in experimental inflammation. Cytokine 31: 52-63. [Crossref]
- Kushner I (1982) The phenomenon of the acute phase response. Ann N Y Acad Sci 389: 39-48. [Crossref]
- de Seny D, Fillet M, Ribbens C, Marée R, Meuwis MA, et al. (2008) Monomeric calgranulins measured by SELDI-TOF mass spectrometry and calprotectin measured by ELISA as biomarkers in arthritis. Clin Chem 54: 1066-1075. [Crossref]
- Fung ET, Yip TT, Lomas L, Wang Z, Yip C, et al. (2005) Classification of cancer types by measuring variants of host response proteins using SELDI serum assays. Int J Cancer 115: 783-789. [Crossref]
- Jong MC, Hofker MH, Havekes LM (1999) Role of ApoCs in lipoprotein metabolism: functional differences between ApoC1, ApoC2, and ApoC3. Arterioscler Thromb Vasc Biol 19: 472-484. [Crossref]
- Song G, Ouyang G, Bao S (2005) The activation of Akt/PKB signaling pathway and cell survival. J Cell Mol Med 9: 59-71. [Crossref]
- Storling J, Juntti-Berggren L, Olivecrona G, Prause MC, Berggren PO, et al. (2011) Apolipoprotein CIII reduces proinflammatory cytokine-induced apoptosis in rat pancreatic islets via the Akt prosurvival pathway. Endocrinology 152: 3040–3048. [Crossref]
- Gobel T, Vorderwülbecke S, Hauck K, Fey H, Häussinger D, et al. (2006) New multi protein patterns differentiate liver fibrosis stages and hepatocellular carcinoma in chronic hepatitis C serum samples. World J Gastroenterol 12: 7604–7612. [Crossref]
- Fan Y, Shi L, Liu Q, Dong R, Zhang Q, et al. (2009) Discovery and identification of potential biomarkers of papillary thyroid carcinoma. Mol Cancer 8: 79. [Crossref]
- Cohen M, Yossef R, Erez T, Kugel A, et al. (2011) Serum apolipoproteins C-I and C-III are reduced in stomach cancer patients: Results from MALDI-based peptidome and immuno-based clinical assays. PLoS One 6 :e14540. [Crossref]
- Davidsson P, Hulthe J, Fagerberg B, Olsson BM, Hallberg C, et al. (2005) A proteomic study of the apolipoproteins in LDL subclasses in patients with the metabolic syndrome and type 2 diabetes. J Lipid Res 46: 1999-2006. [Crossref]
- Gabay C, Kushner I (1999) Acute-phase proteins and other systemic responses to inflammation. N Engl J Med 340: 448-454. [Crossref]
- Li JP, Zheng CL, Han ZC (2010) Abnormal immunity and stem/progenitor cells in acquired aplastic anemia. Crit Rev Oncol Hematol 75: 79-93. [Crossref]
- Sundsten T, Eberhardson M, Göransson M, Bergsten P (2006) The use of proteomics in identifying differentially expressed serum proteins in humans with type 2 diabetes. Proteome Sci 4: 22. [Crossref]
- Florian-Kujawski M, Hussain W, Chyna B, Kahn S, Hoppensteadt D, et al. (2004) Biomarker profiling of plasma from acute coronary syndrome patients. Application of ProteinChip Array analysis. Int Angiol 23: 246–254. [Crossref]