Indigent and minority populations are often at higher risk of infectious diseases than other demographic groups. These communities may be at particular risk in urban areas. Environmental and demographic factors were analyzed in the city of Savannah, in Chatham County Georgia, USA, to determine if poor and minority communities were at higher risk of West Nile virus. During an approximately 10 year period, the area at risk of West Nile virus grew by 400% in Chatham County. Elderly citizens and female citizens were more likely to be diagnosed with West Nile virus. Those living in minority and indigent communities were 4.5 and 5.5 times more likely to be at risk of West Nile virus than predominantly white and wealth communities. Citizens who lived in white and wealthy neighborhoods were 19 times more likely to contact and receive services from the Chatham County Mosquito Control Department. It is recommended that evidence public health practices be adopted and new technologies incorporated into the vector management plan of the Chatham Mosquito Control Department. In addition, coordination with other county departments should focus on alleviating infrastructure and other factors contributing to the elevated risk of vector-borne diseases in minority and poor communities.
west nile virus, infectious diseases, high risk
The primary social determinants of several diseases are poverty and race/ethnicity [1]. Vector-borne diseases are often associated with poverty and ethnicity, including West Nile virus (WNV). West Nile virus was first detected in North America during 1999 [2], and soon after, the hypotheses was postulated that urban areas would be at particularly high risk of WNV [3]. Lower income residents in Baltimore were at higher risk of exposure to a principal vector of WNV, Culex pipiens [4]. West Nile virus was first detected in Chatham County in 2002 [5]. In 2003, the Chatham County Mosquito Control Department (CCMC) conducted a review of WNV control in the county, mapping mosquitoes, collecting dead birds, and using sentinel chickens; a high risk area of WNV was identified in the urban area of Savannah where 78% of human cases occurred [6]. In 2013, the Centers for Disease Control and Prevention [7] stated, “CDC and its partners work to identify and address the factors that lead to health disparities among racial, ethnic, geographic, socioeconomic, and other groups so that barriers to health equity can be removed. The first step in this process is to shine a bright light on the problems to be solved.” However, environmental and demographic data were not sufficiently investigated to determine what factors contribute to the distribution of WNV in Chatham County, Georgia, USA. The following manuscript describes much of the effort to update what is known of the current risk of WNV.
Spatial and statistical analyses of mosquito surveillance, environmental data, human demographic and WNV human cases from a 16 year span (2000 through 2015) were conducted for the city of Savannah and Chatham County, Georgia, USA. Human cases of WNV were provided by the Georgia Public Health Department. Demographic data from the U.S. Census Bureau [8] was used for analyzing socioeconomic variables (www.census.gov). Statistica, ArcGIS, and the Bioagent Transport and Environmental Modeling System (BioTEMS) were used to analyze the data. Output from BioTEMS and ArcGIS were uploaded into Google Earth. Mosquito trap data, dead bird and chicken sentinel data were provided by CCMC. Data from the following variables were tested; phone calls per 1,000 people, adult mosquito numbers, historical traps per area, current traps per area, traps per 1,000 people, trap nights, race, population density per 1,000, median family income, indigent family of five, location, percent wetland, percent marsh, vegetation, water sources, and prevalence of WNV in the human population. Passive Surveillance was based upon the number of complaint calls from citizens. Active surveillance is defined as the direct collection of vector/pathogen data by the organization entering the environment or initiating contact with citizens; e.g. trapping, use of sentinel chickens. Passive surveillance is defined as the collection of data through citizens initiating contact with the organization, e.g. recording incoming calls and emails.
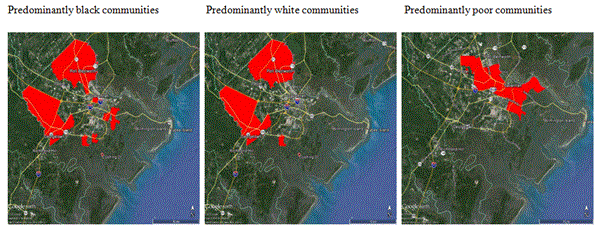
There were 23 cases of WNV reported in Chatham County between 2003 and 2014. An examination of demographics and zone where WNV occurred in Chatham County reveals a number of patterns (Figure 1). Those living in minority areas were 4.5 times more likely to live in a high risk area of WNV than in white neighborhoods. Those living in low-income neighborhoods were 5.5 times more likely to live in a high risk area of WNV. Females were 1.9 times more likely to be diagnosed with WNV. The mean age of WNV cases was 55.1 yrs. There was a significantly higher risk of WNV in those 40 yrs and older than those under 40 (Chi sq = 19.6, p < 0.05). Senior citizens were at higher risk of WNV when compared to the rest of the population in Chatham County (Chi-square = 17.1, p <0.05). Blacks were half as likely to be diagnosed with WNV. The one death recorded was a black female age 83. Whether blacks are less likely to receive medical care than those in the white population due to insufficient access to medical care may be a factor in under reporting of minority cases of WNV.

Figure 1. Areas where highest proportion of African-American, Caucasian and Indigent populations are at risk from West Nile virus based on the Bioagent Transport and Environmental Modeling System.
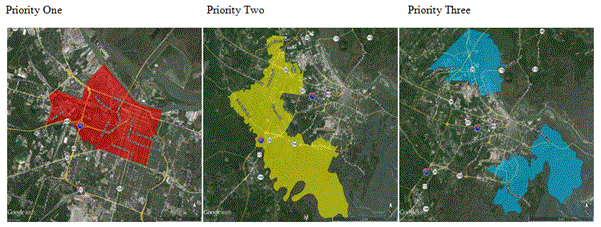
An important question to ask in community mosquito control is whether passive and active mosquito surveillance methods are balanced among geographic and demographic populations in Chatham County and whether the prevalence of WNV is a driver of both passive and negative surveillance. The number of calls from an area was positively associated with median income, the percent of whites in an area and the percent of wetlands and marsh (p<0.05). In addition to biological and environmental effects, local mosquito control practices, policies, geographic-based economics, and cultural factors can shape the spread of mosquito-borne diseases [9]. The number of calls from an area was negatively associated with the number of trap sites in an area and the percent of blacks or Pacific Islanders/Polynesians in the area (p<0.05). In addition to biological and environmental effects, local mosquito control practices, policies, geographic-based economics, and cultural factors can shape the spread of mosquito-borne diseases [9]. A person living within a white and wealthy neighborhood was 19 times more likely to call and receive a response from CCMC. Priority areas for educating home owners to call to inform and to receive Chatham County Mosquito Control Department services have been identified (Figure 2). An increased effort by CCMC is required to inform disadvantaged communities of services in order to reduce their risk not only to WNV but also to Zika virus should it enter the city of Savannah and Chatham County.

Figure 2. Priority areas for educating home owners to call to inform and to receive Chatham County Mosquito Control Department they require information and to inform the department they have a mosquito problem.
LaDeau et al. [4] determined that lower income Baltimore residents were at high risk of exposure to the vector of WNV; there was also a mismatch among residents who reported nuisance mosquitoes and risk index. An evaluation of active surveillance effort using the number of trap sites in an area was positively correlated with whether a family of five was indigent, the percent of blacks in an area, the prevalence of WNV in the population, the prevalence of WNV in blacks and the number of trap nights in an area. The number of trap sites per population was positively associated with the number of calls per population and negatively associated with prevalence of WNV in blacks and the number of trap nights. The number of trap nights in an area was positively correlated with the prevalence of WNV, prevalence of WNV in blacks, the population density and negatively correlated with income and percent wetland. There was not a significant difference between the number of trap nights in the population based upon median income, race, or whether a family of was indigent. The prevalence of WNV was positively correlated with the number of indigent families in an area, the percentage of blacks in an area, the population density, the number of trap sites in an area and the number of trap nights in an area. The prevalence of WNV was negatively correlated with the median income, the percent of whites in an area, and the percent of wetland in an area. The number of active trap sites was significantly higher in areas where the percentage of whites was higher than in areas where blacks made up a higher percentage of the population (Chi-square df=1, 19.5, p< 0.04).
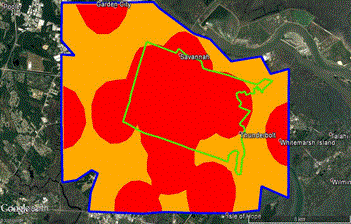
The area described by CCMC as the “Hot Zone” for cases WNV humans has increased by 400% during 2003 to 2016 (Figure 3). The number of active trap sites per WNV zones was below the mean in non-WNV zones p ≤ 0.05.

Figure 3. The area of concern for West Nile virus has expanded by > 400% from original hot spot (green outline) to new hot spot (blue outline). Red color indicates high risk areas, yellow indicates moderate risk of West Nile virus (based on human cases).
Organizations that employ large numbers of professionals will not perform well if they become overly bureaucratic because they are bureaucratized and hierarchical they are less flexible, less amenable to change and less likely to empower staff [10]. Although experience is necessary, the use of evidence based methodology is critical in making effective vector control decisions. Since 2002, CCMC has conducted several modifications of the WNV program, including using gravid traps for surveillance, conducting molecular testing of mosquitoes, applying Naled pesticide for adult control, and larviciding catch basins. Despite these efforts the area at risk of WNV has grown significantly. CCMC should implement evidence based planning and coordinate with other Chatham County departments to reduce the expansion and risk of vector-borne diseases in the city of Savannah and the county. Some examples follow. The use of sentinel chickens was terminated in 2003 as it was determined that this method was not found to be adequate for prediction time [6]. However since that time, new methods and the information gathered by using sentinel chickens have been developed (http://westnile.ca.gov). At the present time, mosquito testing for WNV is the only method being used by CCMC to identify areas where humans are at risk from WNV, however Lewandowski and Moulis [6] stated, “infected mosquitoes may indicate an increased risk of human infection, but cannot be relied on to predict the timing of human cases.” Additionally, despite the fact that wild birds are the principal hosts for WNV, no testing of live birds is being conducted by CCMC. Immunological and testing of song birds can be used to assist in the prediction of WNV in human populations, therefore it is recommended that this methodology be adopted by CCMC to provide information on WNV risk, particularly in poor and minority neighborhoods. Another medically important mosquito species is Aedes albopictus. In Baltimore, Washington DC and New Jersey, poverty was associated with the presence of this Ae. albopictus [4,11]. Air and maritime port areas in Chatham County have been identified as high risk areas for import of mosquito species infected with Zika virus [12]. In a follow up manuscript, the risk of Zika virus and preventive measures in poor and minority neighborhoods in Chatham County will be discussed. Additional efforts should be taken by CCMC and public health officials to increase active and passive surveillance in disadvantaged communities in Chatham County, Georgia, USA. In addition to increasing surveillance in indigent and minority neighborhoods other steps should be taken to protect these susceptible citizens from mosquito-borne diseases. The use of new technologies should be tested, such as using non-toxic bait stations to reduce the abundance of Cu. quinquefasciatus. Identifying environmental factors that can be modified to reduce risk in collaboration with public works and engineering departments should be initiated. Because of the disparity of phone call services and internet access, educating families on the threat of mosquito-borne diseases by actively going into neighborhoods door to door and through direct calls should be conducted.
The author would like to thank Rosmarie Kelly (Georgia Department of Health), Robert Moulis and Laura Peaty (Chatham County Mosquito Control) for providing data for this study.
- Hotez PJ, Murray KO, Buekens P (2014) The Gulf Coast: a new American underbelly of tropical diseases and poverty. PLoS Negl Trop Dis 8: e2760. [Crossref]
- Lanciotti RS, Roehrig JT, Deubel V, Smith J, Parker M, et al. (1999) Origin of the West Nile virus responsible for an outbreak of encephalitis in the northeastern United States. Science 286: 2333-2337. [Crossref]
- Allan BF, Langerhans RB, Ryberg WA, Landesman WJ, Griffin NW, et al. (2009). Ecological correlates of risk and incidence of West Nile virus in the United States. Oecologia 158: 699-708. [Crossref]
- LaDeau SL, Leisnham PT, Biehler D, Bodner D (2013) Higher Mosquito Production in Low-Income Neighborhoods of Baltimore and Washington, DC: Understanding Ecological Drivers and Mosquito-Borne Disease Risk in Temperate Cities. Int J Env Res Public Health 10: 1505-1526. [Crossref]
- Moulis RA, Lewandowski HBJr, Russell JD, Heusel JF, FAW Peaty LFAW, et al. (2013) West Nile virus activity in Chatham County, Georgia during 2011. Wing Beats 24: 23-27.
- Lewandowski HBJr, Moulis R (2008) Adaptations for WNV surveillance and control in Chatham County. Tech Bull Fl Mosq. Cont Assoc 8: 20-23.
- Centers for Disease Control and Prevention (2013) Health Disparities & Inequalities Report - United States. www.cdc.gov.
- US Census Bureau (2016) Quick Facts Table. https://www.census.gov.
- Tedesco C, Ruiz M, McLafferty S (2010) Mosquito politics: local vector control policies and the spread of West Nile Virus in the Chicago region. Health Place 16: 1188-1195. [Crossref]
- Steiner C (2001) A role for individuality and mystery in managing change. J Org Chg Mgmt 14:150-167.
- Unlu I, Farajollahi A, Healy SP, Crepeau T, Bartlett-Healy K, et al. (2011) Area-wide management of Aedes albopictus: choice of study sites based on geospatial characteristics, socioeconomic factors and mosquito populations. Pest Manag Sci 67: 965-974. [Crossref]
- Kollars TM (2106) Identification of arbovirus surveillance sites at maritime and airports to reduce the risk of export of Eastern Equine Encephalitis and import of Zika viruses into coastal Georgia. J Dent Med Sci 15: 87-90.
2021 Copyright OAT. All rights reserv


