Abstract
“Distributed stem cells (DSCs)” refers to stem cells that function in a tissue-specific manner in pre- and post-natal tissues. Asymmetric self-renewal by DSCs distinguishes them from pluripotent stem cells and embryonic precursor cells. DSCs, which first appear during fetal development, continuously replenish expired mature differentiated tissue cells while maintaining their own undifferentiated stem cell phenotype. The exact mathematical form of DSC asymmetric self-renewal is a long-standing unsettled issue in tissue cell biology. The key question is whether asymmetric self-renewal occurs by stochastic differentiation in pools of DSCs or by deterministic asymmetric cell divisions by individual DSCs. Although the cellular outputs of these two formulations can be equivalent, the molecular and cellular implications are profoundly different. Stochastic DSCs are predicted to undergo differentiation, leading to an extinction probability for tissue units; but deterministic DSCs are predicted to be differentiation resistant. We investigated cell differentiation by cultured rat hepatic DSC strains that were derived by suppression of asymmetric cell kinetics (SACK). Unlike conventional rat hepatic cell lines, derived in parallel, a significant fraction of cells in cultures of SACK-derived DSCs resisted differentiation by transforming growth factor b-1 (TGFb-1) while simultaneously dividing asymmetrically to produce TGFb-1 responsive sister cells. This property, termed “asymmetric adifferentiation” is attributable to the DSCs in these cultures. These findings provide direct evidence that, in vitro, some mammalian DSCs can deterministically resist differentiation, while producing differentiating cell lineages by asymmetric cell division. This discovery adds to the growing body of evidence that, in culture, DSCs asymmetrically self-renew deterministically. Asymmetric adifferentiation by DSCs has potential to serve as a unique functional basis for their specific identification in tissues, as well as in culture.
Key words
adult stem cell, hepatic stem cell, asymmetric self-renewal, asymmetric cell kinetics, adifferentiation, TGFb, deterministic asymmetric self-renewal, stochastic asymmetric self-renewal
Introduction
Distributed stem cells (DSCs) in pre- and post-natal tissues asymmetrically self-renew to replenish expired and lost differentiated cells while preserving their own stem cell phenotype. The term DSCs was recently introduced as a general term to encompass the varied “adult stem cells”, “tissue-specific stem cells,” “somatic stem cells,” and “germline stem cells” that emerge during late fetal and neonatal development and persist in post-natal tissues. The term embodies the developmental “distributing” of the pluripotency of embryonic epiblasts among the multi-potent and uni-potent stem cell systems that construct post-natal body plans [1].
The exact mathematical form of asymmetric self-renewal by DSCs is a persistent unsettled issue [2-5]. There are two predominant views based on respective stochastic and deterministic models (Figure 1). Though superficially equivalent for achieving the balance of cell renewal and cell differentiation required for life-long tissue homeostasis, the two mathematical forms prescribe significant implicit differences in tissue cell physiology, and, more than likely, molecular mechanisms as well. In the stochastic model (Figure 1B), every stem cell has a unit-sum probabilities for either self-duplication (i.e., classical renewal) or differentiation with loss of the stem cell phenotype. This feature constitutes a well-described stem cell extinction probability [2,6,7]. If the number of stem cells per tissue unit were not sufficiently large, tissues would suffer a high rate of destructive extinctions due to the chance simultaneous differentiation of all the stem cells in a tissue unit.
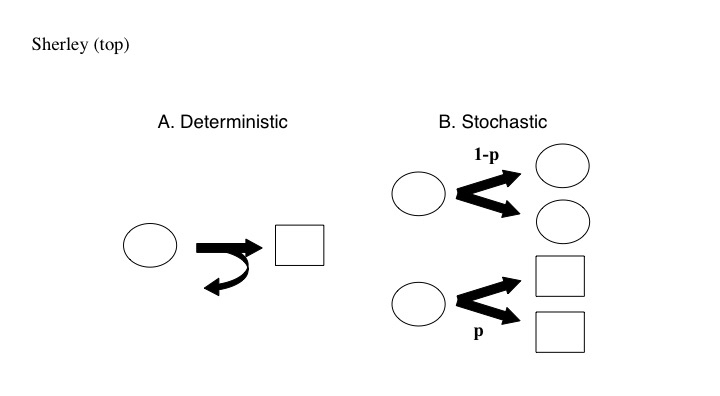
Figure 1. Theorized mathematical forms of asymmetric self-renewal by DSCs. A. The deterministic form is defined by individual DSCs (oval) undergoing continuous asymmetric cell divisions (curved arrow) that produce a new DSC and a sister cell that is committed to differentiation (rectangle). B. The stochastic form is defined by populations of DSCs that divide symmetrically with probability p to produce two cells committed to differentiation or symmetrically with probability 1-p to produce two DSCs. In the deterministic form of asymmetric self-renewal, DSCs per se do not undergo differentiation.
In the deterministic model, individual stem cells divide to produce consistently a new stem cell and a tissue lineage-committed sister cell (Figure 1A). The committed sister either differentiates directly or becomes a lineage-specific progenitor of finite proliferative capacity for production of additional differentiated tissue cells. The stem cell remains undifferentiated [8-10], or “adifferentiated,” meaning unchanged in phenotypic state [11] compared to the differentiating cells it replenishes. Recently, others and we [9,12] showed that DSCs isolated from diverse tissues exhibit deterministic asymmetric cell kinetics (ACK) in vitro. ACK is a quantitative representation of asymmetric self-renewal that does not rely on knowledge of differentiation status. ACK refers to the property of the differentiating sister of asymmetric DSC divisions, or its cell lineage, to terminate with cells that undergo a permanent division arrest, whereas the DSC sister retains indefinite division capacity [2,8,10]. Although previous studies established the ACK of DSCs in vitro [9,12,13], the differentiation status of individual DSCs was not evaluated for known markers of differentiation.
We now report an analysis of the differentiation properties of two DSC strains derived from adult rat liver, Lig 8 and Lig 13. These strains were derived by a pharmacological method called suppression of asymmetric cell kinetics (i.e., SACK; [10,12,14,15]. The SACK method was designed to promote the ex vivo expansion of DSCs by inducing them to undergo reversible symmetric self-renewal to produce two DSCs per division instead of only one [8,10,12,13,16-18]. Lig 8 and Lig 13 are termed cell strains, because they were not derived by conventional immortalization, and they exhibit ACK [12], which is not a property of immortalized cell lines [8,19-22].
Consistent with their DSC character, Lig 8 and Lig 13 cells exhibit long-term self-renewal while generating progeny with differentiated properties of mature hepatic epithelial cell types [12,14,15]. Lig 8 cultures produce cells with both hepatocytic and biliary phenotypes [12,14,15]; whereas Lig 13 cells give rise exclusively to progeny with biliary epithelial cell properties [12]. Herein, we report that, under conditions that induce mature hepatic differentiation, a significant fraction of cells in Lig 8 and Lig 13 cultures resist differentiation, but continue to produce differentiated sister cells by asymmetric divisions. This “asymmetric adifferentiation” capability is attributed to the DSCs in these cultures. This demonstration complements the deterministic asymmetric cell kinetics of DSCs with differentiation status, providing a direct confirmation of deterministic asymmetric self-renewal by these liver-derived DSCs. This DSC property has potential for general application to the challenge of developing unique identifiers of DSCs in complex cell preparations of diverse tissue, as well as in situ.
Materials and methods
Cells
The derivation of the conventional hepatic cell lines and DSC strains (Lig 1, Lig 2; and Lig 8, Lig 13, respectively) has been described in detail previously [12]. Lig 1 and Lig 2 cells were derived and maintained in xanthosine-free high glucose Dulbecco’s modified Eagle’s medium (DMEM) supplemented with 10% dialyzed fetal bovine serum (DFBS; JRH Biosciences). Lig 8 and Lig 13 cells were maintained in the same medium supplemented with 0.4 µM xanthosine (Xs; Sigma Chemical, Co.). The concentration of Xs for Lig 13 was increased from its derivation concentration of 0.2 µM [12].
The derivation of Lig 8 subclones was described earlier [23]. Lig 8 cells were seeded at 1/10 confluency in a 75-cm2 flask (Corning, Corning, New York, http://www.corning.com) one day prior to transfection. Lig 8 cells were then transfected with a cyan fluorescent protein (CFP) expression plasmid using Cytofectene (BioRad Laboratories, Hercules, California, http://www.biorad.com), per manufacturer’s suggested instructions.
Amplified plasmids for transfection were isolated by Qiagen column fractionation as specified by the supplier (Valencia, California, http://www.qiagen.com) and further purified by cesium chloride equilibrium density gradient centrifugation. Transfections were performed using 5 mg of a CFP-expressing derivative of plasmid pEGFP-N3 (Clontech Laboratories, Palo Alto, California, www.bd.com/clontech) which provides expression from a cytomegalovirus (CMV) promoter and contains a neomycin-resistance gene insert under the control of the simian virus-40 (SV40) promoter to confer resistance to Genetecin™ (Life Technologies, Carlsbad, California, http://www.lifetechnologies.com). The CFP derivative of pEGFP-N3 were prepared by digestion and complete removal of the EGFP insert using BamH1 and Not1 restriction endonucleases (New England Biolabs, Beverly, Massachusetts, http://www.neb.com). After gel purification, a CFP cDNA insert was ligated into the vector.
Approximately 1.5 × 10⁶ cells (1/5 confluency in 75-cm2 flask after 16-24 hours of culture) were transfected for 16-20 hours and then given two phosphate buffer saline (PBS) washes, followed by supplementation with regular growth medium. The transfected cells were cultured for an additional 42-48 hours. After this time period, the transfected cells were replated at 1/6 density in parallel in 10–cm2 plates (Corning, Corning, New York, http://www.corning.com). After overnight culture, the culture medium was replaced with medium supplemented to 0.5 mg/ml Genetecin™ to select for stably transfected cell clones.
After 14 days in culture, transfected cells from each 10-cm2 plate were trypsinized and each transferred into a 75-cm2 flask with selection medium maintained thereafter. After two days, 1000 transfected cells were re-seeded into each of five individual 10-cm2 dishes. Resistant colony formation was assessed after 10-14 days of culture in selection medium, with medium changes every 3 days. Several selected colonies were isolated within cloning cylinders (Bellco Glass, Vineland, New Jersey, http://www.bellcoglass.com/) harvested by trypsinization, transferred to 25-cm2 flasks (Corning, Corning, New York, http://www.corning.com), and allowed to expand for 10-14 days until the flask was >90% confluent. At that point, cells from the 25-cm2 flasks were trypsinized and transferred into 75-cm2 flasks. Within 3-4 days, the flasks were 90% confluent. After trypsinization, ~80% of the cells in cultures of expanded clones were frozen in liquid nitrogen for early passage stocks.
Antibodies and growth factors
The following antibodies (suppliers; dilutions) were used. For immunoblots, anti-PCNA (Santa Cruz; 1:2000); anti-α-tubulin (Santa Cruz; 1:1000); anti-RI (Santa Cruz; 1:500); anti-RII (Santa Cruz; 1:500); anti-phospho-Smad 2 (Upstate Technology; 1:250); and anti-alpha-1 antitrypsin (EY Laboratories; 1:5000) were used. For in situ immunofluorescence (ISIF) analyses, FITC-conjugated anti-PCNA (Santa Cruz; 1 µg/ml) and FITC-conjugated anti-Smad 2/3 (BD Biosciences; 1:250) were used. Secondary antibodies (anti-mouse, anti-rabbit, or anti-goat), purchased from Dako, Santa Cruz, and Amersham, were used at dilutions ranging from 1:200 to 1:5000. Mouse epidermal growth factor (EGF) was supplied by Becton-Dickinson. Transforming growth factor β-1 (human recombinant; TGFβ-1) was purchased from Gibco-BRL.
Differentiation protocols
For the main differentiation induction protocol at high cell density, cells were initially plated in their respective maintenance growth medium at a density of 104 cells/cm2. After 16-24 hours, the medium was replaced with regular growth medium supplemented with 10% DFBS, 1% FBS, or 1% FBS + EGF (20 ng/ml) + TGFβ-1 (0.5 ng/ml). Xs supplementation was maintained in these experiments. Cultures were evaluated for differentiation properties after 7 days of growth factor exposure. Trypan blue-negative viable cell counts were determined with cells harvested by trypsinization after 7 days of differentiation. For the low cell density differentiation protocol, cells were plated at 103 cells/cm2 in their maintenance growth medium and cultured for 7 days. Phase-contrast micrographs were obtained using a Nikon TE300 microscope system with a Hamamatsu digital camera and Openlab software to capture images.
Immunoblotting procedures
Harvested cells were washed once with ice cold phosphate-buffered saline and then lysed on ice with RIPA buffer [24]. The cell lysates were clarified by centrifugation at 13,000 rpm in an Eppendorf™ microfuge for 30 minutes at 4ºC. They were stored at -70ºC until further analysis. Soluble protein in lysates was quantified using the Bio-Rad DC™ assay. Twenty micrograms of cell lysate protein were separated by SDS-PAGE (8-12% polyacrylamide) and analyzed for specific proteins by immunoblotting as described previously [12]. After primary analysis, immunoblots were re-probed for alpha-tubulin as a quality control to assure that analyses were performed with equivalent amounts of extract protein. All immunoblot experiments were performed 2-4 times with similar results.
Smad 2 phosphorylation analyses
Sub-confluent cells cultured in regular growth medium were treated with TGFβ-1 at 0.5 ng/ml and 2.0 ng/ml concentrations for 30 and 60 minutes. Cell extracts prepared from treated cells were examined for phospho-Smad 2 protein by immunoblotting with antibody specific for phosphorylated forms of Smad 2.
In situ immunofluorescence analyses
ISIF studies were performed exactly as described by Inman et al. [25]. For analysis of nuclear localization of Smad 2/3, a 0.5 ng/ml or 2.0 ng/ml concentration of TGFß-1 was used. For sister pair analyses, Lig 1 and Lig 8 cells were plated at a targeted density of 40 cells/cm2. Following 20 hours of culture, to allow sister pairs to appear, TGFβ-1 was added at 0.5 ng/ml for 1 hour. The cells were then processed for ISIF as for other analyses [25]. ISIF slides were analyzed using a Zeiss Axioskop 2 microscope with motorized stage. The % values reported for different cell fractions in high cell density differentiation analyses are the average for 2 independent experiments. In each experiment, two independent slides were evaluated. Exhaustive, systematic, parallel scanning with 0.5X field separation was performed to eliminate examiner bias and capture the majority of events on a slide without double-counting. The range of total evaluated cells for each determination was 445-1338, except for the single division analysis. In the latter analysis, 29 and 48 sister pairs were evaluated for Lig 1 and Lig 8 cells, respectively.
Results
A persistent subpopulation of cycling cells in cultures of adult rat hepatic DSCs under differentiation conditions
Differentiating cells are always present in cultures of DSC strains, even under conditions for suppression of asymmetric cell kinetics (SACK), reflecting incomplete conversion to symmetric cell kinetics [12,13]. However, the extent of differentiation increases under conditions that favor either production of non-stem cell progeny (e.g., withdrawal of the SACK agent xanthosine [Xs] or low cell density) [12,14] or their differentiation (e.g., serum reduction) [12,13]. For greater differentiation, Lig 8 and Lig 13 rat liver-derived DSC strains were cultured in reduced serum with TGFß-1 and EGF. TGFß-1 induces cell cycle arrest and differentiation by epithelial cells [26]. In combination with EGF, it induces significant hepatic differentiation [27].
The induced differentiation properties of the DSC strains were compared to those of two conventional adult rat hepatic cell lines, Lig 1 and Lig 2. These conventional lines, which were derived in medium without xanthosine supplementation, have properties typical for spontaneously immortalized adult rat hepatic cell lines. They do not exhibit Xs-dependent ACK [12]. Serum reduction caused a marked decrease in their proliferation. Addition of TGFß-1 and EGF augmented this effect (Figure 2A). Consistent with induction of cell cycle exit by Lig 1 and Lig 2 cells, expression of proliferating cell nuclear antigen (PCNA), an indicator of cycling cells, was markedly reduced (Figure 2C, Ind); and 82% of Lig 1 cells lost nuclear PCNA (Figure 2D). In contrast, DSC strain cultures maintained active proliferation (Figure 2A). Three independent subclones of Lig 8 cells (Lig 8, B1-B3) also exhibited continued active proliferation under conditions for differentiation induction (Figure 2B). PCNA expression remained high, and a significant fraction of cells retained nuclear PCNA (Figure 2D; 33% and 32%, respectively, for Lig 8 and Lig 13; see Materials and Methods). Supplemental Xs was not required for this effect (Figure 2C, Ind-X). Quantitatively, the nuclear PCNA-positive cell fraction in DSC cultures was 1.8-fold greater than the fraction in conventional cultures, suggesting a subpopulation that cycled actively under these differentiating conditions.
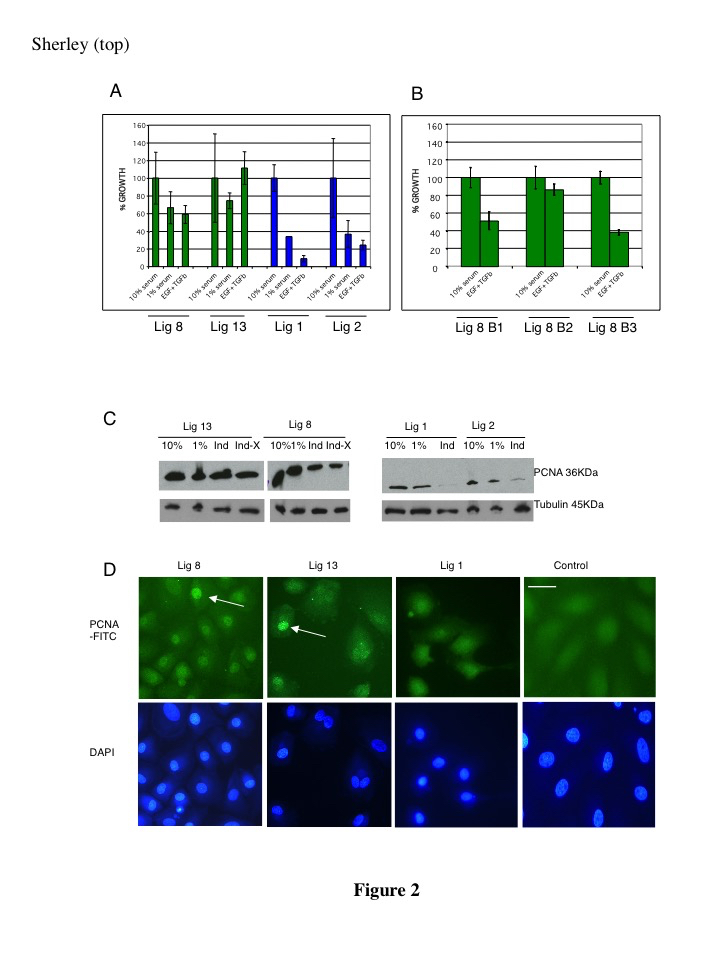
Figure 2. Cultures of DSC strains continue to proliferate under differentiation-inducing conditions. DSC strains (Lig 8 and Lig 13) and conventional cell lines (Lig 1 and Lig 2) were cultured in medium with 10% serum, with 1% serum, or with 1% serum plus EGF and TGFß-1 (EGF+TGFb). A. Viable cell counts were normalized to the number for 10% serum. The average values for three independent experiments are plotted. Error bars indicate standard deviation. B. Data for three independent CFP-expressing subclones of strain Lig 8. The average values for two independent experiments are plotted. Error bars indicate standard deviation. C. Immunoblots for PCNA in control and differentiation-induced cells. Ind, 1% serum plus EGF and TGF; Ind-X, same as Ind, but with xanthosine-free medium. Alpha-tubulin was detected as an extract protein loading indicator. D. ISIF analyses for nuclear PCNA under Ind conditions. PCNA-FITC, PCNA-specific FITC fluorescence. Control, analyses performed with Lig 1 cells with omission of the anti-PCNA specific primary antibody to show background fluorescence. DAPI fluorescence indicates position of corresponding cell nuclei. Arrows, examples of cells that maintain high levels of nuclear PCNA. Scale bar, 20 microns.
Cultures of adult rat hepatic DSC strains display heterogeneous differentiation
Enhanced differentiation was confirmed in all cultures based on expression of the mature hepatic cell protein alpha-1 antitrypsin (AAT). Both DSC and conventional cultures exhibited elevated expression of AAT after exposure to TGFβ-1 (data not shown). Treatment of conventional cells (e.g., Lig 1 cells) with TGFβ-1 and EGF induced uniform cell enlargement with increased cytoplasmic:nuclear ratio and production of bi-nucleated cells (Figure 3B, right panel). Conventional cultures also remained subconfluent, consistent with arrested proliferation. In contrast, cultures of DSC strains reached confluency and showed a heterogeneous morphological response. Some cells were unchanged in morphology, consistent with adifferentiation. Others showed increased cytoplasmic:nuclear ratio and bi-nucleation (Figure 3B, left and middle panels). This heterogeneity was most pronounced for Lig 8 cells, which have the greatest level of ACK [12].
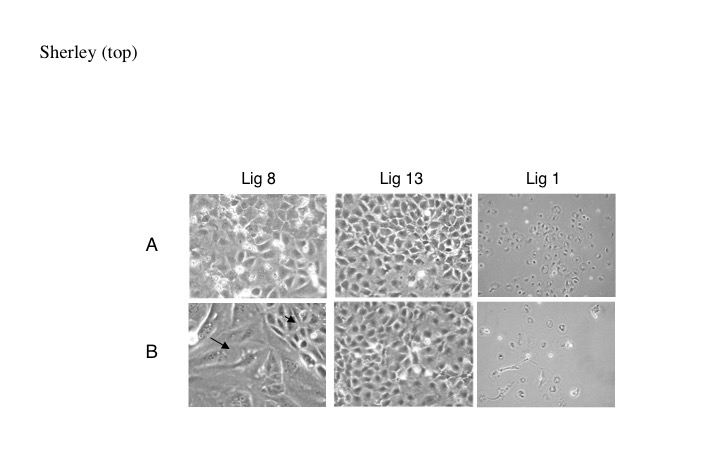
Figure 3. ASC strains maintain a morphologically adifferentiated subpopulation under differentiating conditions. Shown are phase-contrast micrographs of cultures of a conventional hepatic line (Lig 1) or hepatic DSC strains (Lig 8, Lig 13) cultured in 1% serum (A) or 1% serum plus EGF and TGFß-1. (B). Arrowhead, an area of morphologically adifferentiated cells; arrow, area of morphologically differentiated cells.
Detection of a subpopulation of adifferentiated cells with inactive TGFß signaling in cultures of adult rat hepatic DSC strains
To assess the integrity of the TGFß signaling pathway in DSC strains, we investigated the expression and activity of key components. Expression of TGFß receptors type I and II (RI and RII) was detectable for conventional cells and DSC strains (Figure 4A). Treatment with TGFß-1 and EGF led to modest decreases in the expression of both receptors (Figure 4A, Ind). The only remarkable expression difference noted for the DSC strains was a lower RII:RI expression ratio compared to conventional Lig 1 cells (e.g., in Figure 4A, compare RII:RI for the 10% serum condition). Lig 8 cells displayed the smallest ratio. Immunoblotting analyses were also performed to evaluate expression levels of TGFß signaling pathway proteins Smads 2, 3, and 4 [28]. No significant differences were noted in the expression levels of these proteins (data not shown).
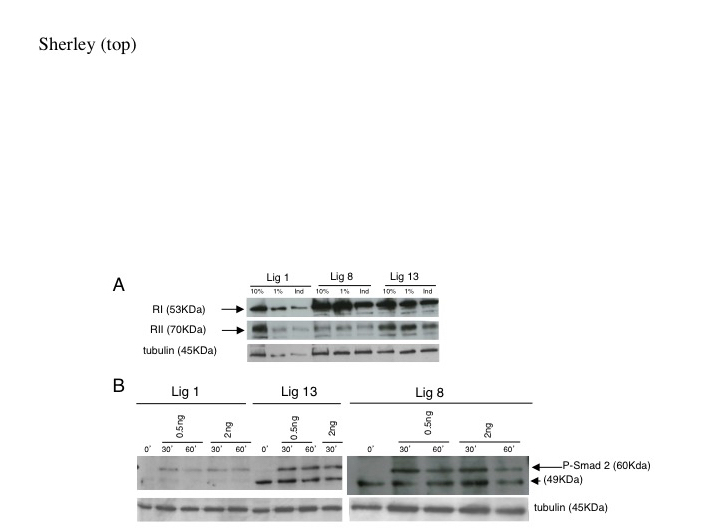
Figure 4. Evaluation of TGFß signaling pathway components in DSC strains. A. TGFß receptors RI and RII analysis. DSC strains (Lig 8 and Lig 13) and conventional cells (Lig 1) were cultured in medium with 10% serum, 1% serum, or 1% serum plus EGF and TGFß-1 (Ind). Cells were analyzed for RI and RII TGFß receptor expression by immunoblotting. All analyses were performed with 20 µg of extract protein except Lig 1-Ind, which had approximately 15 µg. B. Smad 2 phosphorylation analysis. Cells in subconfluent culture with their respective maintenance media were exposed to 0.5 ng/ml or 2.0 ng/ml TGFß-1 for the indicated time in minutes. Induced phospho-Smad 2 was detected by immunoblotting (arrow, P-Smad 2). Arrowhead, denotes an unidentified TGFß-independent, DSC strain-specific species. Alpha-tubulin was detected as a protein loading indicator.
As a measure of hetero-dimerized TGFß I/II receptor function, we evaluated phosphorylation of Smad 2 protein [28]. Phospho-Smad 2 protein was detected in all examined cells within 30 minutes of exposure to TGFβ-1 (Figure 4B). Lig 13 cells, in fact, expressed a higher level of phospho-Smad 2 than conventional Lig 1 cells (Figure 4B, left panel). The phospho-Smad 2 antibody also detected an unidentified, TGFß-1-independent, DSC strain-specific protein with an apparent molecular weight of 49 kilodaltons (Figure 4B, arrowhead). These analyses indicated that, overall, TGFß signaling was intact in some cells of DSC strains. However, given the comparable levels of RI protein levels observed in both DSC and conventional cells (Figure 4A), the difference in RII:RI ratio suggested lower levels of the RII receptor in either all or a subset of DSC strain cells.
Antibodies were not available with sufficient quality to investigate RII expression in individual cells. Therefore, we performed in situ immunofluoresence analyses for Smad 2/3 nuclear localization as an indicator of intact TGFß signaling [28,29]. Nearly all cells in conventional cultures displayed growth factor-induced nuclear Smad 2/3 (Figure 5A, Lig 1, Ind; arrow, example). In contrast, a significant fraction of DSC strain cells maintained primarily cytoplasmic Smad 2/3 (Figure 5A, Lig 8 and Lig 13, Ind; arrow head, examples). These cells were still detected when the concentration of TGFß-1 was increased from 0.5 ng/ml to 2 ng/ml (data not shown). This subpopulation was 20% of Lig 8 cells and 15% of Lig 13 cells. Less than 8% of conventional Lig 1 cells lacked nuclear Smad 2/3 (p < 0.05, by Student’s t-test, for the Lig 1 percentage being different than Lig 8 and Lig 13 percentages).
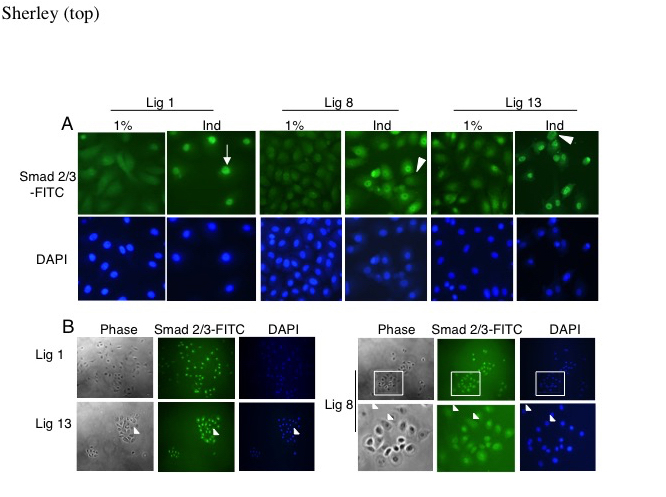
Figure 5. A subpopulation in DSC cultures maintains cytoplasmic Smad 2/3 after TGFß-1 exposure. ISIF analyses were performed to determine Smad 2/3 protein subcellular localization in DSC strains (Lig 8 and Lig 13) and conventional cells (Lig 1). A. High cell density differentiation induction. Cells were cultured in medium with 1% serum or 1% serum plus EGF and TGFß-1 (Ind). Smad 2/3-FITC, Smad 2/3-specific FITC fluorescence. DAPI fluorescence indicates position of corresponding cell nuclei. Arrow, example of a cell with nuclear Smad 2/3. Arrowheads, examples of cells in DSC strain subpopulation that maintains cytoplasmic Smad 2/3. B. Low cell density differentiation with TGFß-1 exposure. Cultures were initiated in respective maintenance medium at a 10-fold lower cell density to enhance ACK [21] and thereby increase the fraction of differentiating progeny cells. After several days, they were exposed to 0.5 ng/ml TGFß-1 for 1 hour and fixed for ISIF. Arrowheads denote examples of infrequent cells found in DSC strain cultures that, although surrounded by cells with nuclear Smad 2/3, still maintain cytoplasmic Smad 2/3. Inset boxes in Lig 8 flourescent micrographs indicate magnified views in bottom row.
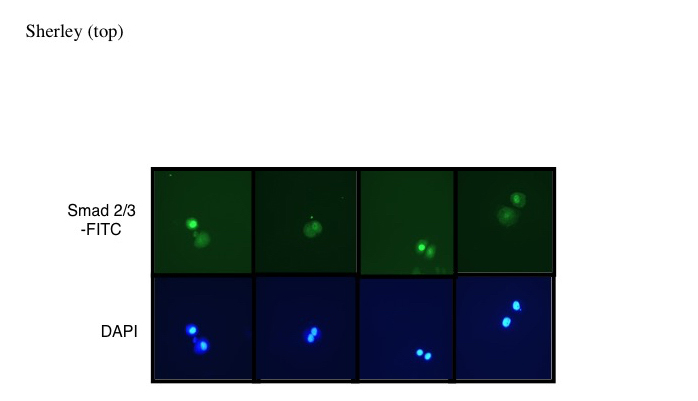
Figure 6. DSC divisions are asymmetric for Smad 2/3 nuclear localization in response to TGFß-1. DSC strain Lig 8 cells were plated at colony formation density and allowed 20 hours for cell divisions to occur. The cells were then exposed to TGFß-1 for 1 hour and fixed for ISIF detection of Smad 2/3. Shown are examples of images for newly-divided paired sister cells that exhibit asymmetric Smad 2/3 nuclear versus cytoplasmic localization. Smad 2/3-FITC, Smad 2/3-specific FITC fluorescence. DAPI fluorescence indicates position of corresponding cell nuclei.
As noted earlier, another factor that governs DSC strain differentiation is cell density. This effect is attributable to an increase in the fraction of differentiating progeny as a consequence of increased ACK at lower cell densities [12,21]. Though the morphology of conventional hepatic cells (Figure 5B, Lig 1) are minimally altered, the DSC strains show spontaneous morphological differentiation at the lower cell density, even though cells are cultured in 10% serum without added growth factors (Figure 5B, Lig 8, Lig 13). Under these conditions, after a 1-hour TGFβ-1 exposure, rare cells lacking nuclear Smad 2/3 were found in cell colonies of the DSC strains (Figure 5B; Lig 8, Lig 13; arrowheads, examples). Often these cells appeared less morphologically differentiated and were surrounded by more differentiated cells with nuclear Smad 2/3 (e.g., see Figure 5B, Lig 8 phase-contrast micrograph inset).
Relationship between adifferentiated cycling cells and cells without Smad 2/3 nuclear localization in cultures of adult rat hepatic DSC strains
To evaluate whether cycling cells displaying nuclear PCNA and cells without nuclear Smad 2/3 localization were the same, two-antibody ISIF was attempted, but the available antibodies were technically incompatible. Quantitative analyses of the independent ISIF analyses was consistent with this conclusion, but not ideally so. For Lig 8 cells, 33% and 20% showed nuclear PCNA and cytoplasmic Smad 2/3, respectively; and the respective values for Lig 13 cells were 32% and 15%, respectively.
For a more specific analysis of the relationship between cells undergoing asymmetric self-renewal to cells exhibiting resistance to TGFß-1, we performed single cell division analyses [12,13]. In a previous report of the cell kinetics symmetry of paired newly-divided sister cells, we found that 84% of Lig 8 cell divisions showed asymmetric self-renewal, producing one cycling adult stem cell that incorporated bromodeoxyduridine (BrdU), and one arrested non-stem cell sister that did not incorporate BrdU. The SACK agent Xs, which was included in the experiments in the present study, reduced this frequency to about 24% [12]. More recently, we have shown that the cycling sister resulting from asymmetric self-renewal divisions continues to divide and produce non-stem cell sisters that are stably arrested in the cell cycle (Ganz and Sherley, unpublished). After treatment with TGFß-1 for 1 hour in the presence of Xs at low colony forming density, 34% of paired newly-divided Lig 8 sister cells were asymmetric for nuclear Smad 2/3 (see Figure 6 for examples). This frequency is 3.4-fold greater (p < 0.03) than the smaller fraction of asymmetric sisters observed for conventional Lig 1 cells, which are expected by chance.
These findings indicate that the fraction of cells undergoing asymmetric adifferentiation can be accounted for by the fraction of cells undergoing asymmetric self-renewal. This more specific analysis of the behavior of TGFß signaling properties of individual cells is consistent with the earlier demonstration that the frequency of PCNA-positive cells approximates the frequency of TGFß-1-resistant cells in high cell density cultures.
Discussion
The reported study was prompted by the initial observation that when Lig 8 and Lig 13 DSC strains were induced by Xs to divide symmetrically, they exhibited resistance to differentiation by TGFβ-1, indicated by their continued proliferation. Subsequent experiments showed that individual DSCs of both cell strains were also resistant to differentiation when they were cycling asymmetrically, in the absence of Xs. These data indicate that DSCs are resistant to differentiation whether they are self-renewing symmetrically or asymmetrically.
The presented data support the conclusion that cells that fail to localize Smad 2/3 to the nucleus after TGFß-1 exposure are the asymmetrically self-renewing DSCs in Lig 8 and Lig 13 cultures. Consistent with this proposal, cells with cytoplasmic Smad 2/3 were infrequent in large TGFß-1-exposed cell colonies (Figure 5B). The conventional cell lines showed a lower, but detectable fraction of nuclear PCNA-positive cells and nuclear Smad 2/3-negative cells under differentiating conditions. These cells are attributed to incomplete differentiation. Consistent with this explanation, Lig 1 cells displayed a 3.4-fold lower occurrence of asymmetric adifferentiation in the single cell division analysis. Based on previous studies [12] and the results reported here, we propose that Lig 8 and Lig 13 cells represent two different types of hepatic DSCs that can maintain a growth factor-insensitive state of adifferentiation. In this state, they continue to cycle asymmetrically producing progeny that undergo differentiation in response to environmental cues.
Several features of this study allow us to establish that the heterogeneous response of rat hepatic DSC strains to differentiation induction is a clonal property. Lig 8 and Lig 13 strains were originally derived by a limiting-dilution culture procedure. Based on the Poisson probability approximation that applies to this procedure, about 27% of established cultures would arise from a single cell. In this report, to confirm the clonal nature of differentiation resistance by the Lig 8 cell strain, we show that three independent subclones of Lig 8 cells (see Materials and Methods) exhibit the same basic Lig 8 property of continued active proliferation under differentiation inducing conditions (Figure 2B). Finally, the single cell division analysis clearly demonstrates that individual cells in Lig 8 cultures possess the property of asymmetric adifferentiation (Figure 6), being able to divide to produce both a TGFß-responsive sister and a non-responsive sister.
The nuclear translocation of Smad 2/3 proteins serves as an early marker for TGFß-1 induced cell differentiation. The kinetics of this response are very fast compared to cell generation time, allowing unambiguous detection of sister cells in two different states of responsiveness. Under the same differentiation promotion conditions, cultures of rat hepatic DSCs also show induction of proteins indicative of hepatocellular differentiation (e.g., alpha-1 antitrypsin; data not shown). We did not use these later markers of more mature differentiation for evaluation of asymmetric adifferentiation. Because the time scale for detection of the induction and expression of later markers is of the same magnitude as cell generation time, second divisions might have occurred before the responses could be evaluated. Second and third divisions would have greatly complicated interpretation of the analyses.
Though qualitatively similar, the frequency of PCNA-positive cells under differentiating conditions was quantitatively greater than the frequency of cells with cytoplasmic Smad 2/3. The greater fraction of PCNA-positive cells may be due to the greater variance encountered in nuclear PCNA determinations (data not shown). Because of this inequivalence, presently, we cannot exclude the possibility that a significant fraction of the persistent cycling cells may also be TGFß-1 responsive. The quantitative discrepancy could also reflect phenotypic asynchronies such as TGFß-1 resistance varying periodically during the cell cycle of asymmetrically self-renewing DSCs.
Cancer cells and embryonic cells also exhibit TGFß-1 resistance [30,31]. The DSC strains used in these experiments have non-transformed properties in culture and are not tumorigenic in immunodeficient mice [12]. The TGFß-resistance of tumor cells may reflect their origin from mutated DSCs [30,32]. Cells in newly formed blastocysts are initially resistant to TGFß, but later in development, cells acquire TGFß sensitivity [31]. Moreover, the basis for TGFß-resistance by mouse embryonic stem cells is lack of RII receptors and corresponding absence of Smad 2 nuclear localization [33].
The finding that the rat hepatic DSC strains exhibit a lower RII:RI expression ratio than the conventional rat hepatic cell lines may reflect lower RII expression in the DSCs. Fetal liver progenitor cells are also TGFß-resistant [33] and clusters of cells in primary fetal hepatocyte cultures have been shown resistant to differentiation by EGF and TGFß [27]. Thus, adifferentiation may be a general property of stem and progenitor cells, whether embryonic or adult; and reduced or absent RII expression may be the molecular basis. However, the decreased ratio of RII to RI expression may be a more important factor than reduced RII per se. We are aware of one earlier report suggesting that the RII:RI ratio is the more important determinant of signaling in response to TGFß-1. When clonal rat intestinal epithelial cell lines were derived by chemical mutagenesis and selected for resistance to TGFß-1 and TGFß-2, their resistance to growth inhibition by TGFß-1 showed the greatest correlation with a higher ratio of TGFß-1 binding to RII versus RI [34].
Our more recent studies with other SACK-derived DSC strains from mouse hair follicles also support the idea of asymmetry in the differentiation capability of the sisters of deterministic asymmetric self-renewal divisions by DSCs [13]. In these studies, the DSC of asymmetric self-renewal divisons was identified definitively by its specific display of chromosomal markers of immortal DNA strands. There are now several reports, both in vivo and in vitro, of DSCs that retain the set of mitotic chromosomes that have the older template DNA strands, called immortal strands. With this basis for identification, newly-divided DSCs consistently showed a higher level of specific histone modifications, which associated with undifferentiated cell states during embryonic development (i.e., H3K4me3 and H3K27me3), compared to their non-stem cell sisters [35].
With this background, we propose that the absence of Smad 2/3 nuclear localization in cultured asymmetrically cycling adult rat liver cells after TGFß-1 challenge also identifies DSCs in the cultures. Given the universal role of TGFß signaling in mammalian tissue development, this property may assist in identifying DSCs from or in many tissues. The general property of asymmetric adifferentiation is predicted to identify DSCs that, unlike their asymmetrically produced progeny cells, are resistant to a variety of specific differentiation factors in respective tissues. Current technologies make this basis for DSC identification feasible in complex culture systems. Future advances in molecular imaging technologies for in vivo investigations may enable this approach for detection and characterization of DSCs in niche, as well.
We have published earlier discussions of the relevance of in vitro analyses of deterministic asymmetric self-renewal by DSCs to stem cell self-renewal dynamics in tissues in vivo [32,35]. There is a currently prevailing school of thought that stochastic self-renewal processes – also called “neutral competition” – predominate in vivo [36,37]. Herein, for the first time, we provide evidence in culture to support the prediction that not only are DSC asymmetric cell kinetics deterministic, but so also is their production of differentiating cell lineages. It seems highly unlikely that the now numerous, and independent, observations of deterministic asymmetric self-renewal by DSCs in vitro will have no significant biological correlate to DSC asymmetric self-renewal dynamics in vivo. Most recently, we have shown the existence of a subpopulation cells in stem cell compartments in vivo that express a new type of molecular marker associated specifically with deterministic asymmetric self-renewal defined in vitro. Called “H2A.Z asymmetry,” [38], the new biomarker detects mitotic cells undergoing immortal strand co-segregation, which so far has proven inseperable from deterministic asymmetric self-renewal by DSCs in culture [13,35,39].
Author contributions
JS contributed to the design of the work, the development of experiments, and interpretation of the results. He was the primary drafter of the report, including critical revising for important intellectual content.
GC was responsible for the design and conduct of the majority of the experiments presented, including acquisition of data, data analysis, and data interpretation. She contributed the development and drafting of the report, including critical revising for important intellectual content.
RT was responsible for the design and conduct of Lig 8 subcloning experiments, including data acquistion, analysis, and interpretation; and the drafting of their description.
All authors gave final approval to the submitted version of the manuscript to be published; and agreed to be accountable for all aspects of the work in ensuring that questions related to the accuracy or integrity of any part of the work are appropriately investigated and resolved.
Funding
This research was supp2021 Copyright OAT. All rights reserv Alliance. R. Taghizadeh was supported by NIH/NIGMS Interdepartmental Biotechnology Training Program Grant #2 T32 GM08334 and NIH/NIGMS Toxicology Training Program Grant #ES07020.
Acknowledgements
We thank Dr. Elena Gostjeva for expert instruction in cell imaging quantification; and we are grateful to the Dr. E. Ozbudak and the van Oudenaarden laboratory at MIT for providing the CFP expression plasmid. Thanks to Dr. J.-F Pare, A. N. Nichols, and M. Ganz for critical review of the manuscript. We are especially grateful to K. Panchalingam for assistance in reviewing experimental data for the manuscript.
References
- Sherley JL (2008) A new mechanism for aging: chemical "age spots" in immortal DNA strands in distributed stem cells. Breast Dis 29: 37-46. [Crossref]
- Loeffler M, Potten CS (1997) Stem cells and cellular pedigrees - a conceptual introduction” in Stem Cells. ed. C. S. Potten (London: Academic Press), 1-27.
- Enver T, Heyworth CM, Dexter TM (1998) Do stem cells play dice? Blood 92: 348-351. [Crossref]
- Blackett N, Gordon M (1999) "Stochastic" -40 years of use and abuse. Blood 93: 3148-3149. [Crossref]
- Sherley JL (2002a) Stem cell differentiation: What does it mean? Proc. Second Joint EMBS-BMES Conf Houston TX 1: 741-742.
- Matioli G, Niewisch H, Vogel H (1970) Stochastic stem cell renewal. Rev Eur Etud Clin Biol 15: 20-22. [Crossref]
- Bjerknes M (1986) A test of the stochastic theory of stem cell differentiation. Biophys J 49: 1223-1227. [Crossref]
- Sherley JL (2002b) Asymmetric cell kinetics genes: The key to expansion of adult stem cells in culture. Stem Cells 20: 561-572.
- Punzel M, Zhang T, Liu D, Eckstein V, Ho AD (2002) Functional analysis of initial cell divisions defines the subsequent fate of individual human CD34(+)CD38(-) cells. Exp Hematol 30: 464-472. [Crossref]
- Paré JF, Sherley JL (2006) Biological principles for ex vivo adult stem cell expansion. Current Topics in Developmental Biology, ed. G. Schatten, (San Diego, CA:Elsevier, Inc.), 73: 141-171.
- Salekh S, Agre NS, Kalakutskiĭ LV (1978) Origin of adifferentiated variants of Streptomyces roseoflavus in submerged culture. Mikrobiologiia 47: 278-282.
- Lee HS, Crane GG, Merok JR, Tunstead JR, Hatch NL, et al. (2003) Clonal expansion of adult rat hepatic stem cell lines by suppression of asymmetric cell kinetics (SACK). Biotechnol Bioeng 83: 760-771. [Crossref]
- Huh YH, Cohen J, Sherley JL (2011) SACK-expanded hair follicle stem cells display asymmetric nuclear Lgr5 expression with non-random sister chromatid segregation. Sci Rep 1: 175.
- Semino CE, Merok JR, Crane GG, Panagiotakos G, Zhang S (2003) Functional differentiation of hepatocyte-like spheroid structures from putative liver progenitor cells in three-dimensional peptide scaffolds. Differentiation 71: 262-270.
- Lee HS, Sherley JL, Chen JJ, Chiu CC, Chiou LL, et al. (2005) EMP-1 is a junctional protein in a liver stem cell line and in the liver. Biochem Biophys Res Commun 334: 996-1003. [Crossref]
- Merok JR, Sherley JL (2001) Breaching the Kinetic Barrier to In Vitro Somatic Stem Cell Propagation. J Biomed Biotechnol 1: 25-27. [Crossref]
- Sherley JL, Panchalingam K (2010) Methods for ex vivo propagation of adult hepatic stem cells. U.S. Patent No. 7,824,912 B2. Washington, DC: U.S. Patents and Trademarks Office.
- Paré J, Sherley J (2013) Ex vivo Expansion of Human Adult Pancreatic Cells with Properties of Distributed Stem Cells by Suppression of Asymmetric Cell Kinetics. J Stem Cell Res Ther 3: 149. [Crossref]
- Sherley JL, Stadler PB, Johnson DR (1995a). Expression of the wild-type p53 antioncogene induces guanine nucleotide-dependent stem cell division kinetics. Proc Natl Acad Sci USA 92: 136-140.
- Sherley JL, Stadler PB, Stadler JS (1995) A quantitative method for the analysis of mammalian cell proliferation in culture in terms of dividing and non-dividing cells. Cell Prolif 28: 137-144. [Crossref]
- Rambhatla L, Bohn SA, Stadler PB, Boyd JT, Coss RA, et al. (2001) Cellular senescence: ex vivo p53-dependent asymmetric cell kinetics. J Biomed Biotech 1: 27-36.
- Rambhatla L, Ram-Mohan S, Cheng JJ, Sherley JL (2005) Immortal DNA strand co-segregation requires p53/IMPDH-dependent asymmetric self-renewal associated with adult stem cells. Cancer Research 65: 3155-3161.
- Taghizadeh RR, Sherley JL (2008) CFP and YFP, but not GFP, provide stable fluorescent marking of rat hepatic adult stem cells. J Biomed Biotechnol 2008: 453590. [Crossref]
- Hinds PW, Finlay CA, Frey AB, Levine AJ (1987) Immunological evidence for the association of p53 with a heat shock protein, hsc70, in p53-plus-ras-transformed cell lines. Mol Cell Biol 7: 2863-2869. [Crossref]
- Inman GJ, Nicolás FJ, Hill CS (2002) Nucleocytoplasmic shuttling of Smads 2, 3, and 4 permits sensing of TGF-beta receptor activity. Mol Cell 10: 283-294. [Crossref]
- Siegel PM, Massagué J (2003) Cytostatic and apoptotic actions of TGF-beta in homeostasis and cancer. Nat Rev Cancer 3: 807-821. [Crossref]
- Sánchez A, Pagan R, Álvarez AM, Roncero C, Vilaró S, et al. (1998) Transforming growth factor-beta (TGF-beta) and EGF promote cord-like structures that indicate terminal differentiation of fetal hepatocytes in primary culture. Exp Cell Res 242: 27-37.
- Massagué J, Wotton D (2000) Transcriptional control by the TGF-beta/Smad signaling system. EMBO J 19: 1745-1754. [Crossref]
- Pierreux CE, Nicolás FJ, Hill CS (2000) Transforming growth factor beta-independent shuttling of Smad4 between the cytoplasm and nucleus. Mol Cell Biol 20: 9041-9054. [Crossref]
- Knudson AG (1992) Stem cell regulation, tissue ontogeny, and oncogenic events. Semin Cancer Biol 3: 99-106. [Crossref]
- Goumans MJ, Ward-van Oostwaard D, Wianny F, Savatier P, Zwijsen A, et al. (1998) Mouse embryonic stem cells with aberrant transforming growth factor beta signaling exhibit impaired differentiation in vitro and in vivo. Differentiation 63: 101-113.
- Sherley JL (2013) New cancer diagnostics and therapeutics from the ninth ‘hallmark of cancer’: symmetric self-renewal by mutated distributed stem cells. Expert Rev Mol Design 13: 797-810.
- Weekx SF, Plum J, Van Cauwelaert P, Lenjou M, Nijs G, et al. (1999) Developmentally regulated responsiveness to transforming growth factor-beta is correlated with functional differences between human adult and fetal primitive hematopoietic progenitor cells. Leukemia 13: 1266-1272.
- Mulder KM, Segarini PR, Morris SL, Ziman JM, Choi HG (1993) Role of receptor complexes in resistance or sensitivity to growth inhibition by TGFß in intestinal epithelial cell clones. J Cell Physiol 154: 162-174.
- Huh YH, Sherley JL (2014) Decreased H3K27 and H3K4 trimethylation on mortal chromosomes in distributed stem cells. Cell Death Dis 5: e1554. [Crossref]
- Klein AM, Simons BD (2011) Universal patterns of stem cell fate in cycling adult tissues. Development 138: 3103-3111. [Crossref]
- Clevers H (2015) STEM CELLS. What is an adult stem cell? Science 350: 1319-1320. [Crossref]
- Huh YH, Noh M, Burden FR, Chen JC, Winkler DA, et al. (2015) Use of sparse feature bioinformatics to identify a novel pattern-specific biomarker for counting asymmetrically self-renewing distributed stem cells. Stem Cell Res 14: 144-154.
- Huh YH, Cohen J, Sherley JL (2013) Higher 5-hydroxymethylcytosine identifies immortal DNA strand chromosomes in asymmetrically self-renewing distributed stem cells. Proc Nat.l Acad Sci USA 110: 16862-16867.