Cold-shock domain containing protein C2 (CSD-C2; also known as PIPPin) is an RNA-binding protein conserved in the evolution that interacts with the 3’-untranslated region (3’-UTR) of rat H1.0 and H3.3 histone messengers. Biolayer interferometry (BLI) is a technique that measures changes in an interference pattern generated from visible light, reflected from an optical layer, and a biolayer which contains molecules of interest. In this study, we used the BLI methodology in order to analyze and describe the binding properties of CSD-C2 and the mRNA encoding the rat brain histone protein H3.3. Recombinant CSD-C2 was incubated with in vitro transcribed, and biotinylated H3.3 RNA fragments bound to streptavidin-conjugated Octet optical biosensors. In order to define the RNA region involved in binding, we used RNA probes corresponding to different portions of H3.3 RNA 3’-UTR.
In this study, we showed that CSD-C2 binds to the last 199 nucleotides of the H3.3 RNA 3’-UTR, and that the apparent affinity constant of the interaction is in the nanomolar range. In addition, this study confirmed that BLI can be a very efficient and reliable method for studying RNA-protein interactions
RNA-protein interactions, CSD-C2, Histone H3.3 RNA, Biolayer interferometry
Abbreviations
CSD-C2: Cold Shock Domain Containing Protein 2; IL-18: Interleukin-18; IL-33: Interleukin-33; RBP: RNA-Binding Protein; 3’-UTR: 3’-Untranslated Region; BLI: Biolayer Interferometry; hnRNP: Heterogeneous nuclear ribonucleoprotein
Post-transcriptional regulation of RNA metabolism depends on a series of regulatory proteins (RNA-binding proteins, RBPs), which contain different RNA-binding motifs as well as domains involved in protein-protein interactions [1]. RNA-RBP association can be modulated by interactions with further proteins, non-coding RNAs, and post-translational modifications of RBPs, all of which can be induced by extracellular signals [2].
During development, mammalian brain accumulates the core histone H3.3, and the linker histone H1.0 [3-5]. The concentration of the corresponding mRNAs decreases around birth, while the corresponding proteins accumulate: these differences depend on post-transcriptional regulatory events [6]. We previously identified a set of H1.0 RNA-binding proteins [7], among which abundant RBPs, such as heterogeneous nuclear ribonucleoprotein (hnRNP) K and hnRNP A1, and molecular chaperones (heat shock cognate 70, Hsc70) [8]. Based on the screening of expression cDNA libraries with labeled, in vitro transcribed histone RNAs, we also cloned the H3.3/H1.0 RNA-binding protein CSD-C2, which contains a cold-shock domain [9]. Moreover, we demonstrated that CSD-C2 protein binds H1.0 and H3.3 RNAs at the end of their 3’-UTRs, in a region encompassing the polyadenylation signal possibly forming a hairpin structure [9]. Co-immunoprecipitation assays showed that some of the identified proteins interact with each other and with other nuclear proteins. For example, we found that CSD-C2 interacts with hnRNP A1, Y-box-binding protein 1 (YB-1), hnRNP K, and probably Hsc70 [8].
Herein, we report kinetics and specificity of CSD-C2 binding to H3.3 mRNA, as well as identification of the H3.3 RNA region more directly involved in binding.
In vitro transcription and 3’-end biotinylation of RNA
pR4 and pM4 plasmids [7,9] were linearized by restriction with Hind III and used as templates for in vitro transcription (Riboprobe system, Promega, WI). RNA was precipitated with ethanol, collected by centrifugation at 10,000 x g for 15 min, air dried and resuspended in distilled water.
All the RNA fragments produced by in vitro transcription were subsequently biotinylated using the "RNA 3'-end biotinylation kit" from Pierce (Thermo Fisher Scientific, Waltham, MA), according to the manufacturer's instructions.
Recombinant proteins
Recombinant (6-his-tagged) CSD-C2 was purified as previously reported [10].
Human recombinant (6-his-tagged) IL-18 and IL-33 were a kind gift from Dr. Ronald Tynes of the Northwestern University, Muttenz, Switzerland.
Biolayer interferometry (BLI)
Kinetics of CSD-C2 binding to its RNA substrates was studied by the FortéBio Octet Red instrument (FortéBio, Menlo Park, CA). Binding assays were performed in black 96-well plates at 30°C, under agitation (1000 rpm), in phosphate buffered saline buffer, containing 0.01% Tween (PBST). Two picomoles of biotinylated ligand RNA in PBS buffer were loaded on the surface of the streptavidin-conjugated biosensors (SA) for 600s. To ensure correct loading of the biotinylated RNA, also a biotinylated IRE control RNA from Pierce (Thermo Fisher Scientific, Waltham, MA) was loaded.
To minimize unspecific interactions between the analyte and the sensor, unreacted streptavidin molecules on the tips were quenched with 1 mg/ml of biocytin. A 500-800s biosensor washing step was applied before association of the biosensor-bound ligand and the analyte (CSD-C2, IL-18, or IL-33) in solution (different concentrations of protein were applied for 500-800s). Finally, dissociation was followed for 500-800s. Correction of any systematic baseline drift was done by subtracting the shift recorded for a sensor loaded with analyte in the absence of any ligand. Data analysis and curve fitting were done using the Octet software version 7.0. Experimental data were fitted with the binding equations available for 1:1 interaction. Only data with an R2 of >0.90 were included in the analysis. As the fittings did not exactly match experimental data only apparent kinetic data are reported. All the experiments were repeated at least three times.
In the last decades, the critical role played by post-transcriptional regulation of mRNA metabolism and trafficking in the fine tuning of the genetic and epigenetic programs of cells has been increasingly clarified [2]. Both in embryogenesis and in differentiated tissues, post-transcriptional regulation of mRNA fate depends on the activity of a variety of RNA-binding proteins (RBPs), some of which have a general role in the regulation of stability, translation, and/or localization of multiple species of RNAs, while others seem to play a more specific role, given their ability to recognize and bind only one message (or a few of them). RBPs recognize consensus sequences and/or structural features, mostly (but not always) present in the 3'-UTR of mRNAs [11,12], and can probably also interact with short non-coding RNAs, known as miRNAs [13]. Post-transcriptional regulation of gene expression, and hence the role of RBPs are particularly determinant in the nervous system. In spite of being mononuclear cells, neurons are indeed the most asymmetric cells in the body, with highly specialized “peripheries”, in which even single synapses seem to be specifically “tagged” (because of neuronal activity) with peculiar proteins and functions [14].
In order to shed more light on the specific/general functions of RBPs, it is of the most importance to ascertain not only qualitatively but also quantitatively the properties of mRNA-RBP interactions. Many protocols are available to investigate the ability of native proteins in a tissue, as well as of recombinant proteins produced ad hoc, to bind specific in vitro transcribed mRNAs, one of the most efficient being the T1 RNase protection assay [15]. This kind of analyses, however, does not offer the opportunity to evaluate the binding constants for the interaction. On the other hand, it has been reported by many Authors the efficiency of Biolayer interferometry (BLI) for accurately measuring a variety of parameters of ligand-ligand interactions.
Previously, we reported the existence, in the developing rat brain, of a variety of RBPs, some of which have been cloned; among these latter proteins, CSD-C2 was found to bind specifically the 3’-UTR of the mRNAs encoding the core histone variant H3.3, and the linker histone variant H1.0, respectively. Our previous experiments showed, in particular, that CSD-C2 binds the very end of the 3’-UTR of both mRNAs, which includes the signal sequence for polyadenylation [9]. More recently, based on preparative affinity chromatography and co-immunoprecipitation assays, we also found that CSD-C2 is part of a group of proteins forming, with at least H1.0 RNA, a complex in which some proteins probably bind directly to RNA, while others do not [8].
In order to better analyze the binding ability of CSD-C2, we decided to adopt BLI as an approach for confirming, on one hand, ability of CSD-C2 to bind H3.3 mRNA, while measuring, on the other hand, more precisely the binding constants for this interaction.
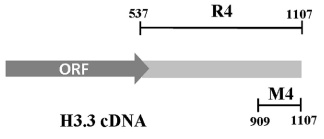
Preliminary experiments with whole H3.3 RNA showed that BLI experiments cannot be performed with large RNAs, probably because of irregular folding of the molecules when bound to sensors. As mentioned above, we previously showed that rat brain CSD-C2 protein binds to H3.3 mRNA at the level of its 3’ end [9]. In order to confirm the ability of the 3’-UTR of the H3.3 RNA to bind CSD-C2, and to calculate the affinity of this interaction, we used two RNA probes (Figure 1): R4, which corresponds to the whole 3’-UTR of the messenger, and M4, which corresponds to the last 199 nucleotides of the 3’-UTR. After biotinylation, the probes were used in the BLI binding assays, as described in Experimental Procedures.

Figure 1. Schematic map of rat H3.3 cDNA. 3’UTR spans from nt 537 to nt 1107. R4 fragment, whole 3’-UTR; M4 fragment, nt 909-1107 of the 3’-UTR.
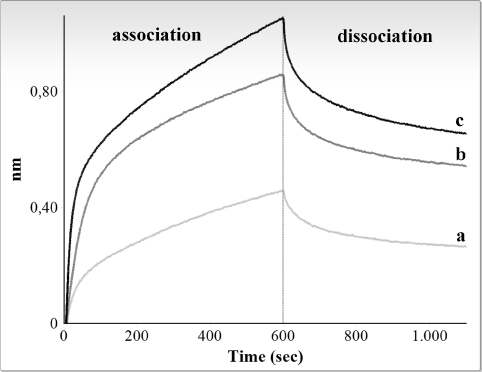
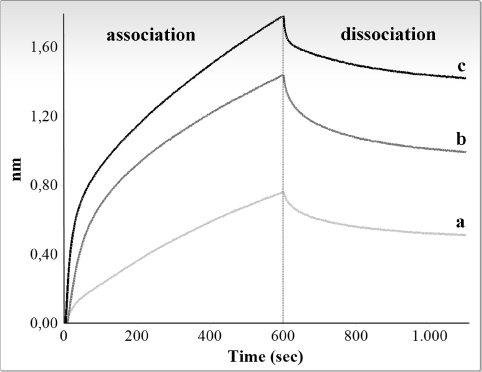
Figure 2 and 3 show graphic representations of typical binding experiments, using, respectively, R4 and M4 RNA and increasing amounts (10-40 ng/μl, i.e., 0.3-1.3 μM) of the CSD-C2 protein.

Figure 2. Interferometry analysis of the interaction between immobilized biotinylated R4 fragment and rat CSD-C2 protein. Only association and dissociation steps are shown. Response in nanometers is plotted against time for different concentrations of CSD-C2. Graphic shows values obtained at 10 ng/μl (a), 20 ng/μl (b), and 40 ng/μl (c).

Figure 3. Interferometry analysis of the interaction between immobilized biotinylated M4 fragment and rat CSD-C2 protein. Only association and dissociation steps are shown. Response in nanometers is plotted against time for different concentrations of CSD-C2. Graphic shows values obtained at 10 ng/μl (a), 20 ng/μl (b), and 40 ng/μl (c).
Binding curve fitting were obtained using the 1:1 fitting model and were then processed to calculate the affinity constants. Experiments were repeated 4 times for each fragment: Table 1 summarizes mean values of the apparent association and dissociation constants of the reactions for R4 and M4 fragments, and the mean values of the estimated affinity constants.
Table 1. Apparent KD values calculated for the interaction between CSD-C2 protein (analyte) and the two fragments of the 3’-UTR of H3.3 histone RNA R4 and M4 (ligands), shown in Figure 1
Ligand |
Analyte |
Apparent K on (M-1s-1) |
Apparent K off
(s-1) |
Apparent KD (nM) |
M4 RNA |
CSD-C2 |
7,39 ± 1,68 × 10³ |
5,57 ± 1,97 × 10⁻⁴ |
74,0 ± 18,2 |
R4 RNA |
CSD-C2 |
2,27 ± 1,70 × 10⁴ |
6,89 ± 2,16 × 10⁻⁴ |
45,3 ± 29,9 |
The results obtained confirmed that CSD-C2 binds to the last 199 nucleotides of H3.3 mRNA (M4 region) and also allowed to estimate the interaction constants (apparent KD: 4,53 × 10⁻⁸ M). In a distinct set of BLI experiments, we analyzed the interaction between a biotinylated fragment spanning from nt 1400 to 1712 of rat H1.0 RNA and CSD-C2 protein, and the estimated KD of the reaction was also in the nanomolar range (unpublished results). As already mentioned, for both RNAs the binding region to CSD-C2 is localized in the last part of the 3’-UTR, encompassing the polyadenylation site, suggesting that in vivo regulation of polyadenylation of these RNAs by CSD-C2 could be involved in their expression.
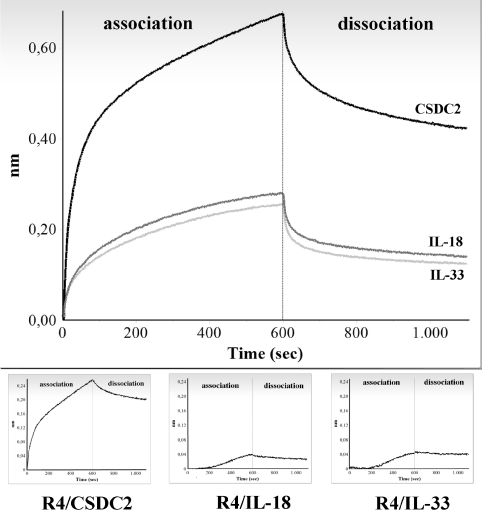
To demonstrate the H3.3 messenger binding specificity to CSD-C2, a set of control experiments was carried out incubating biotinylated R4 and M4 RNAs with recombinant IL-18 and IL-33 proteins as control analytes. Upper panel of Figure 4 shows, as an example, graphic representation of the binding between R4 RNA and one of the following proteins: CSD-C2, IL-18 and IL-33, all used at the same concentration (660nM). Plotted values are whole binding responses of the reactions, and, as can be seen, the responses obtained from control interleukins are very low compared with CSDC2: moreover, dissociation reactions are negligible, suggesting that the reactions are unspecific.
2021 Copyright OAT. All rights reserv

Figure 4. Graphical representation of the absolute values obtained from the analysis of the interactions between R4 fragment and CSDC2 (black line), IL-18 (dark grey line), or IL-33 (light grey line). Only association and dissociation steps are shown. Responses are plotted against time of reaction. All proteins have been loaded at a concentration of 660 nM.
Lower inserts are graphic representation of the values for R4/CSDC2, R4/IL-18, or R4/IL-33 interactions obtained subtracting binding values of the corresponding protein to the sensors (unspecific binding) from the values represented in the upper panel.
To ascertain that the differences in the binding responses were not due to a higher unspecific binding of the CSD-C2 to the sensors, compared to IL-18 or IL-33, binding values were also calculated subtracting the binding response of each protein to the sensor, in the absence of RNA, from the whole binding responses; subtracted values obtained for each protein are reported in the individual lower panels, and demonstrate that the higher binding response of CSD-C2 is actually due to RNA binding.
Binding analyses using M4 RNA and IL-18 or IL-33 produced similar results (data not shown).
The results obtained confirmed that CSD-C2 binds to last 199 nucleotides of H3.3 mRNA (M4 region) and also allowed to estimate the interaction constants (apparent KD: 4,53 × 10⁻⁸ M).
In addition, this study confirmed that BLI can be a very efficient and reliable method for studying RNA-protein interactions, and could be of great help in modelling the pathways at work in the cells to build up RNA-protein complexes formed by multiple proteins, with different affinities for RNA.
The authors thank Dr. Ronald Tynes (Institute for Chemistry and Bioanalytics, School of Life Sciences, Northwestern University, Muttenz, Switzerland) for the kind gift of recombinant IL-18 and IL-33 proteins.
This work was supported by the University of Palermo, Italy, and by the University of Applied Life Sciences Northwestern Switzerland, Muttenz, Switzerland.
- Burd CG, Dreyfuss G (1994) Conserved structures and diversity of functions of RNA-binding proteins. Science 265: 615-621. [Crossref]
- Di Liegro CM, Schiera G, Di Liegro I (2014) Regulation of mRNA transport, localization and translation in the nervous system of mammals (Review). Int J Mol Med 33: 747-762. [Crossref]
- Wenderski W, Maze I (2016) Histone turnover and chromatin accessibility: Critical mediators of neurological development, plasticity, and disease. Bioessays 38: 410-419. [Crossref]
- Castiglia D, Cestelli A, Scaturro M, Nastasi T, Di Liegro I (1994) H1(0) and H3.3B mRNA levels in developing rat brain. Neurochem Res 19: 1531-1537. [Crossref]
- Zink LM, Hake SB (2016) Histone variants: nuclear function and disease. Curr Opin Genet Dev 37: 82-89. [Crossref]
- Scaturro M, Cestelli A, Castiglia D, Nastasi T, Di Liegro I (1995) Regulation of mRNA transport, localization and translation in the nervous system of mammals. Neurochem Res 20: 969-976. [Crossref]
- Scaturro M, Nastasi T, Raimondi L, Bellafiore M, Cestelli A, et al. (1998) J Biol Chem 273: 22788-22791.
- Di Liegro CM, Schiera G, Proia P, Saladino P, Di Liegro I (2013) Identification in the rat brain of a set of nuclear proteins interacting with H1° mRNA. Neuroscience 229: 71-76. [Crossref]
- Nastasi T, Scaturro M, Bellafiore M, Raimondi L, Beccari S, et al. (1999) PIPPin is a brain-specific protein that contains a cold-shock domain and binds specifically to H1 degrees and H3.3 mRNAs. J Biol Chem 274: 24087-24093.
- Saladino P, Di Liegro CM, Proia P, Sala A, Schiera G (2012) RNA-binding activity of the rat calmodulin-binding PEP-19 protein and of the long PEP-19 isoform. Int J Mol Med 29: 141-145.
- Szostak E, Gebauer F (2013) Translational control by 3'-UTR-binding proteins. Brief Funct Genomics 12: 58-65. [Crossref]
- Erson-Bensan AE (2016) Alternative polyadenylation and RNA-binding proteins. J Mol Endocrinol 57: F29-34. [Crossref]
- Bartel DP (2009) MicroRNAs: target recognition and regulatory functions. Cell 136: 215-233. [Crossref]
- Si K, Kandel ER (2016) The Role of Functional Prion-Like Proteins in the Persistence of Memory. Cold Spring Harb Perspect Biol 8: a021774. [Crossref]
- Zaidi SH, Malter JS (1994) Iron and the translation of the amyloid precursor protein (APP) and ferritin J Biol Chem 269: 24007-24013.


